
DXY:
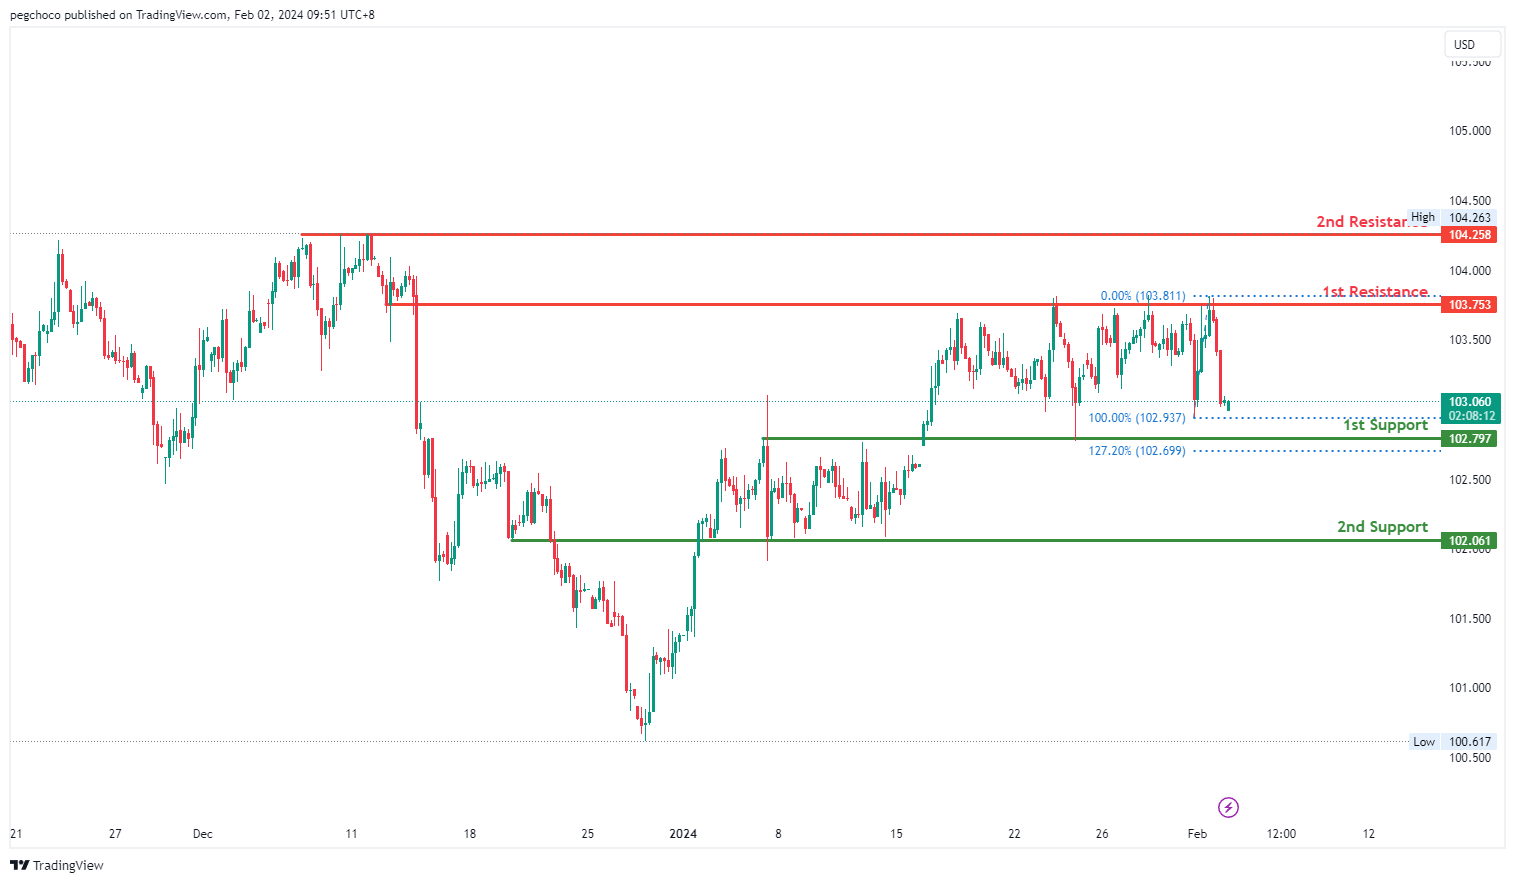
The DXY (US Dollar Index) chart currently exhibits a neutral overall momentum, suggesting a lack of a strong trend in either direction. Price could potentially fluctuate between the 1st resistance and 1st support levels.
The 1st support level at 102.79 is identified as an overlap support and is reinforced by the presence of the 127.20% Fibonacci Extension. This suggests that it has historical significance and could potentially act as a strong support level where buying interest may emerge.
There is also a 2nd support level at 102.06, described as an overlap support, further emphasizing its importance as a potential support zone.
On the resistance side, the 1st resistance level at 103.75 is categorized as an overlap resistance, indicating that it represents a historical point where the price has encountered resistance in the past.
The 2nd resistance level at 104.25 is identified as a multi-swing high resistance, suggesting that it is another historical level where the price has faced resistance.
EUR/USD:
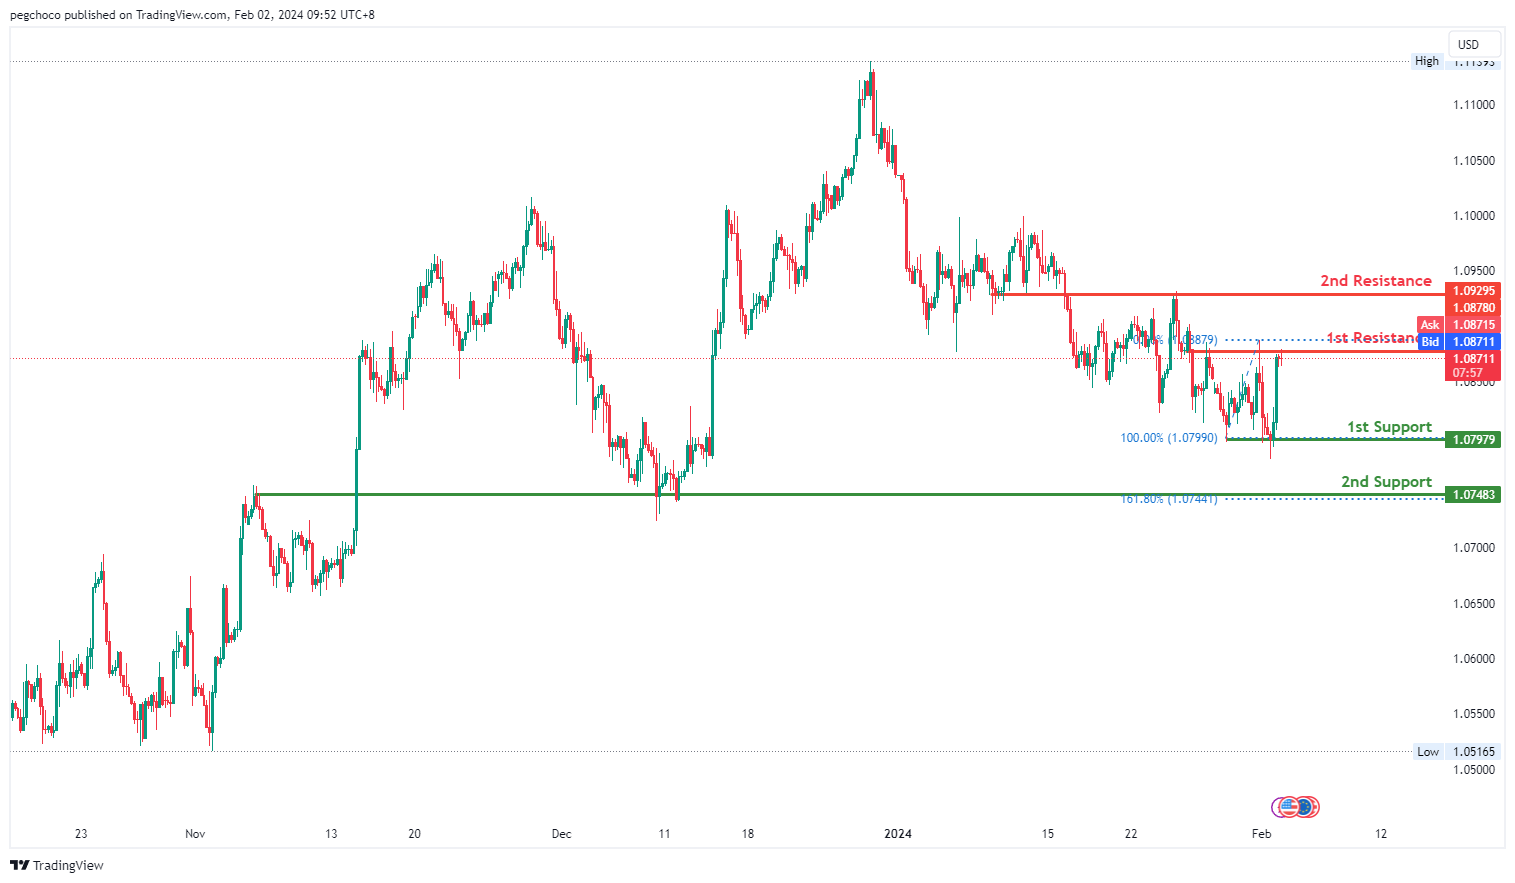
The EUR/USD chart currently exhibits a bearish overall momentum, indicating a downward trend. According to the analysis, the price could potentially experience a bearish reaction off the 1st resistance level and drop to the 1st support.
The 1st support level at 1.0797 is identified as a multi-swing low support, suggesting that it has historical significance as a potential support level where buying interest may emerge.
There is also a 2nd support level at 1.0748, described as an overlap support, and it is reinforced by the presence of the 161.80% Fibonacci Extension, further emphasizing its importance as a potential support zone.
On the resistance side, the 1st resistance level at 1.0878 is categorized as an overlap resistance, indicating that it represents a historical point where the price has encountered resistance in the past.
The 2nd resistance level at 1.0929 is identified as another overlap resistance, suggesting that it is another historical level where the price has faced resistance.
EUR/JPY:
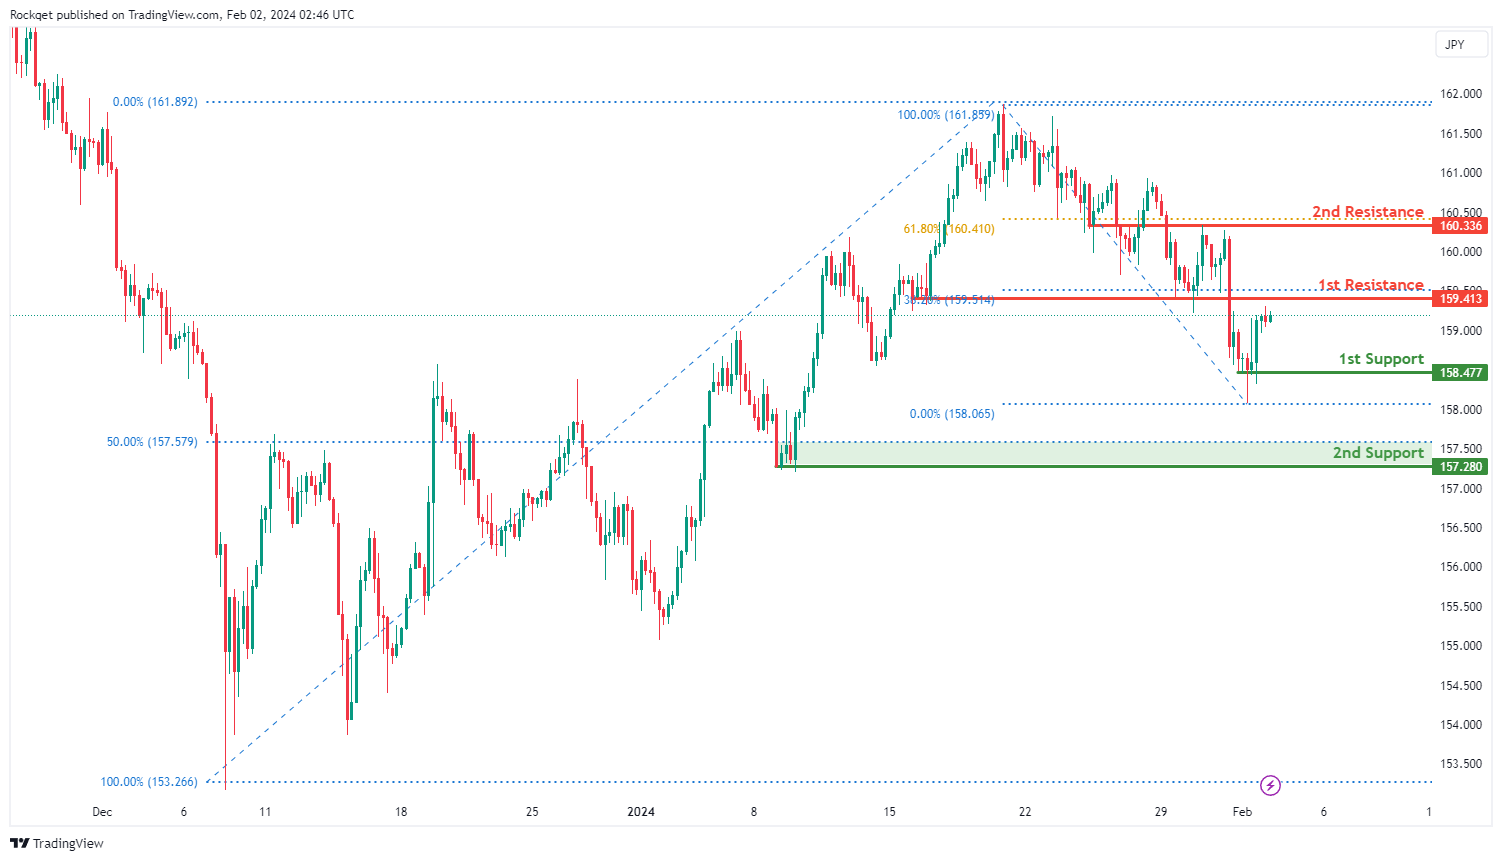
The EUR/JPY chart currently exhibits a bullish overall momentum, indicating a prevailing upward trend. Price could potentially experience a bullish continuation towards the 1st resistance level.
The 1st support at 158.477 is considered favorable for being a swing low support, indicating a historical level where buying interest has previously emerged.
The 2nd support at 157.280 is recognized as a swing low support and aligns with the 50% Fibonacci Retracement, adding confluence to its significance.
On the resistance side, the 1st resistance at 159.413 is highlighted as a pullback resistance and coincides with the 38.20% Fibonacci Retracement, potentially acting as a barrier to the bullish momentum.
The 2nd resistance at 160.336 is identified as an overlap resistance and aligns with the 61.80% Fibonacci Retracement, further strengthening the potential resistance zone.
EUR/GBP:
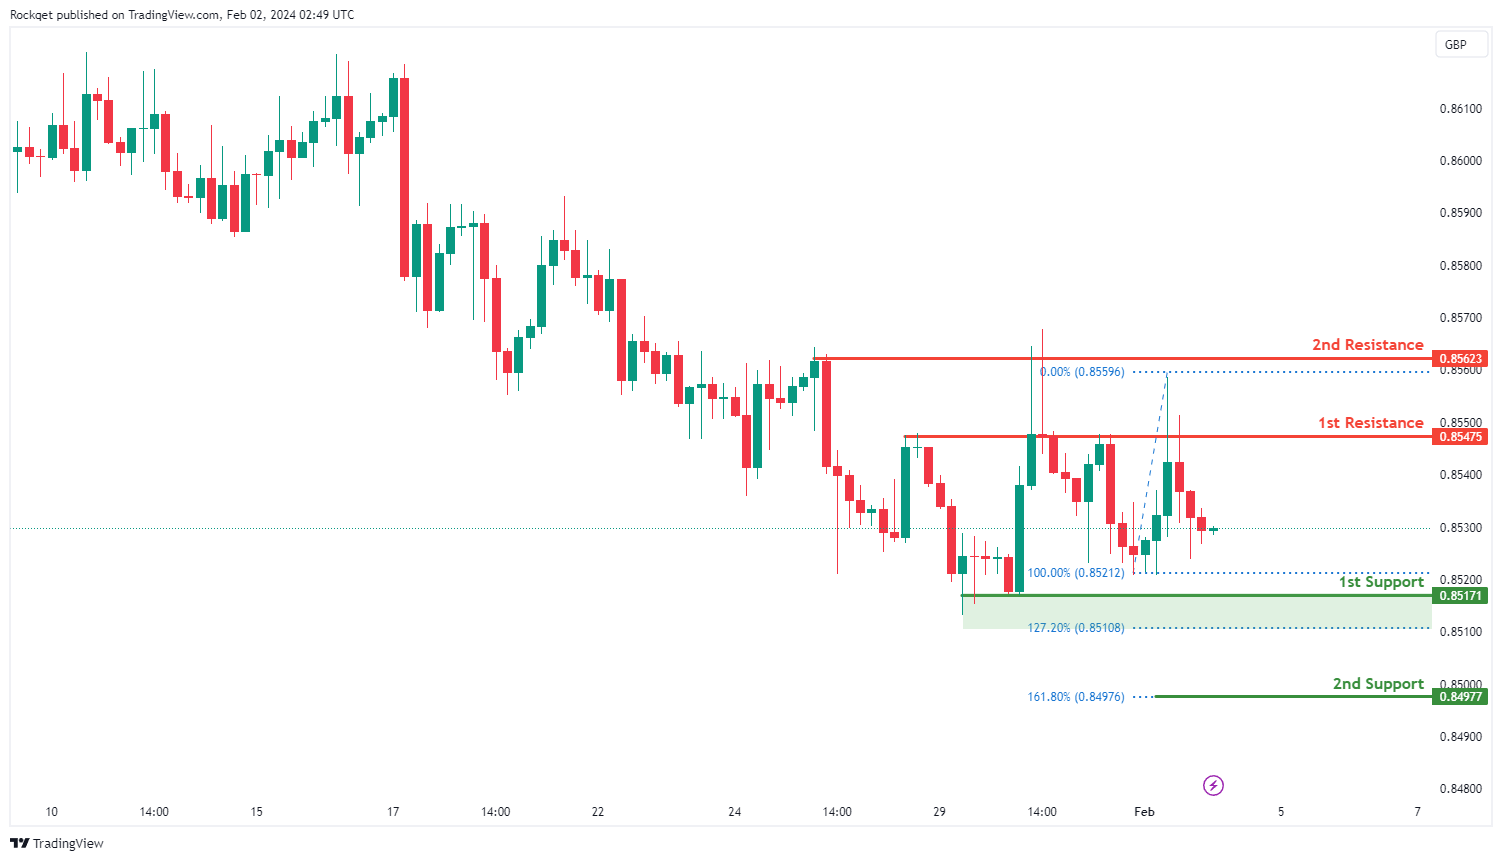
The EUR/GBP chart currently indicates a neutral overall momentum, suggesting a lack of a clear trend direction. Price could potentially experience fluctuations between the 1st support and 1st resistance levels.
The 1st support at 0.85171 is considered favorable for being a swing low support and aligns with the 127.20% Fibonacci Extension, providing a historical level where buying interest has previously emerged.
The 2nd support at 0.84977 is identified as the 161.80% Fibonacci Extension, adding confluence to its significance.
On the resistance side, the 1st resistance at 0.85450 is highlighted as a pullback resistance, potentially acting as a barrier to upward movements.
The 2nd resistance at 0.85623 is recognized as another pullback resistance, suggesting a potential upper limit to the price fluctuations.
GBP/USD:
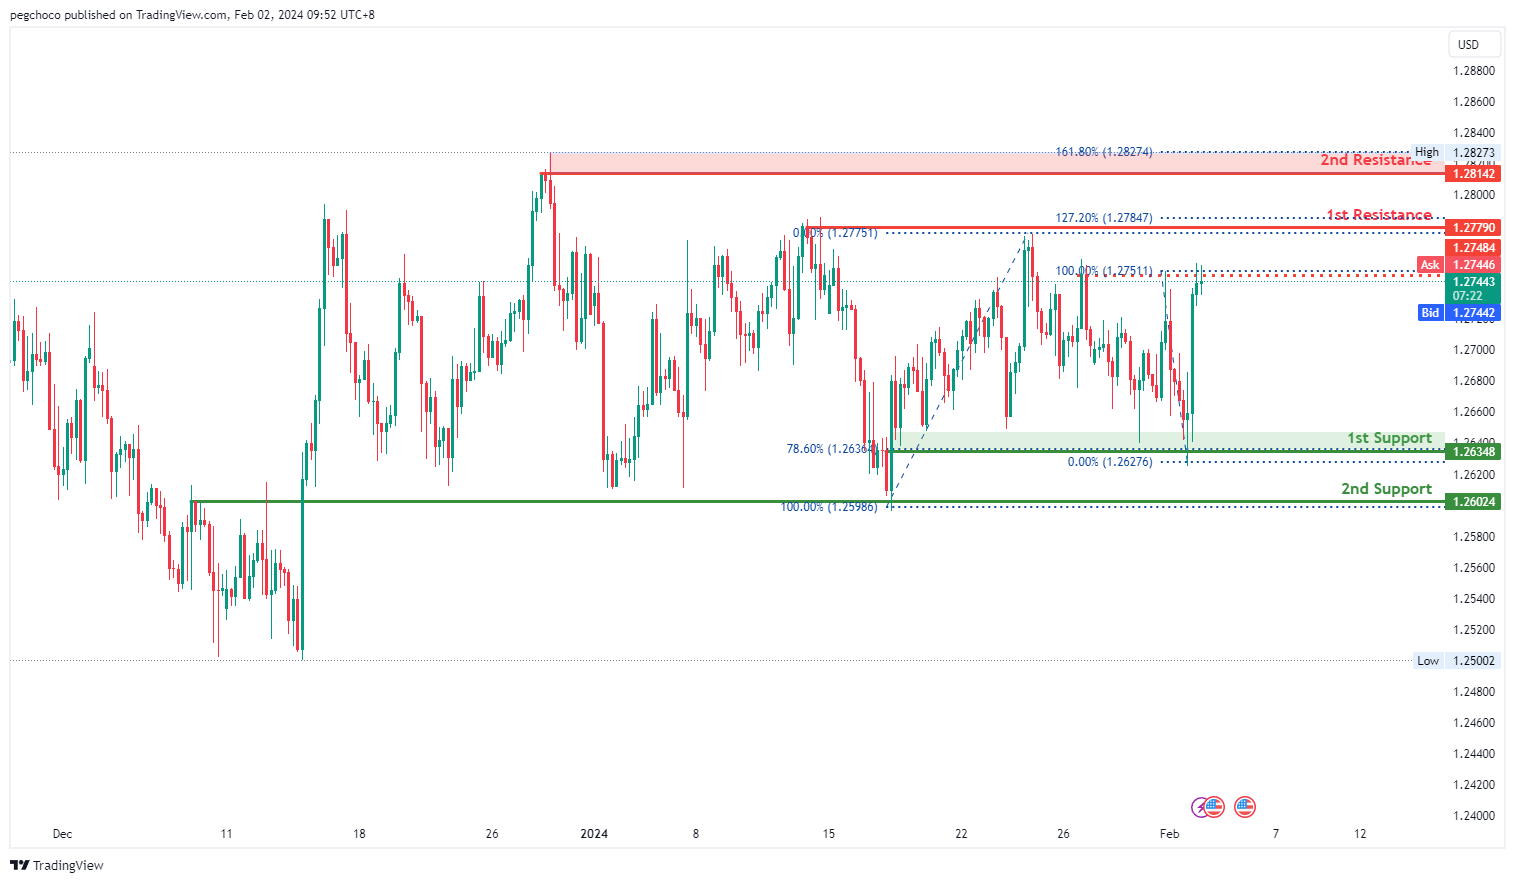
The GBP/USD chart currently exhibits a bearish overall momentum, indicating a downward trend. As per the analysis, the price could potentially undergo a bearish reaction off the 1st resistance level and subsequently drop to the 1st support.
The 1st support level at 1.2648 is identified as a multi-swing low support and is reinforced by the presence of the 78.60% Fibonacci Retracement, suggesting that it has historical significance and may act as a strong support level where buying interest could emerge.
There is also a 2nd support level at 1.2601, described as an overlap support, further emphasizing its importance as a potential support zone.
On the resistance side, the 1st resistance level at 1.2779 is categorized as a multi-swing high resistance and is reinforced by the presence of the 127.20% Fibonacci Extension.
The 2nd resistance level at 1.2815 is identified as a swing high resistance and is further reinforced by the presence of the 161.80% Fibonacci Extension. Additionally, there is an intermediate resistance level at 1.2748, categorized as a multi-swing high resistance.
GBP/JPY:
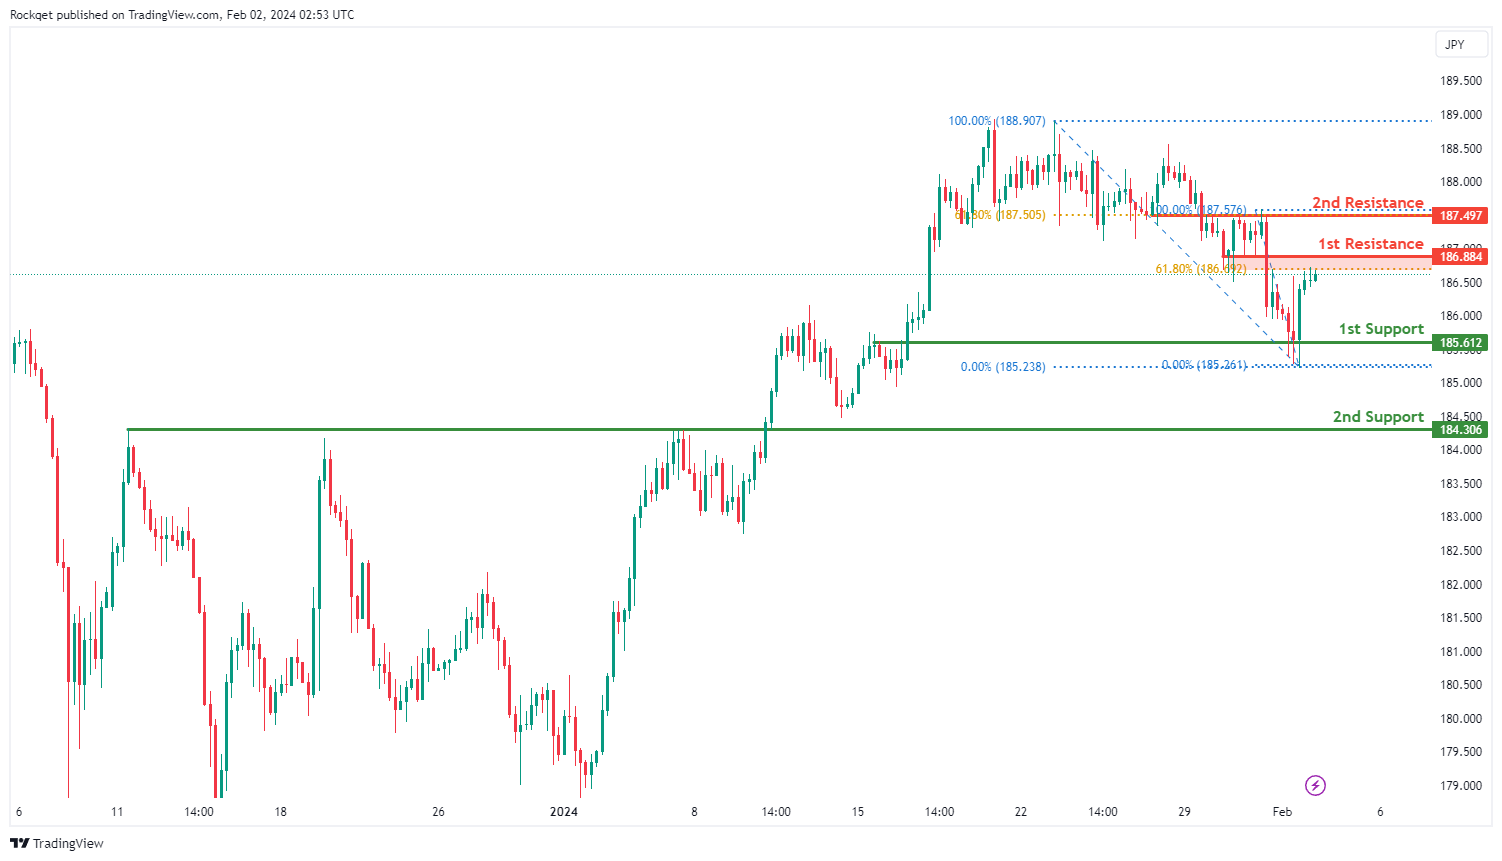
The GBP/JPY chart currently indicates a bullish overall momentum, suggesting a prevailing upward trend. There are indications that the price could potentially continue its bullish movement towards the 1st resistance level.
The 1st support at 185.612 is considered favorable as it aligns with an overlap support, indicating a historical level where buying interest has previously emerged.
Additionally, the 2nd support at 184.306 is identified as a pullback support, providing additional strength to the potential support zone.
On the resistance side, the 1st resistance at 186.884 is highlighted as it coincides with an overlap resistance and the 61.80% Fibonacci Retracement, suggesting a potential barrier to the bullish momentum.
The 2nd resistance at 187.497 is also recognized as an overlap resistance and aligns with the 61.80% Fibonacci Retracement, adding further significance.
USD/CHF:
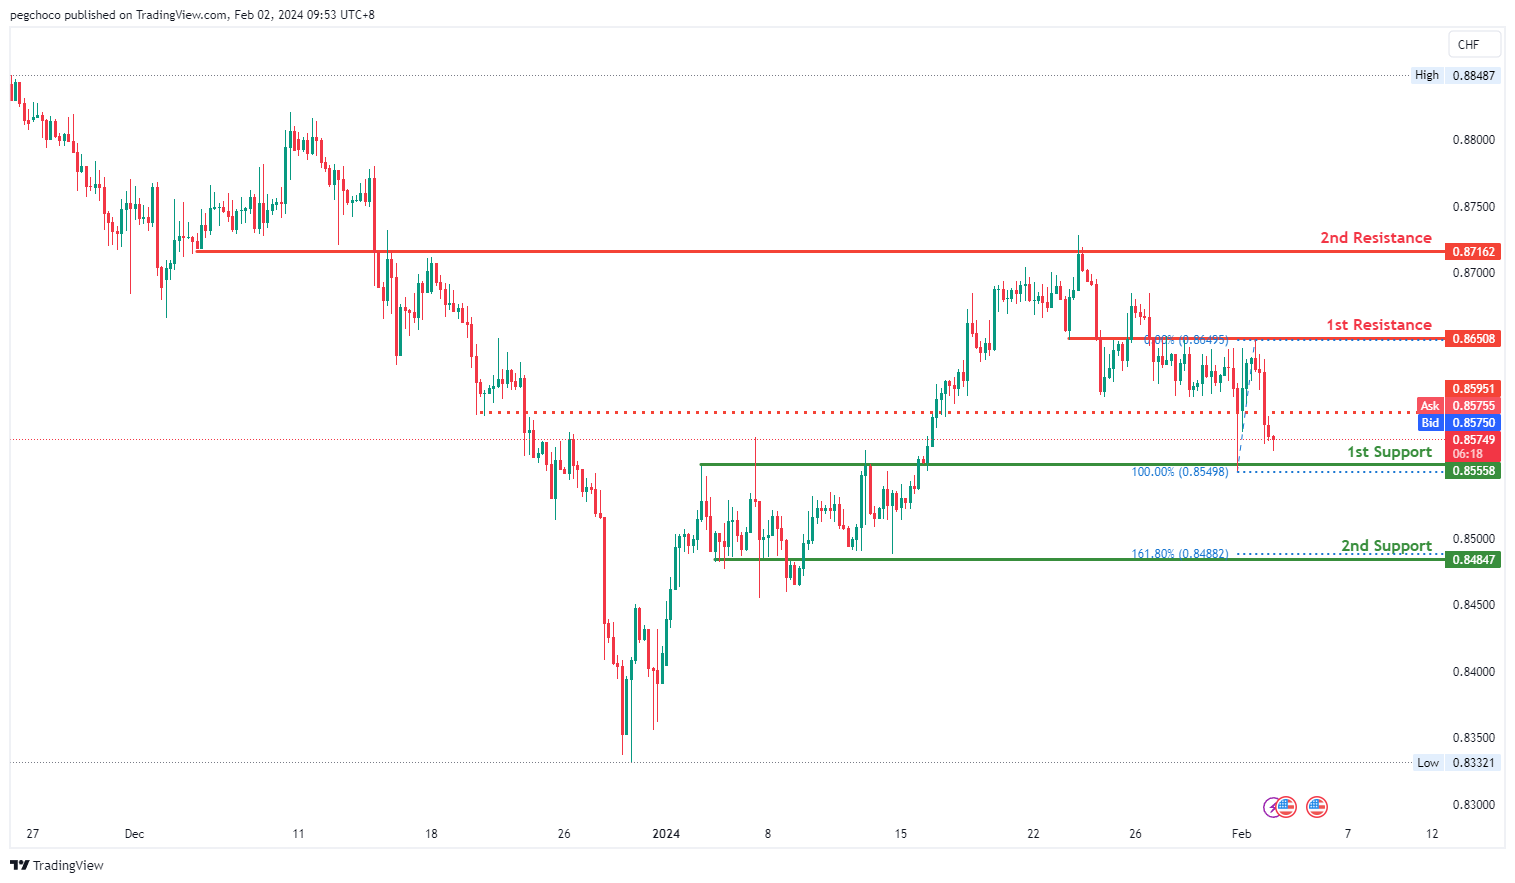
The USD/CHF chart currently exhibits a bearish overall momentum, indicating a downward trend. According to the analysis, the price could potentially experience a rise towards the 1st resistance level in the short term before reversing off it and dropping towards the 1st support.
The 1st support level at 0.8555 is identified as an overlap support, suggesting that it represents a historical point where the price has found support in the past.
There is also a 2nd support level at 0.8840, described as a pullback support and associated with the 161.80% Fibonacci Extension, further emphasizing its importance as a potential support zone.
On the resistance side, the 1st resistance level at 0.8650 is categorized as an overlap resistance, indicating that it represents a historical point where the price has encountered resistance in the past.
The 2nd resistance level at 0.8716 is also identified as an overlap resistance, further reinforcing its significance as a potential barrier to upward movement. Additionally, there is an intermediate resistance level at 0.8595, categorized as a pullback resistance.
USD/JPY:
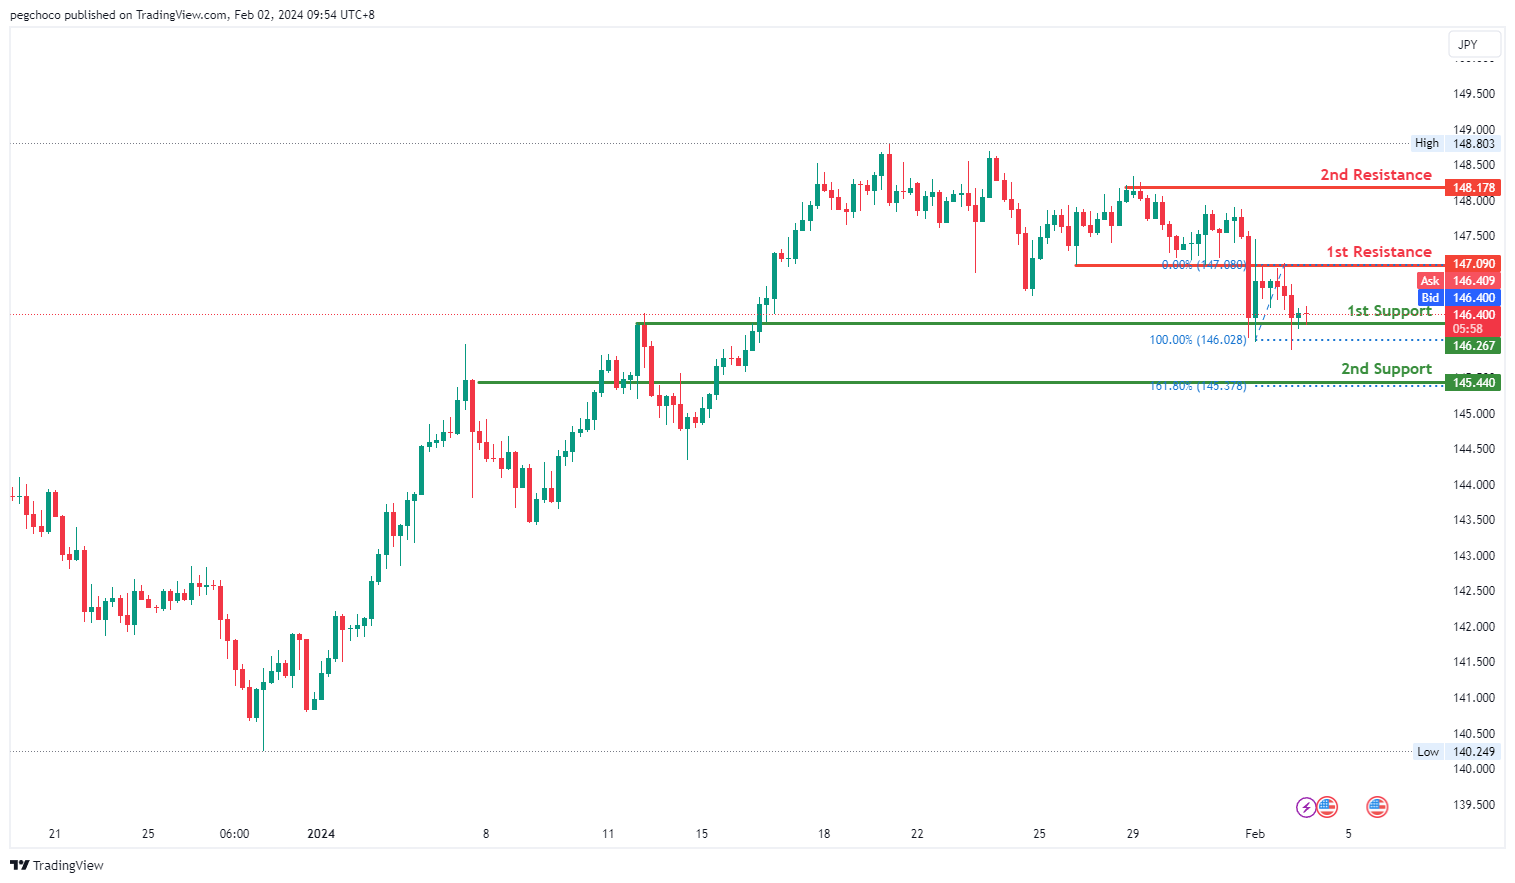
The USD/JPY chart currently exhibits a bearish overall momentum, indicating a downward trend. According to the analysis, the price could potentially experience a rise towards the 1st resistance level in the short term before reversing off it and dropping towards the 1st support.
The 1st support level at 146.26 is identified as an overlap support and is reinforced by the presence of the 127.20% Fibonacci Extension. This suggests that it has historical significance and could potentially act as a strong support level where buying interest may emerge.
There is also a 2nd support level at 145.44, described as a pullback support and associated with the 161.80% Fibonacci Extension, further emphasizing its importance as a potential support zone.
On the resistance side, the 1st resistance level at 147.09 is categorized as an overlap resistance, indicating that it represents a historical point where the price has encountered resistance in the past.
The 2nd resistance level at 148.17 is identified as a multi-swing high resistance, suggesting that it is another historical level where the price has faced resistance.
USD/CAD:
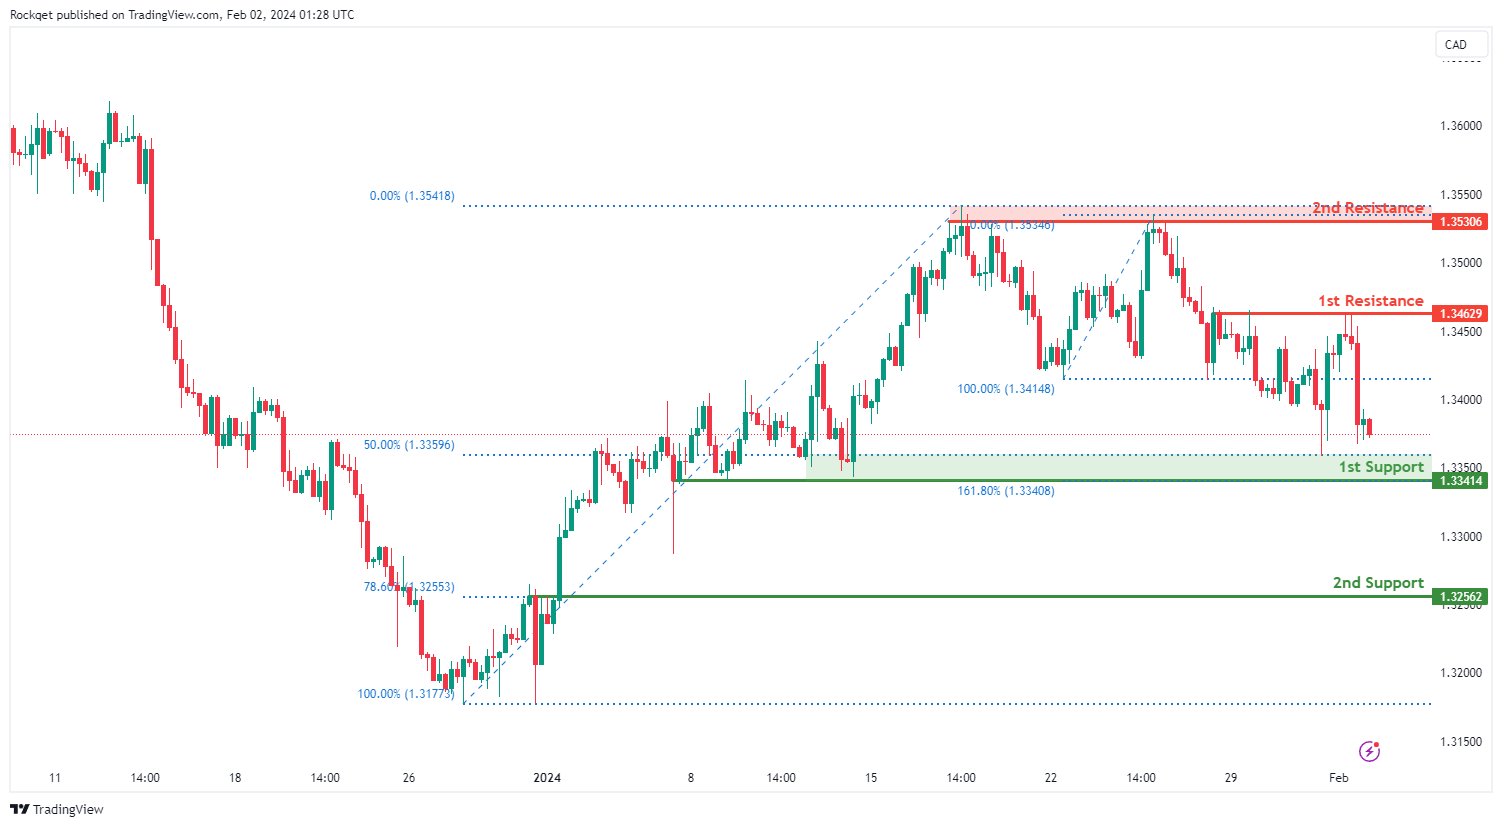
The USD/CAD chart currently exhibits an overall bearish momentum. In this context, there is a potential scenario for price to make a bearish continuation towards the 1st support level.
The 1st support level at 1.3341 is identified as a pullback support that aligns with a confluence of Fibonacci levels i.e. the 50.00% Retracement and the 161.80% Extension. Further below, the 2nd support level at 1.3256 is also marked as a pullback support that aligns with the 78.60% Fibonacci Retracement level, further emphasizing its importance as a potential support zone.
On the resistance side, the 1st resistance level at 1.3462 is identified as a pullback resistance. Higher up, the 2nd resistance level at 1.3530 is noted as a multi-swing-high resistance, further highlighting its importance as a potential resistance point.
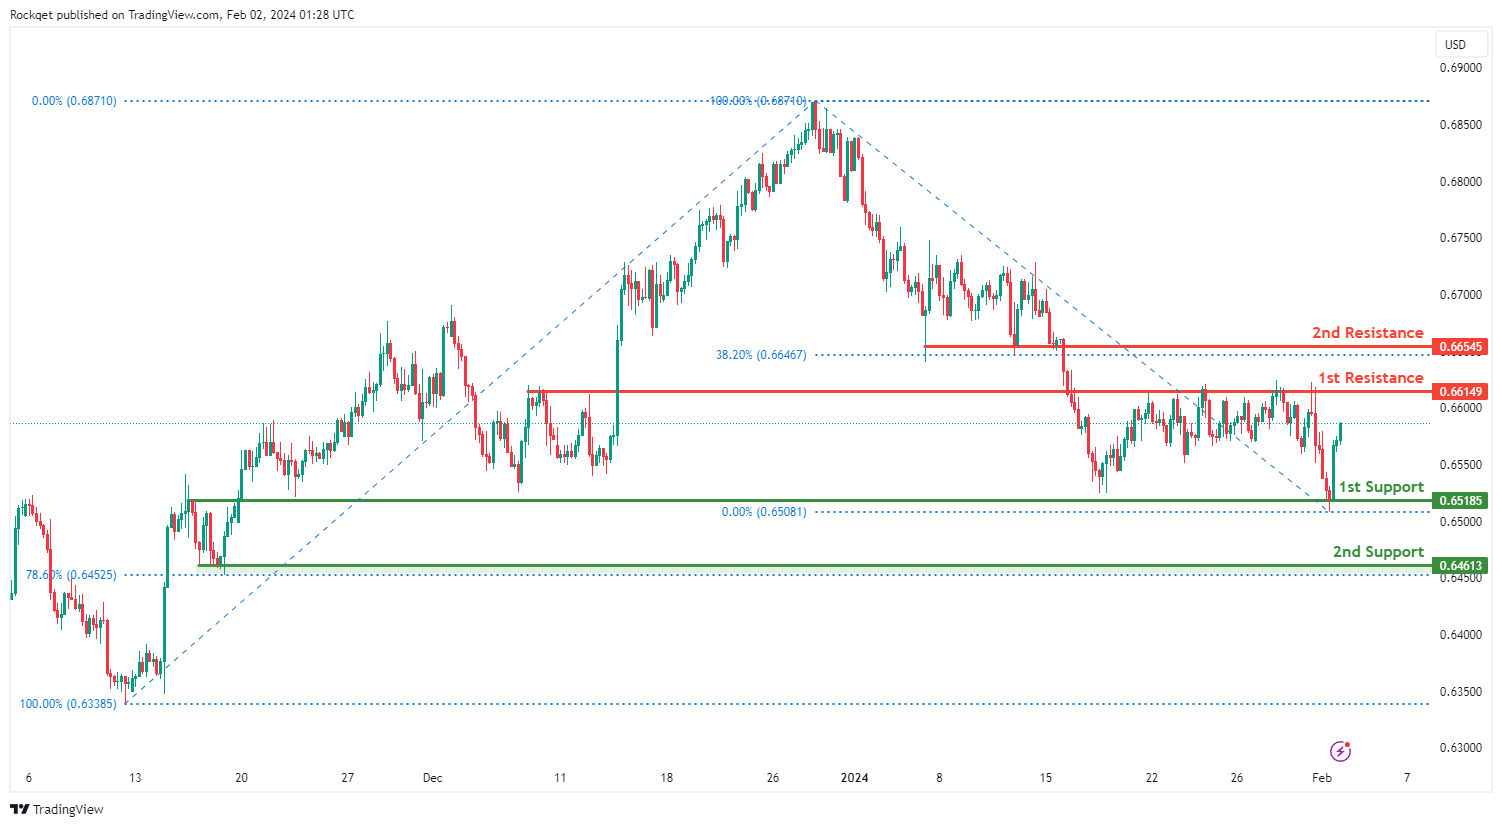
AUD/USD:
The AUD/USD chart currently exhibits a neutral bias. In this context, there is a potential scenario for price to fluctuate between the 1st resistance and 1st support.
The 1st resistance level at 0.6614 is identified as a pullback resistance. Higher up, the 2nd resistance level at 0.6654 is also marked as a pullback resistance that aligns with the 38.20% Fibonacci Retracement level, further highlighting its importance as a potential resistance point.
On the support side, the 1st support level at 0.6518 is identified as a pullback support. Further below, the 2nd support level at 0.6461 is also noted as a pullback support that aligns close to the 78.60% Fibonacci Retracement level, further emphasizing its importance as a potential support zone.
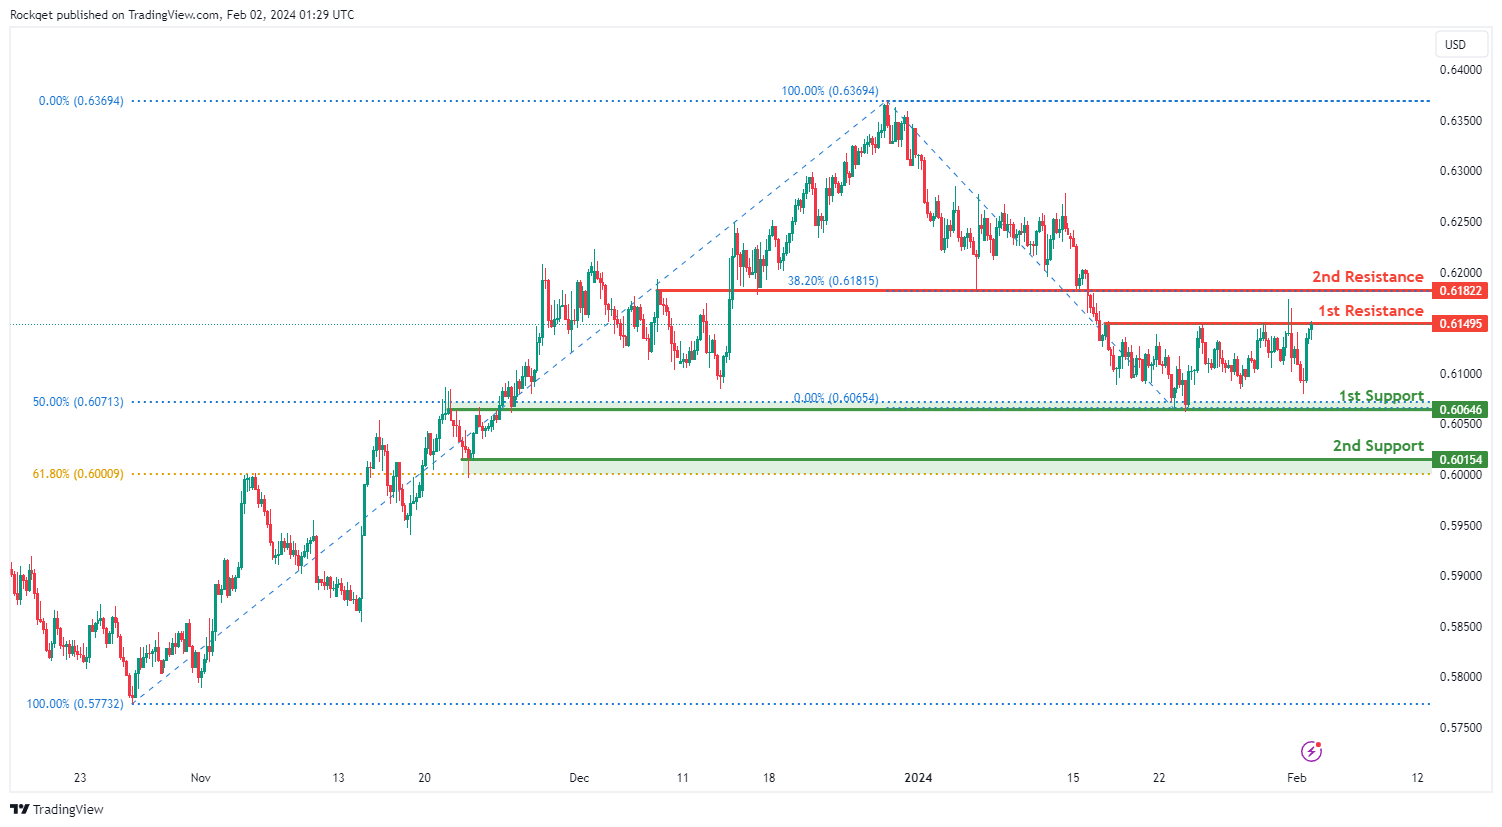
NZD/USD
The NZD/USD chart currently exhibits a neutral bias. In this context, there is a potential scenario for price to fluctuate between the 1st resistance and 1st support.
The 1st resistance level at 0.6149 is identified as a pullback resistance. Higher up, the 2nd resistance level at 0.6182 is marked as an overlap resistance that aligns with the 38.20% Fibonacci Retracement level, further highlighting its importance as a potential resistance point.
On the support side, the 1st support level at 0.6064 is identified as an overlap support that aligns with the 50.00% Fibonacci Retracement level. Further below, the 2nd support level at 0.6015 is noted as a pullback support that aligns close to the 61.80% Fibonacci Retracement level, further emphasizing its importance as a potential support zone.
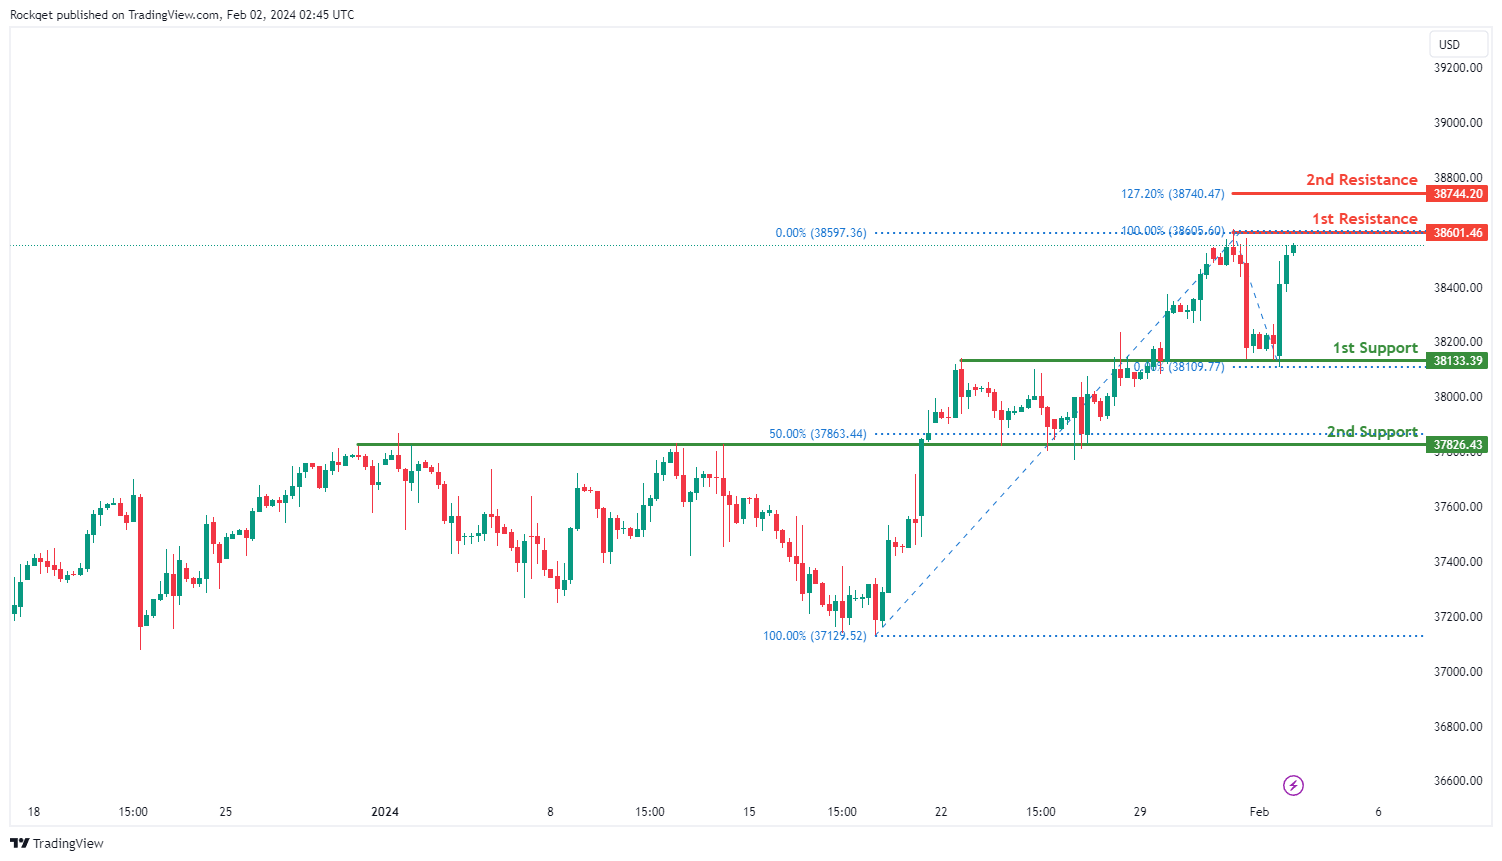
DJ30:
The DJ30 chart currently displays a bullish overall momentum, indicating a prevailing upward trend. There are indications that the price could potentially continue its bullish movement towards the 1st resistance level.
The 1st support at 38133.39 is considered favorable as it aligns with an overlap support, indicating a historical level where buying interest has previously emerged.
Additionally, the 2nd support at 37826.43 is identified as an overlap support and coincides with the 50% Fibonacci Retracement, providing additional strength to the potential support zone.
On the resistance side, the 1st resistance at 38601.46 is highlighted as it aligns with a swing high resistance, suggesting a potential barrier to the bullish momentum.
The 2nd resistance at 38744.20 is recognized as it coincides with the 127.20% Fibonacci Extension, adding further significance to this resistance level.
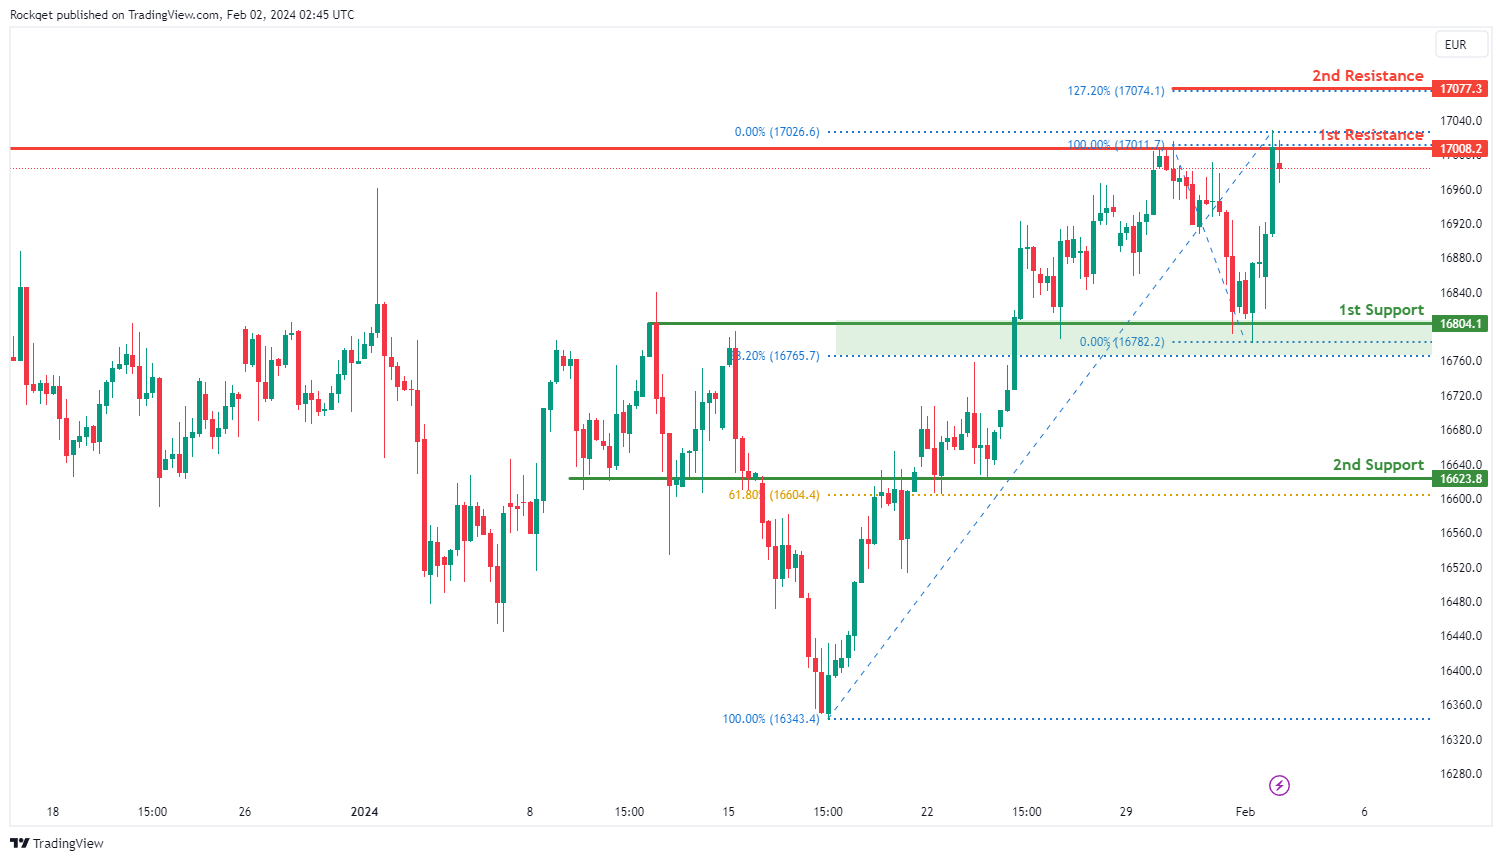
GER40:
The GER40 chart currently exhibits a bullish overall momentum, suggesting a prevailing upward trend. Several factors contribute to this bullish momentum, indicating a potential continuation of the upward movement in the price.
The 1st support at 16804.1 is considered favorable for several reasons. It aligns with an overlap support, indicating a historical level where buying interest has previously emerged. Additionally, this support level coincides with the 38.20% Fibonacci Retracement, adding confluence to its significance.
The 2nd support at 16623.8 is identified as an overlap support and aligns with the 61.80% Fibonacci Retracement, providing additional strength to the potential support zone.
On the resistance side, the 1st resistance at 17008.2 is highlighted as it aligns with multi-swing high resistance, suggesting a potential barrier to the bullish momentum.
The 2nd resistance at 17077.3 is recognized as it coincides with the 127.20% Fibonacci Extension, adding further significance to this resistance level.
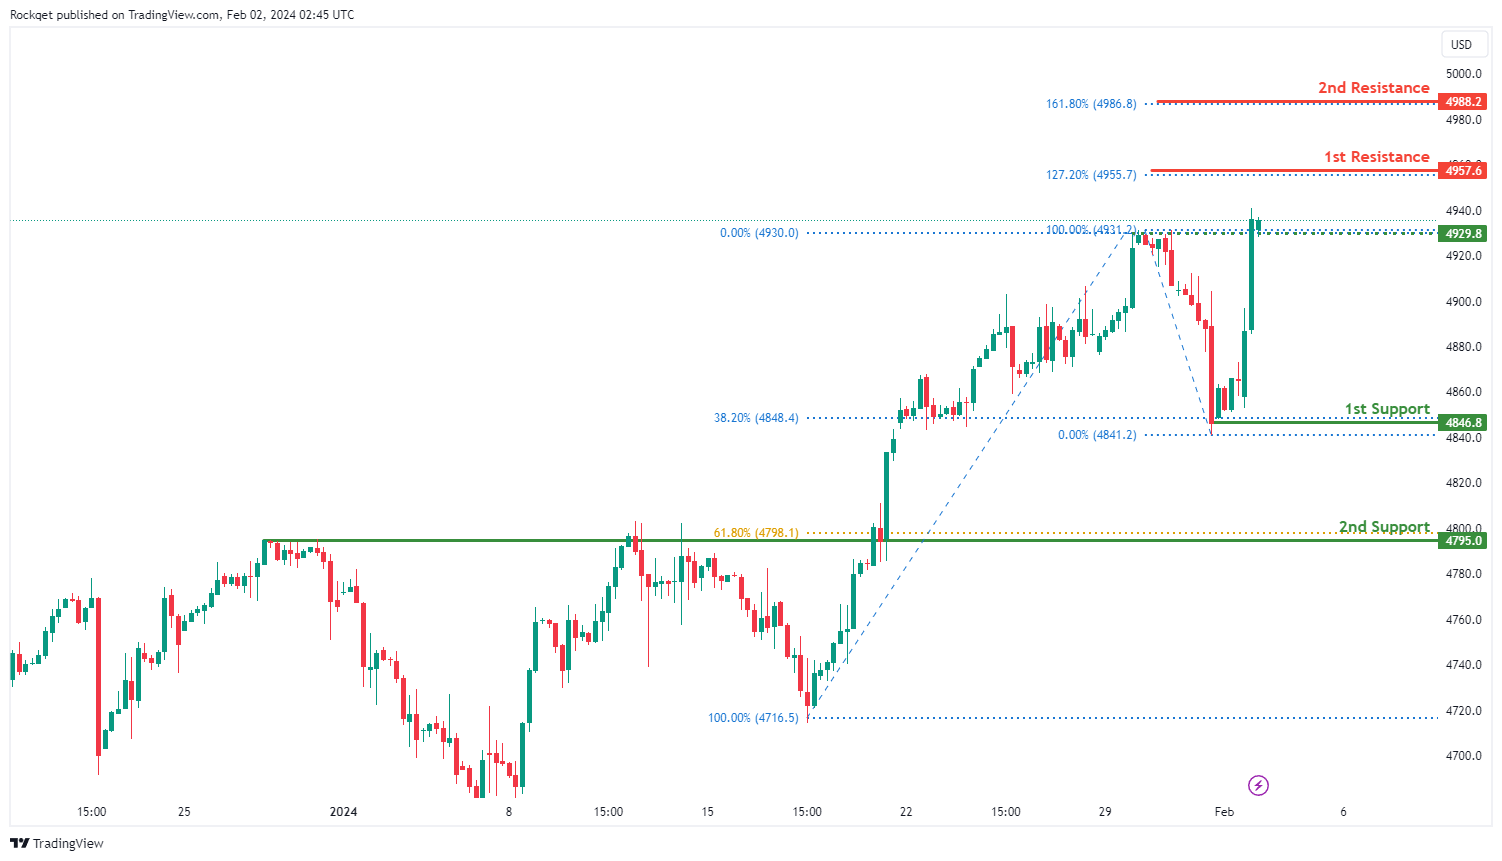
US500:
The US500 chart currently demonstrates a bullish overall momentum, indicating a prevailing upward trend. Several factors contribute to this bullish momentum, suggesting the potential for continued upward movement in the price.
The 1st support at 4846.8 is considered favorable for multiple reasons. Firstly, it is identified as a swing low support, signifying a historical level where buying interest has previously emerged. Additionally, this support level aligns with the 38.20% Fibonacci Retracement, adding confluence to its significance.
The 2nd support at 4795.0 is recognized as an overlap support and coincides with the 61.80% Fibonacci Retracement, providing additional strength to the potential support zone.
The intermediate support at 4929.8 is identified as a pullback support, contributing further to the robustness of the support levels.
On the resistance side, the 1st resistance at 4957.6 is highlighted as it aligns with the 127.20% Fibonacci Extension, suggesting a potential barrier to the bullish momentum.
The 2nd resistance at 4988.2 is also recognized, coinciding with the 161.80% Fibonacci Extension, adding additional significance to this resistance level.
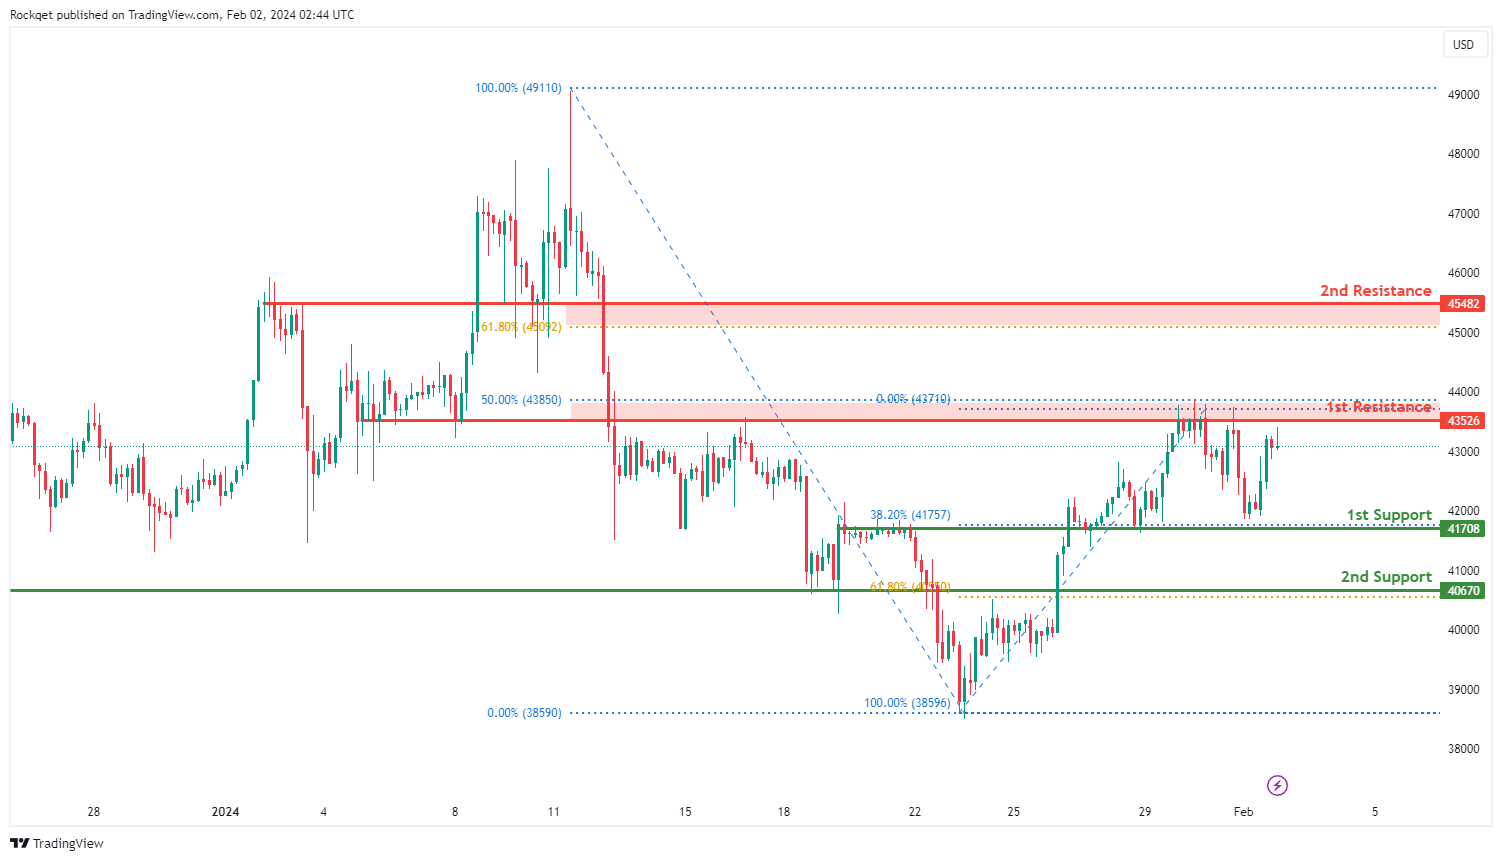
BTC/USD:
The BTC/USD chart currently exhibits a bullish overall momentum, suggesting a prevailing upward trend. Several factors contribute to this bullish momentum, indicating the potential for continued upward movement in the price.
The 1st support at 41708 is considered favorable for various reasons. Firstly, it is identified as an overlap support and aligns with the 38.20% Fibonacci Retracement, indicating a historical level where buying interest has previously emerged.
The 2nd support at 40670 is also recognized as an overlap support and coincides with the 61.80% Fibonacci Retracement, providing additional strength to the potential support zone.
On the resistance side, the 1st resistance at 43526 is highlighted as it aligns with the 50% Fibonacci Retracement, suggesting a potential barrier to the bullish momentum.
The 2nd resistance at 45482 is also recognized, coinciding with the 61.80% Fibonacci Retracement, adding additional significance to this resistance level.
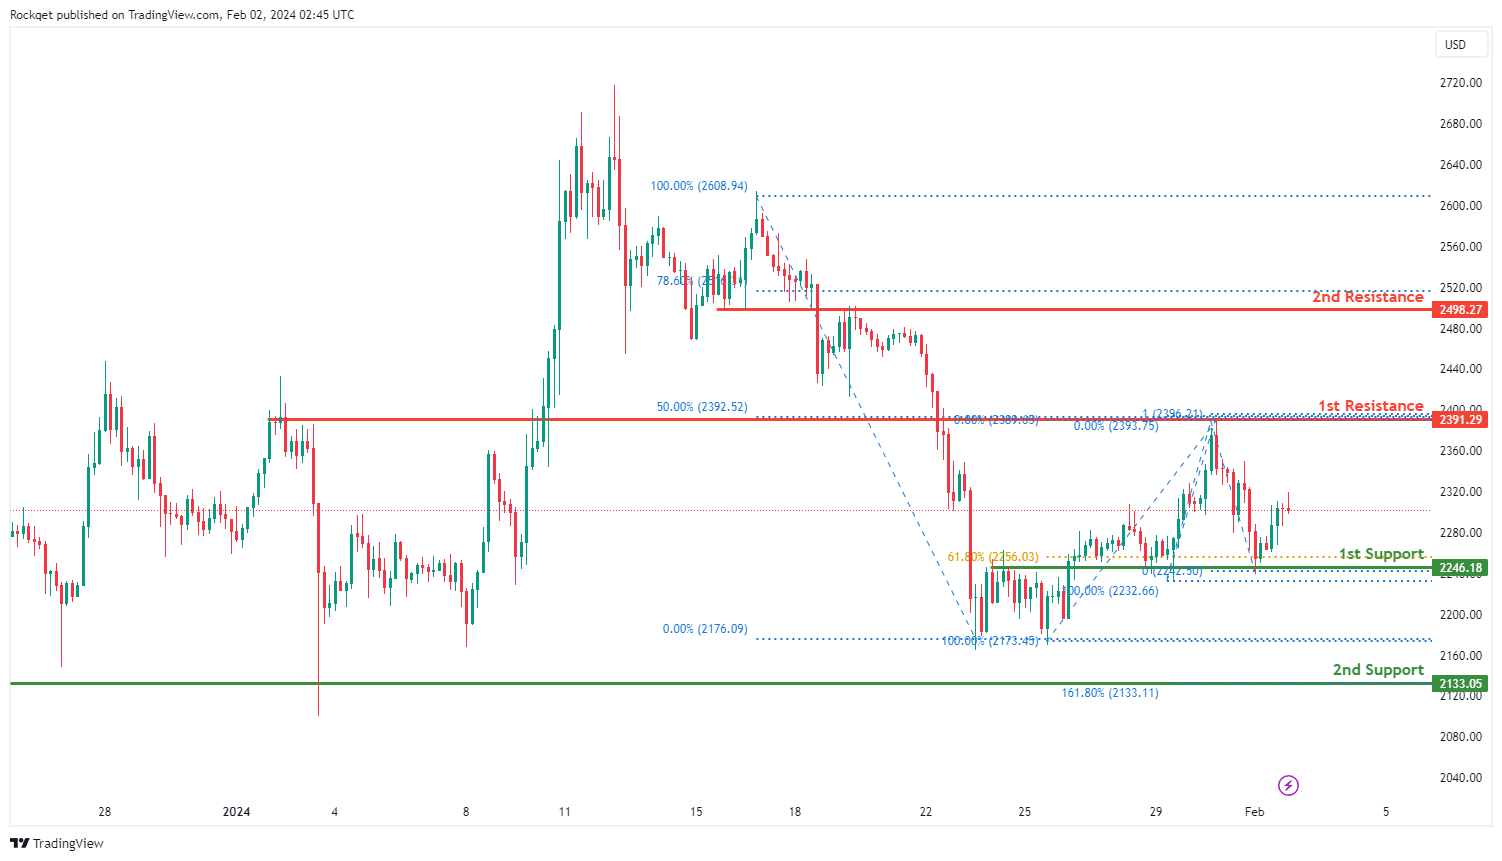
ETH/USD:
The ETH/USD chart currently demonstrates a bullish overall momentum, indicating a prevailing upward trend. Multiple factors contribute to this bullish sentiment, supporting the potential for sustained upward movement in the price.
The 1st support at 2246.18 is viewed favorably for several reasons. Firstly, it is recognized as an overlap support and coincides with the 61.80% Fibonacci Retracement, highlighting a historical level where buying interest has previously surfaced.
Additionally, the 2nd support at 2133.05 is identified as an overlap support and aligns with the 161.80% Fibonacci Extension, providing added strength to the potential support zone.
On the resistance side, the 1st resistance at 2391.29 is emphasized, aligning with the 50% Fibonacci Retracement and the 100% Fibonacci Projection. This suggests a potential obstacle to the bullish momentum.
The 2nd resistance at 2498.27 is also recognized, coinciding with the 78.60% Fibonacci Retracement, adding further significance to this resistance level.
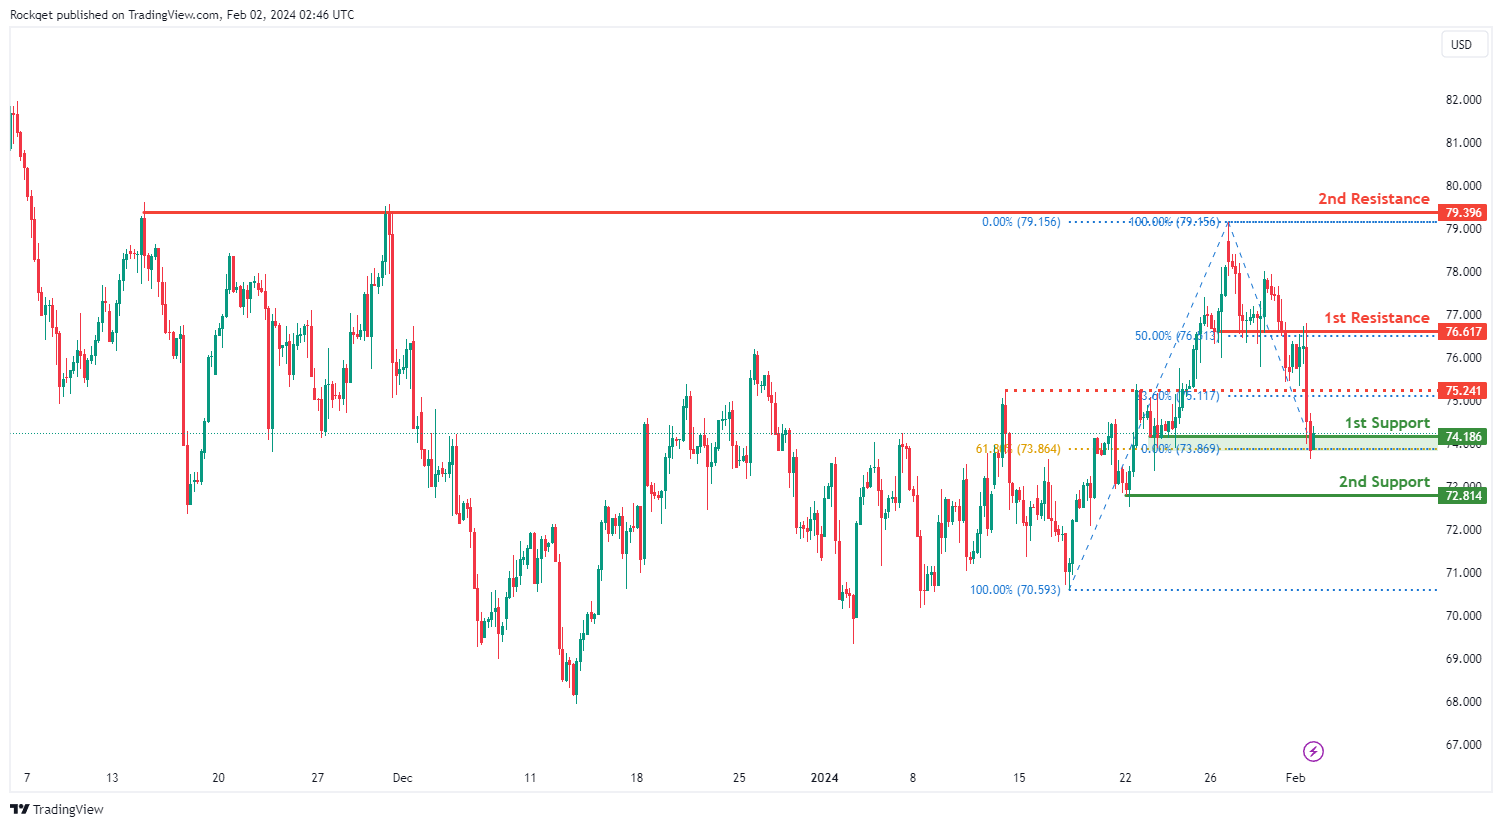
WTI/USD:
The WTI (West Texas Intermediate) chart currently exhibits a bearish momentum. However, there is a potential scenario for price to rise towards the intermediate resistance before resuming the downtrend.
The intermediate resistance at 75.24 is identified as a pullback resistance that aligns with the 23.60% Fibonacci retracement level while the 1st resistance level at 76.61 is identified as an overlap resistance that aligns with the 50.00% Fibonacci retracement level. Higher up, the 2nd resistance level at 79.39 is noted as a multi-swing-high resistance, further highlighting its importance as a potential resistance point.
On the support side, the 1st support level at 74.18 is identified as a pullback support that aligns close to the 61.80% Fibonacci Retracement level. Further below, the 2nd support level at 72.81 is also marked as a pullback support, reinforcing its significance as a key support level.
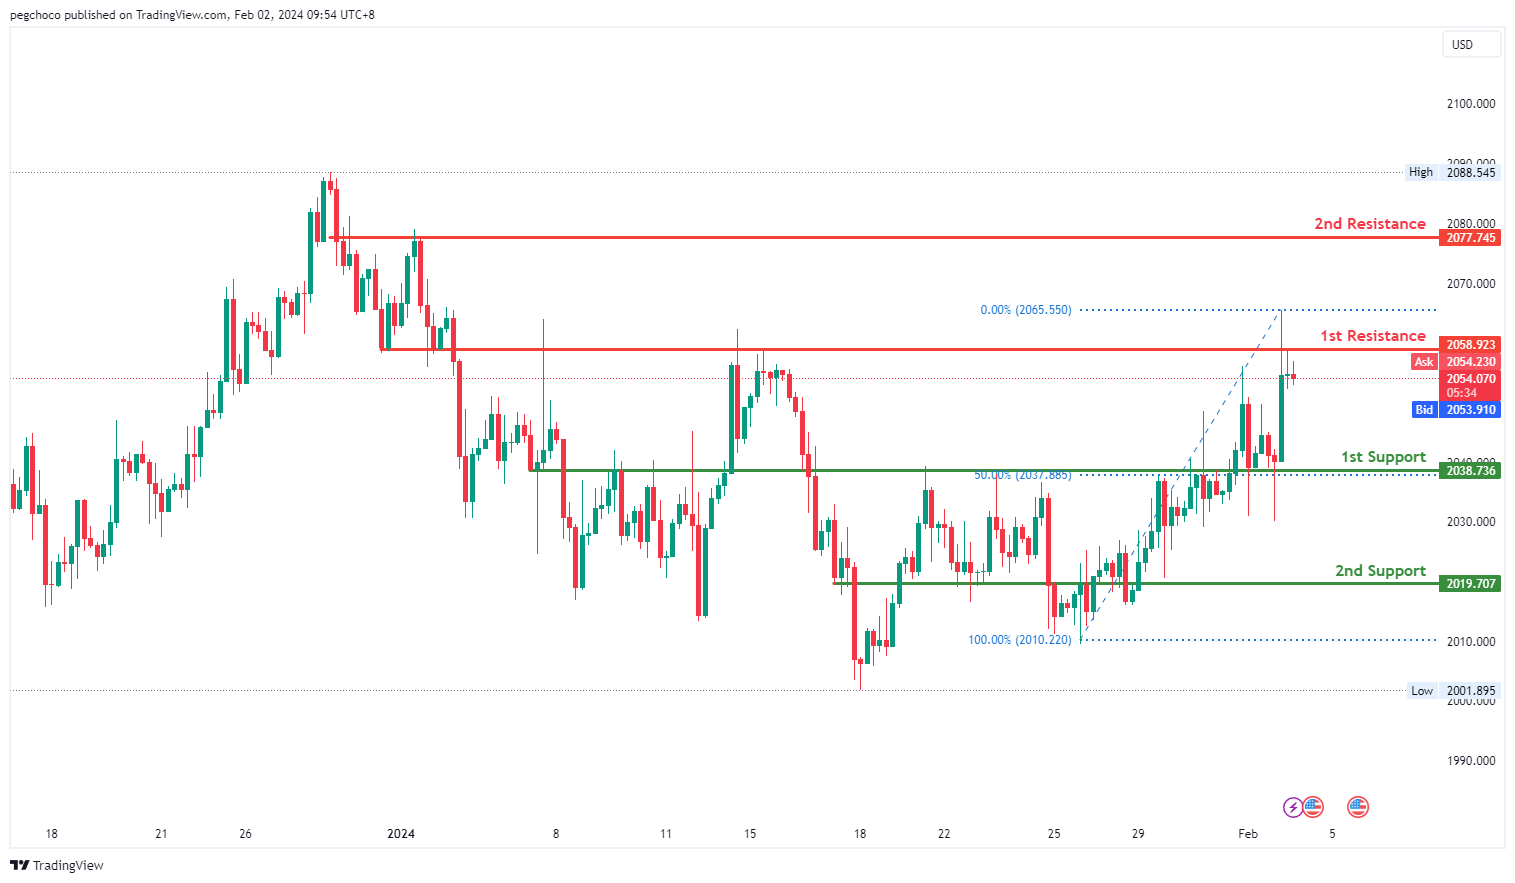
XAU/USD (GOLD):
The XAU/USD chart currently exhibits a bearish overall momentum, indicating a downward trend. According to the analysis, the price could potentially experience a bearish reaction off the 1st resistance level and drop to the 1st support.
The 1st support level at 2038.73 is identified as an overlap support and is reinforced by the presence of the 50% Fibonacci Retracement. This suggests that it has historical significance and could potentially act as a strong support level where buying interest may emerge.
There is also a 2nd support level at 2019.70, described as an overlap support, which further emphasizes its importance as a potential support zone.
On the resistance side, the 1st resistance level at 2058.92 is categorized as an overlap resistance, indicating that it represents a historical point where the price has encountered resistance in the past.
The 2nd resistance level at 2077.74 is also identified as an overlap resistance, suggesting that it is another historical level where the price has faced resistance.
The accuracy, completeness and timeliness of the information contained on this site cannot be guaranteed. IC Markets does not warranty, guarantee or make any representations, or assume any liability regarding financial results based on the use of the information in the site.
News, views, opinions, recommendations and other information obtained from sources outside of www.icmarkets.com, used in this site are believed to be reliable, but we cannot guarantee their accuracy or completeness. All such information is subject to change at any time without notice. IC Markets assumes no responsibility for the content of any linked site.
The fact that such links may exist does not indicate approval or endorsement of any material contained on any linked site. IC Markets is not liable for any harm caused by the transmission, through accessing the services or information on this site, of a computer virus, or other computer code or programming device that might be used to access, delete, damage, disable, disrupt or otherwise impede in any manner, the operation of the site or of any user’s software, hardware, data or property.


