
Key risk events today:
Canada Trade Balance; US Average Hourly Earnings, Non-Farm Employment Change and Unemployment Rate; US Revised UoM Consumer Sentiment.
EUR/USD:
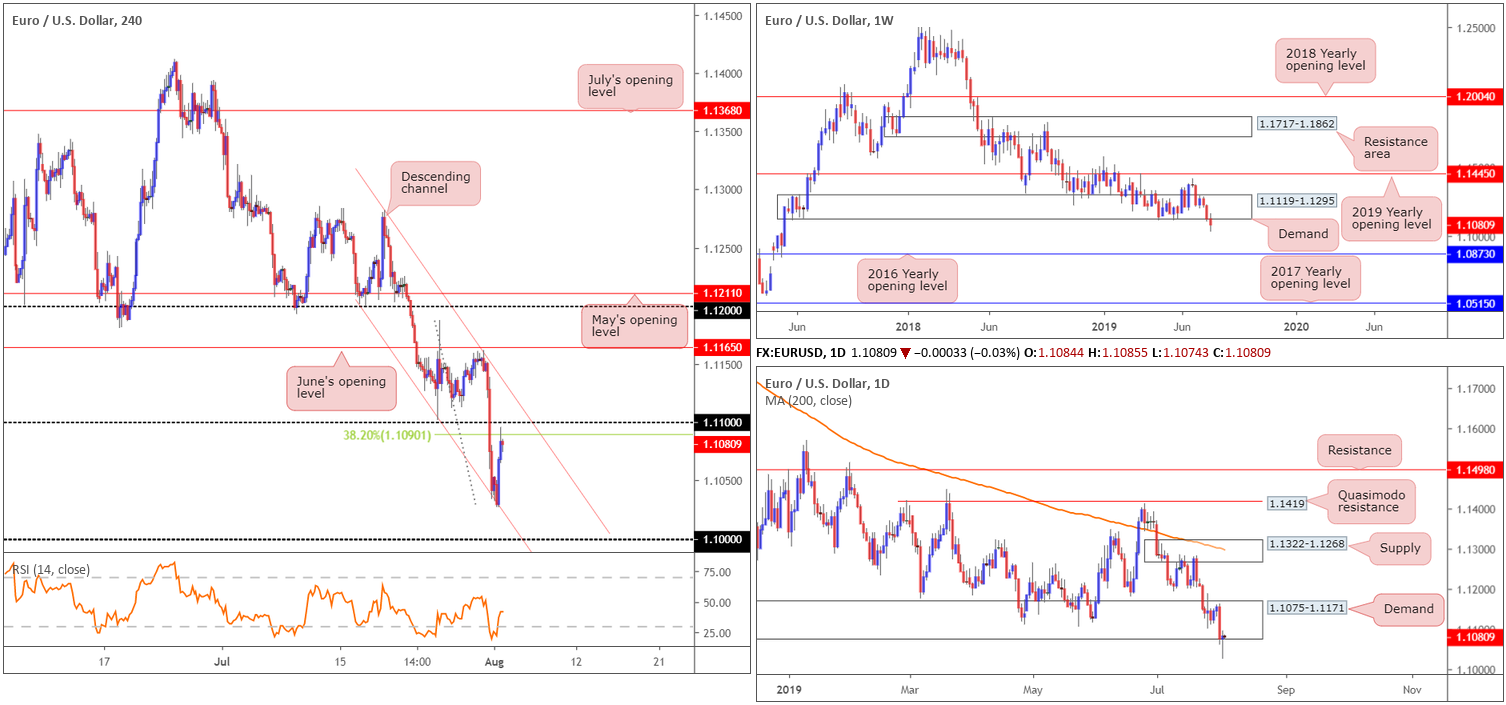
A combination of profit taking on the dollar ahead of 99.00, US President Trump announcing (via Twitter) intentions to raise tariffs on Chinese imports in September (triggering a market-wide risk off move) and less-than-stellar US ISM manufacturing PMI data provided some much-needed respite for Europe’s single currency Thursday.
Leaving key figure 1.10 unchallenged, though finding a floor off H4 channel support extended from the low 1.1101, the euro advanced to a 38.2% H4 Fibonacci retracement value at 1.1090 vs. the dollar, a few points shy of 1.11. Indicator-based traders may also wish to acknowledge the H4 RSI is seen rotating from oversold territory.
In terms of higher-timeframe flow, weekly action remains in a vulnerable position having recently crossed beneath the lower edge of long-standing demand at 1.1119-1.1295. In the event further selling is observed, the 2016 yearly opening level at 1.0873 (support) is next in the firing range. With respect to daily structure, however, a near-perfect hammer pattern formed yesterday that whipsawed through the lower edge of a demand area coming in at 1.1075-1.1171, a barrier seen hugging the underside of the current weekly demand zone. Further downside from here may entail making a run for demand at 1.0860-1.0954 (not seen on the screen), whereas a move higher has supply at 1.1322-1.1268 to target (merges with the 200-day SMA).
Areas of consideration:
With weekly demand at 1.1119-1.1295 under pressure, despite daily demand at 1.1075-1.1171 remaining in the fold (just), a sell from the 1.11 handle could be an option today, with protective stop-loss orders positioned above nearby H4 channel resistance (etched from the high 1.1282) and an initial take-profit target set at yesterday’s low 1.1026. Conservative traders concerned by recent action on the daily timeframe may opt to wait for additional candlestick confirmation to form before pulling the trigger (entry and risk levels can then be determined according to its structure).
GBP/USD:
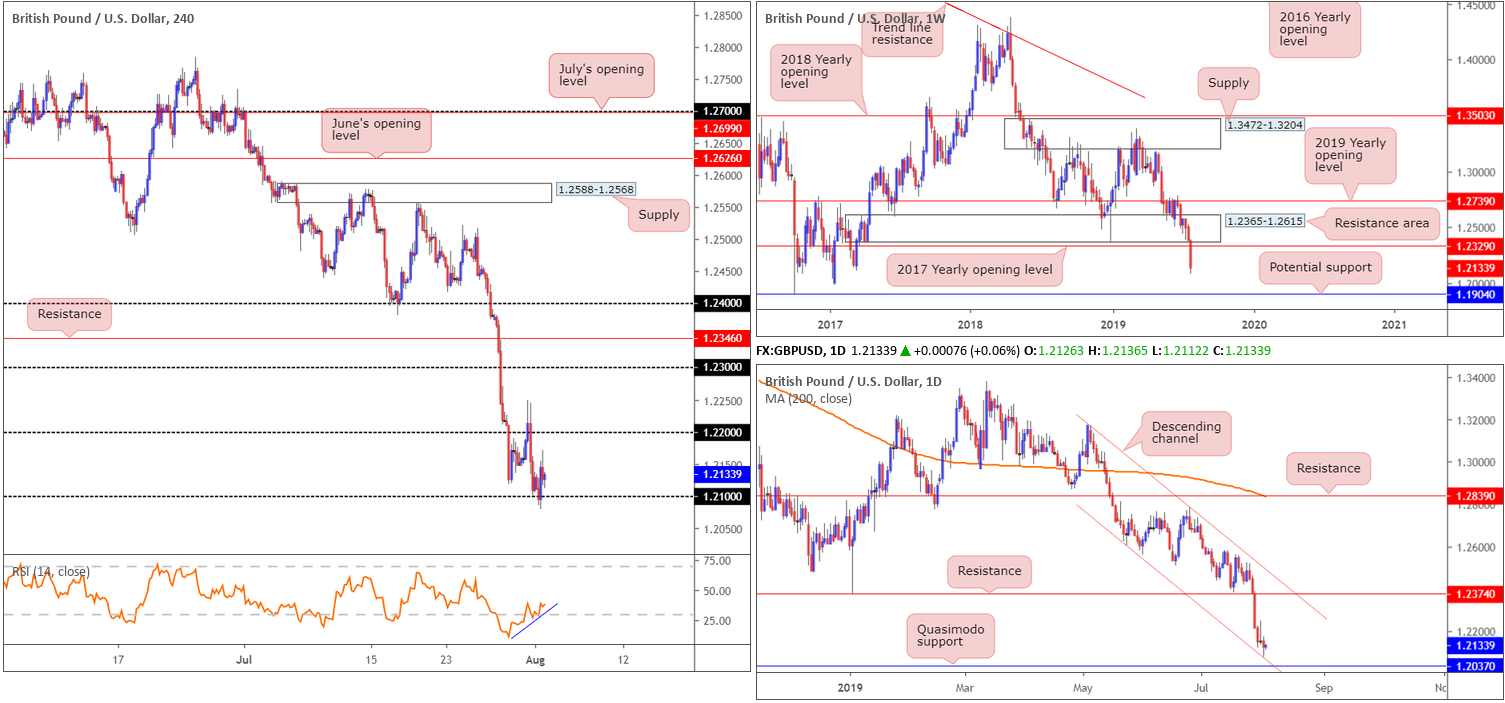
The pound sustained further downside Thursday, compounding weekly losses to more than 2.00% and drawing the GBP/USD towards 1.21 terrain. As expected, the MPC opted to stand pat on rates at 0.75% via a unanimous decision as ongoing uncertainty posed by Brexit continues to tie the hands of policymakers.
On the technical front, 1.21 is seen supportive as we head into Asia Pac hours this morning, bolstered not only by the H4 RSI chalking up positive divergence (blue line) but also a daily channel support (extended from the low 1.2605) recently entering the fold. Note we also have Quasimodo support lurking nearby at 1.2037, too. Although appealing as a potential floor, traders are urged to take into account weekly flow suggests further losses could be in store. The current weekly candle is establishing ground beneath its 2017 yearly opening level at 1.2329, with limited support visible on this timeframe until 1.1904, a standout low clocked in early October of 2016.
Areas of consideration:
Interestingly, Thursday’s candle action on the H4 timeframe chalked up a notable bullish engulfing pattern off 1.21. This – coupled with daily channel support and positive RSI divergence – could be enough to lift sterling towards at least 1.22. Entry can be taken at current price with a protective stop-loss order position beneath the H4 bullish engulfing tail (1.2079). Reducing risk to breakeven as soon as possible is certainly something to consider, given the weekly timeframe’s position at the moment.
AUD/USD:
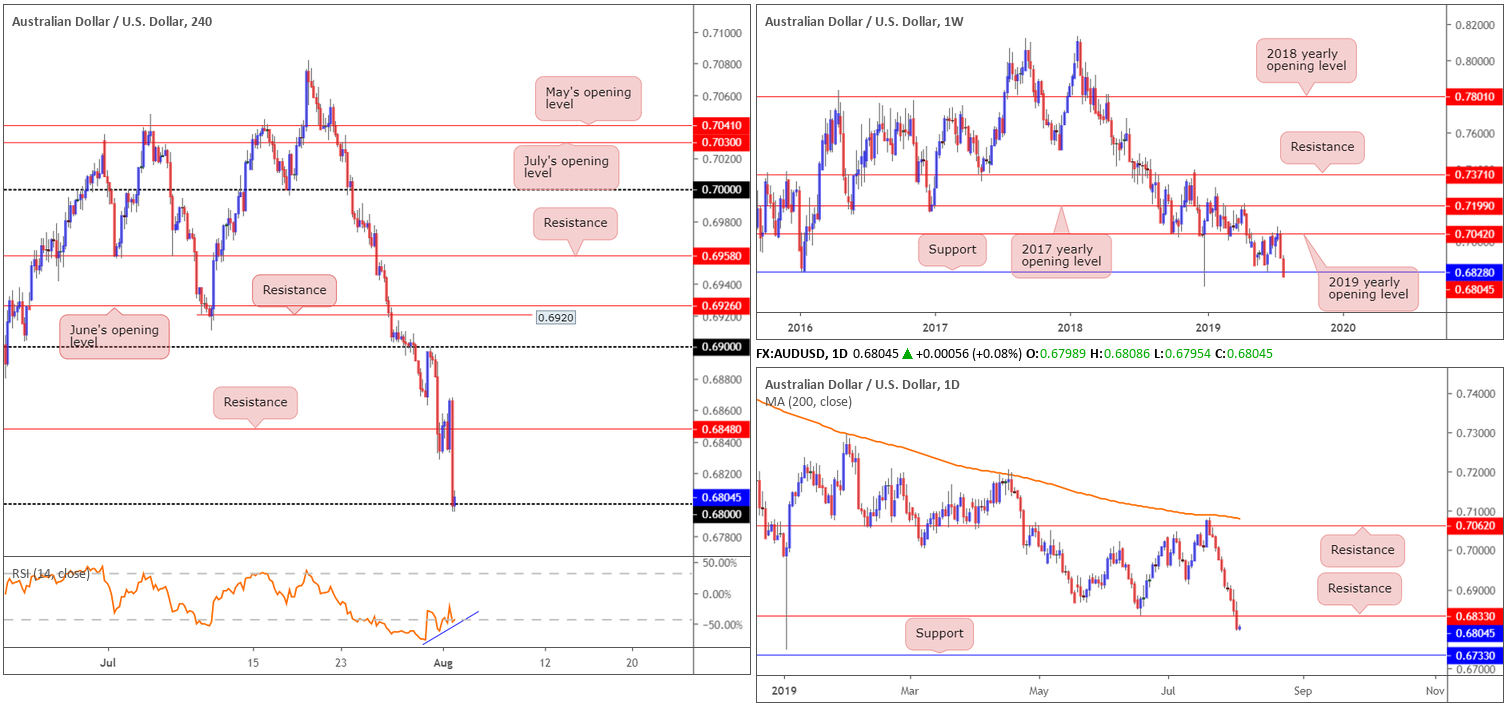
In recent sessions, the commodity-linked currency nosedived lower for a tenth consecutive day vs. the dollar amid trade tension. US President Trump tweeted that from September 1st, the US will impose an additional 10% of tariffs on the remaining USD 300bln worth of goods from China.
Technically speaking, recent selling has seen price action marginally dethrone weekly support at 0.6828. Beyond here, the market exhibits room to explore ground as far south as support coming in at 0.6359 (not visible on the screen). In conjunction with weekly movement, the 0.6833 June 18 low was taken out yesterday, perhaps serving as resistance in the future. The next downside target from this point can be seen at 0.6733.
A closer reading of price action on the H4 timeframe has the candles crossing swords with the 0.68 handle, confirmed by positive divergence out of the RSI (blue line). While we cannot rule out the possibility of an upside move from here, the threat of daily resistance entering the fray at 0.6833 will likely mar any attempts.
Areas of consideration:
Today’s spotlight is firmly focused on a potential break of 0.68. Dipping beneath here and following up with a strong retest play, preferably in the shape of a H4 bearish candlestick formation (provides entry/risk levels to work with) is, according to the overall technical picture this morning, a high-probability shorting opportunity, targeting daily support mentioned above at 0.6733.
USD/JPY:
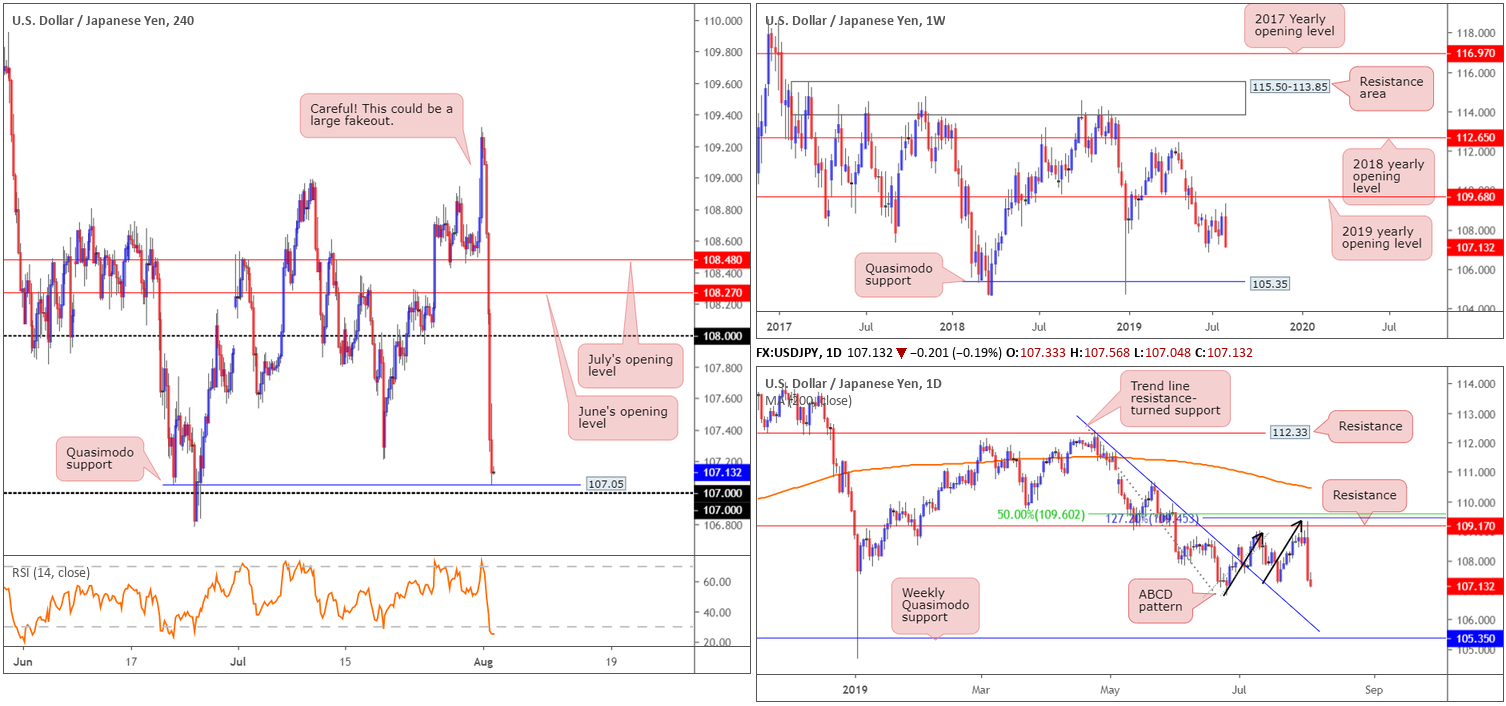
The Japanese yen picked up a safe-haven bid Thursday as President Trump ratcheted up the US/China trade war with more tariffs, triggering a flight to safety, the biggest single-day USD/JPY decline since May 17, 2017.
From a technical perspective, you may recall Thursday’s briefing warned of a potential drop:
On the back of recent Fed movement, the US dollar benefitted, lifting the USD/JPY pair beyond 109 in strong fashion. Although considered a bullish indicator and likely has traders buying the breakout, trouble may be on the horizon.
Weekly price has the 2019 yearly opening level at 109.68 offering viable resistance this week. Daily price, on the other hand, houses resistance at 109.17, which comes together with a nearby 127.2% ABCD (black arrows) bearish formation at 109.45 and a 50.0% retracement value at 109.60. This, alongside the 2019 yearly opening level at 109.68 on the weekly timeframe, forms a reasonably tight area of resistance to focus on (109.17/109.68).
Having noted price engaging with strong higher-timeframe resistance, it was a chancy move to attempt longs above 109. Well done to any of our readers who avoided this lemming-like stampede.
As for the next downside targets on the higher timeframes, the daily trend line resistance-turned support (extended from the high 112.40) is in sight, closely followed by weekly Quasimodo support plotted at 105.35.
Areas of consideration:
Having witnessed the H4 candles recently engage with Quasimodo support at 107.05, closely trailed by the 107 handle, the pair may receive some much-needed respite. However, it’s unlikely to offer much to get excited about, with a break of 107 likely on the cards.
A H4 close beneath 107 that’s followed up with a retest as resistance, preferably in the shape of a bearish candlestick configuration, is considered a high-probability shorting opportunity, targeting the 106 handle (not visible on the screen) as an initial port of call.
USD/CAD:
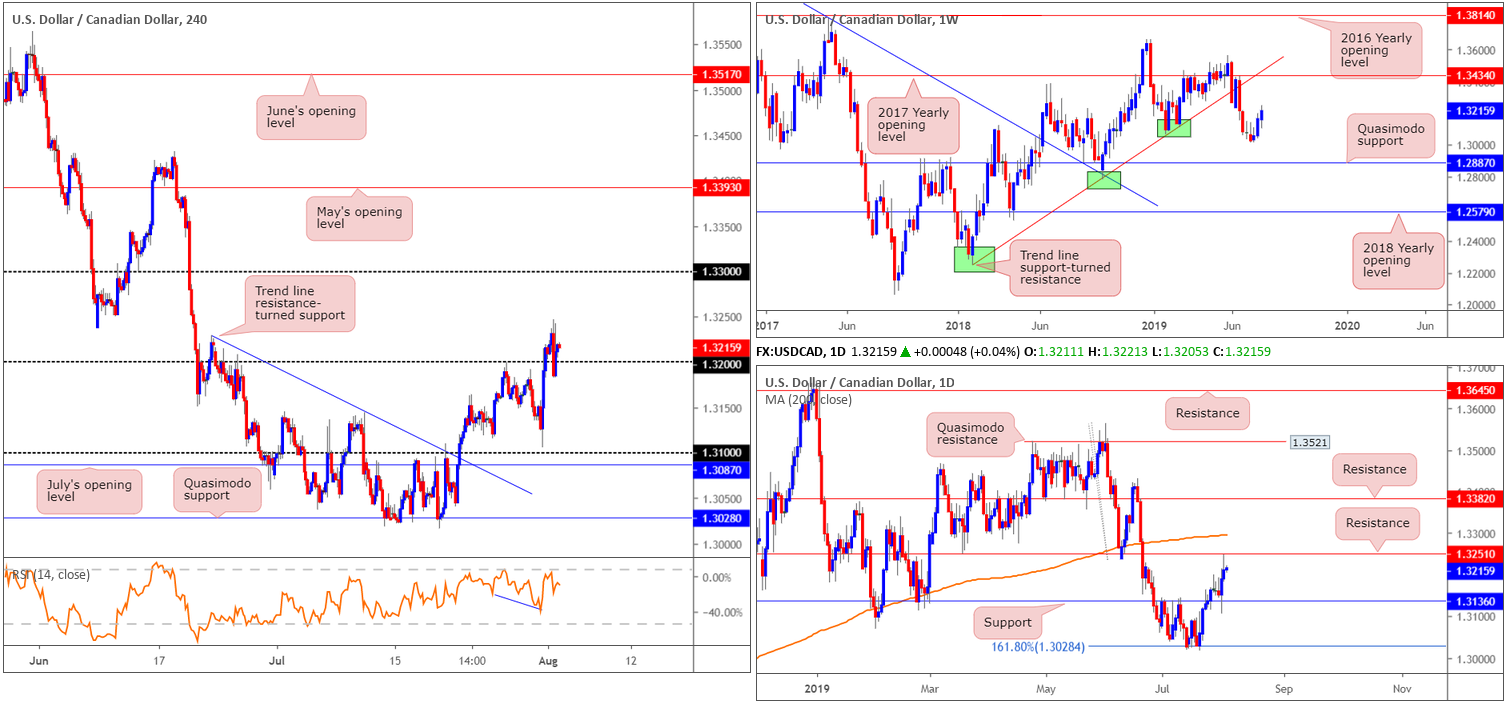
Thursday observed the USD/CAD extend recent gains to highs of 1.3247, its highest level in more than five weeks. This is despite a hefty decline in oil markets, which usually weighs on the Canadian dollar, and the US dollar index trimming gains ahead of 99.00.
The H4 candles, as you can see, pulled back from the session high and retested 1.32. Despite dipping mildly below the number, price action concluded the day 1.32+, with the next upside target residing at 1.33. Before reaching 1.33, however, traders must contend with daily resistance plotted at 1.3251, a level that’s served well as support in the past. Also worthy of note is the 200-day SMA (orange – currently trading around 1.3293).
Areas of consideration:
Given the successful retest of 1.32, follow-through buying may develop today, targeting at least 1.3251: the daily resistance level. Entry can be found at current price, with protective stop-loss orders positioned beneath yesterday’s low at 1.3183. Reducing risk to breakeven at 1.3251 is recommended, leaving the trader in a healthy risk-free position to possibly approach 1.33 as the initial take-profit zone.
USD/CHF:
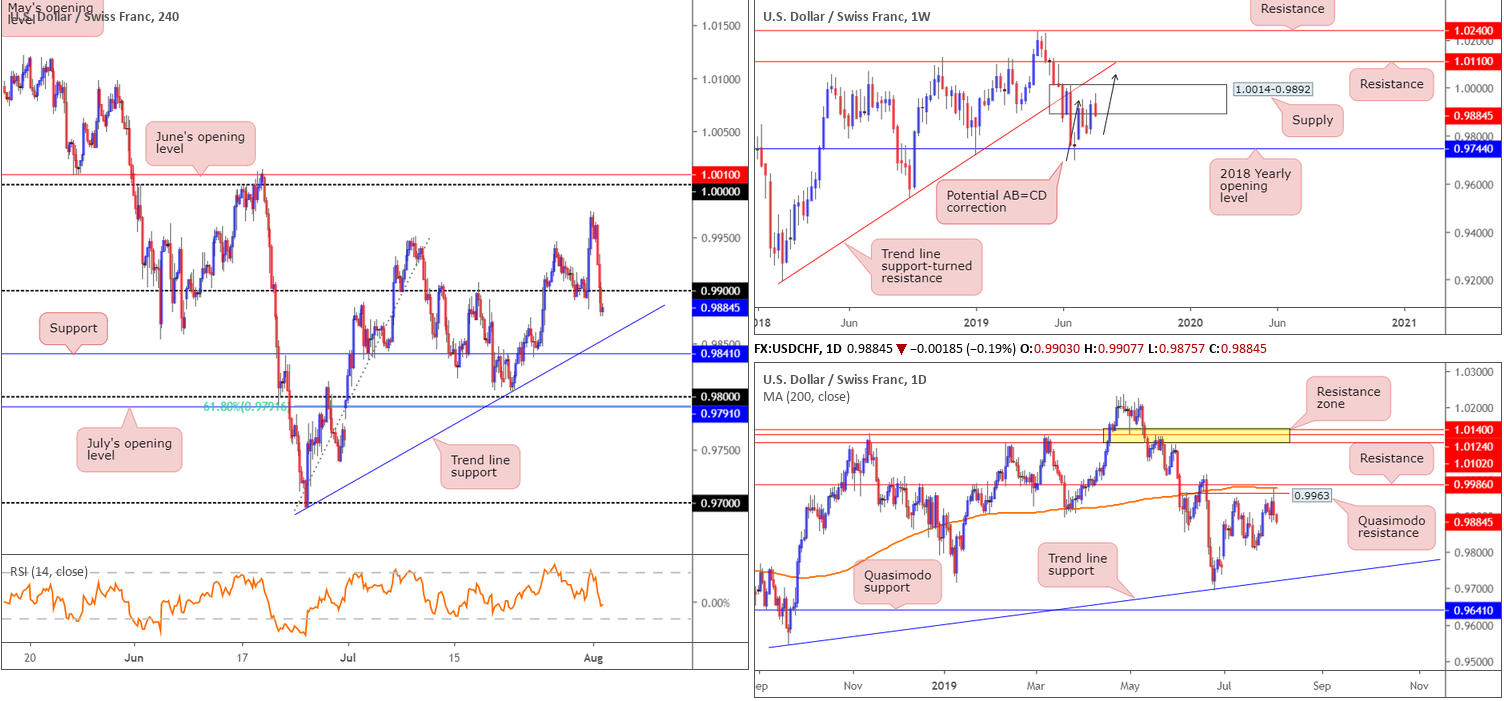
As aired in the EUR/USD analysis, a combination of profit taking on the dollar index ahead of 99.00, US President Trump announcing (via Twitter) intentions to raise tariffs on Chinese imports in September (triggering a market-wide risk off move) and less-than-stellar US ISM manufacturing PMI data, weighed on USD pairs Thursday. This ultimately sent the USD/CHF towards 0.99, though did in fact break through the psychological boundary in early hours this morning.
Aided by a robust collection of daily resistances: a Quasimodo resistance at 0.9963, the 200-day SMA (currently trading around 0.9978) and resistance coming in at 0.9986, and given weekly price is toying with supply at 1.0014-0.9892, the H4 candles appear poised to approach trend line support etched from the low 0.9693.
Areas of consideration:
Considering recent movement out of the higher-timeframe zones mentioned above, and recently overthrowing 0.99 to the downside on the H4 scale, entering long in this market is incredibly chancy.
Traders may, therefore, look to attempt a short at the underside of 0.99 today, which certainly appears logical. The only grumble here is the fact we have H4 trend line support close by, which could hamper selling before reaching a more reasonable downside target, such as H4 support at 0.9841. For that reason, active trade management is required.
In addition to this above, as round numbers are prone to fakeouts, traders may consider waiting and seeing if a bearish candlestick configuration forms before pressing the sell button. Not only does this help identify seller intent, it also helps provide entry/risk levels to work with.
Dow Jones Industrial Average:
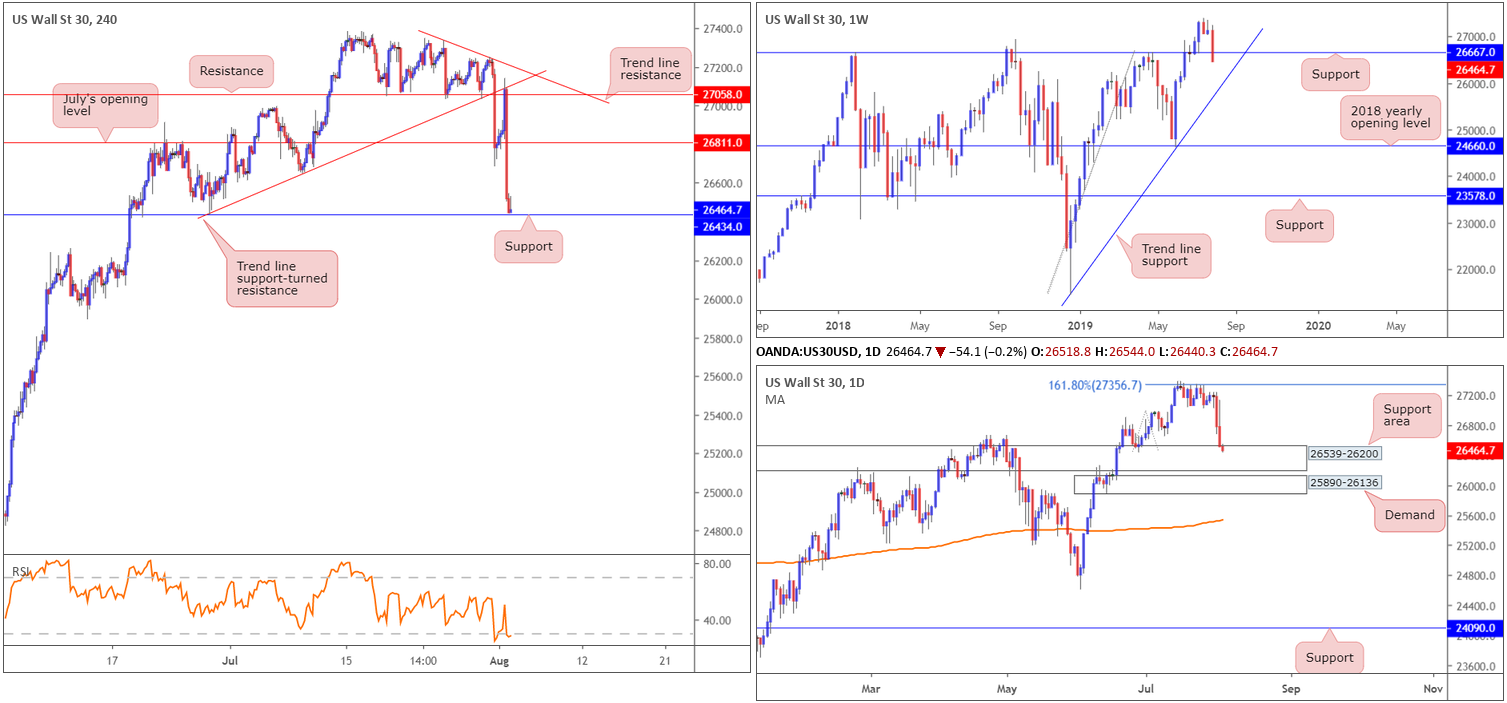
US equities and oil sunk Thursday after Trump announced the US will hit $300 billion worth of Chinese goods with a 10% tariff. The Dow Jones Industrial Average erased 280.85 points, or 1.05%; the S&P 500 lost 26.82 points, or 0.90% and the Nasdaq declined 47.63 points, or 0.61%.
Technically, there was a beautiful sell on the H4 timeframe. Trend line support-turned resistance etched from the low 26436 combined with resistance pencilled in from 27058 held price action lower yesterday, consequently driving through July’s opening level at 26811 and, in recent hours, bottoming just north of support at 26434. It might also be worth pencilling in the H4 RSI indicator is seen treading water within oversold territory.
Higher-timeframe flow reveals weekly price attempting to dethrone support at 26667, which could, if successful, lead to an approach towards long-standing trend line support etched from the low 21452. Contrary to this, however, daily price recently crossed paths with a support area drawn from 26539-26200, closely shadowed by notable demand at 25890-26136.
Areas of consideration:
H4 support highlighted above at 26434 is in focus this morning for a potential long opportunity. Knowing the level forms within the walls of a daily support area at 26539-26200 certainly adds weight. Having seen weekly price edge beneath support at 26667, though, it may still be an idea to wait and see if H4 price chalks up a bullish candlestick formation before pulling trigger – entry and risk levels can then be determined according to this structure – targeting 26811 as the initial take-profit zone.
XAU/USD (GOLD):
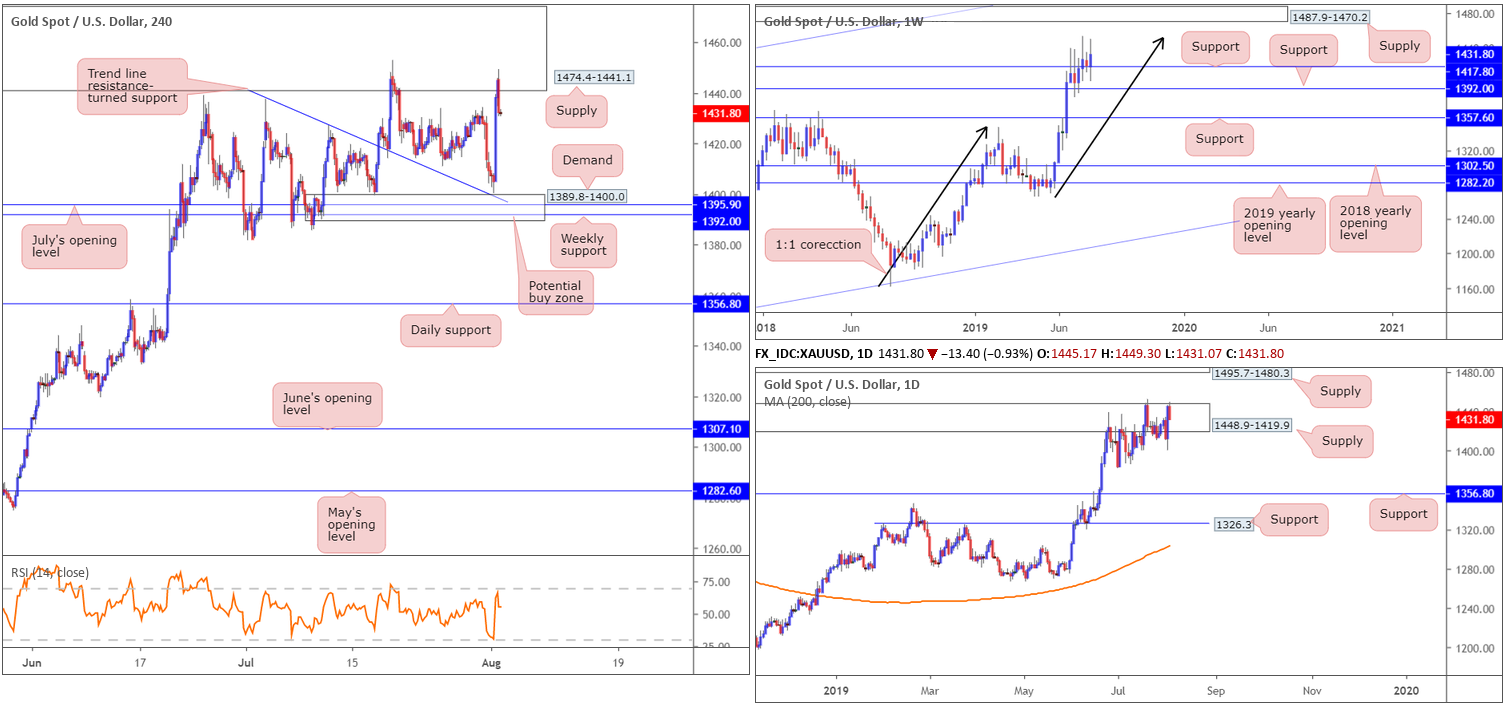
Demand for safe-haven assets increased Thursday following US President Trump announcing (via Twitter) intentions to raise tariffs on Chinese imports in September, triggering a market-wide risk off move.
As is evident from the H4 timeframe this morning, price action bottomed a few points north of a demand zone coming in at 1389.8-1400.0. This was a noted target zone for possible buying opportunities due to the following:
In terms of neighbouring support, we have trend line resistance-turned support (extended from the high 1437.7) merging with a striking area of demand coming in at 1389.8-1400.0. Within this zone, July’s opening level at 1395.5 resides as support, as well as weekly support underlined above at 1392.0.
Well done to any of our readers who still managed to jump aboard the recent move, as bullion concluded the session re-entering the jaws of a rather large supply zone at 1474.4-1441.1.
In terms of where we stand on the higher timeframes, however, the research team notes weekly support at 1417.8 to be holding firm, though is still potentially hampered by resistance at a 1:1 correction (black arrows) around 1453.2 shaped from the 1160.3 August 13 low. Further adding to this, daily supply remains in play at 1448.9-1419.9 despite the top edge being engulfed on two separate occasions.
Areas of consideration:
With notable support and resistance in play right now, this is a difficult market to trade. While weekly players could attempt to further advance from current price, the threat of selling from the 1:1 correction and the current daily/H4 supply areas is certainly present. Therefore, in absence of clearer price action, opting to stand on the sidelines may be the path to take today.
The accuracy, completeness and timeliness of the information contained on this site cannot be guaranteed. IC Markets does not warranty, guarantee or make any representations, or assume any liability regarding financial results based on the use of the information in the site.
News, views, opinions, recommendations and other information obtained from sources outside of www.icmarkets.com.au, used in this site are believed to be reliable, but we cannot guarantee their accuracy or completeness. All such information is subject to change at any time without notice. IC Markets assumes no responsibility for the content of any linked site.
The fact that such links may exist does not indicate approval or endorsement of any material contained on any linked site. IC Markets is not liable for any harm caused by the transmission, through accessing the services or information on this site, of a computer virus, or other computer code or programming device that might be used to access, delete, damage, disable, disrupt or otherwise impede in any manner, the operation of the site or of any user’s software, hardware, data or property.


