
Key risk events today:
Canada GDP m/m; Canada RMPI m/m; US Core PCE Price Index m/m; US Personal Spending m/m; Chicago PMI; US Revised UoM Consumer Sentiment; Fed Chair Powell Speaks.
Previous analysis as well as outside sources is denoted by way of italics.
EUR/USD:
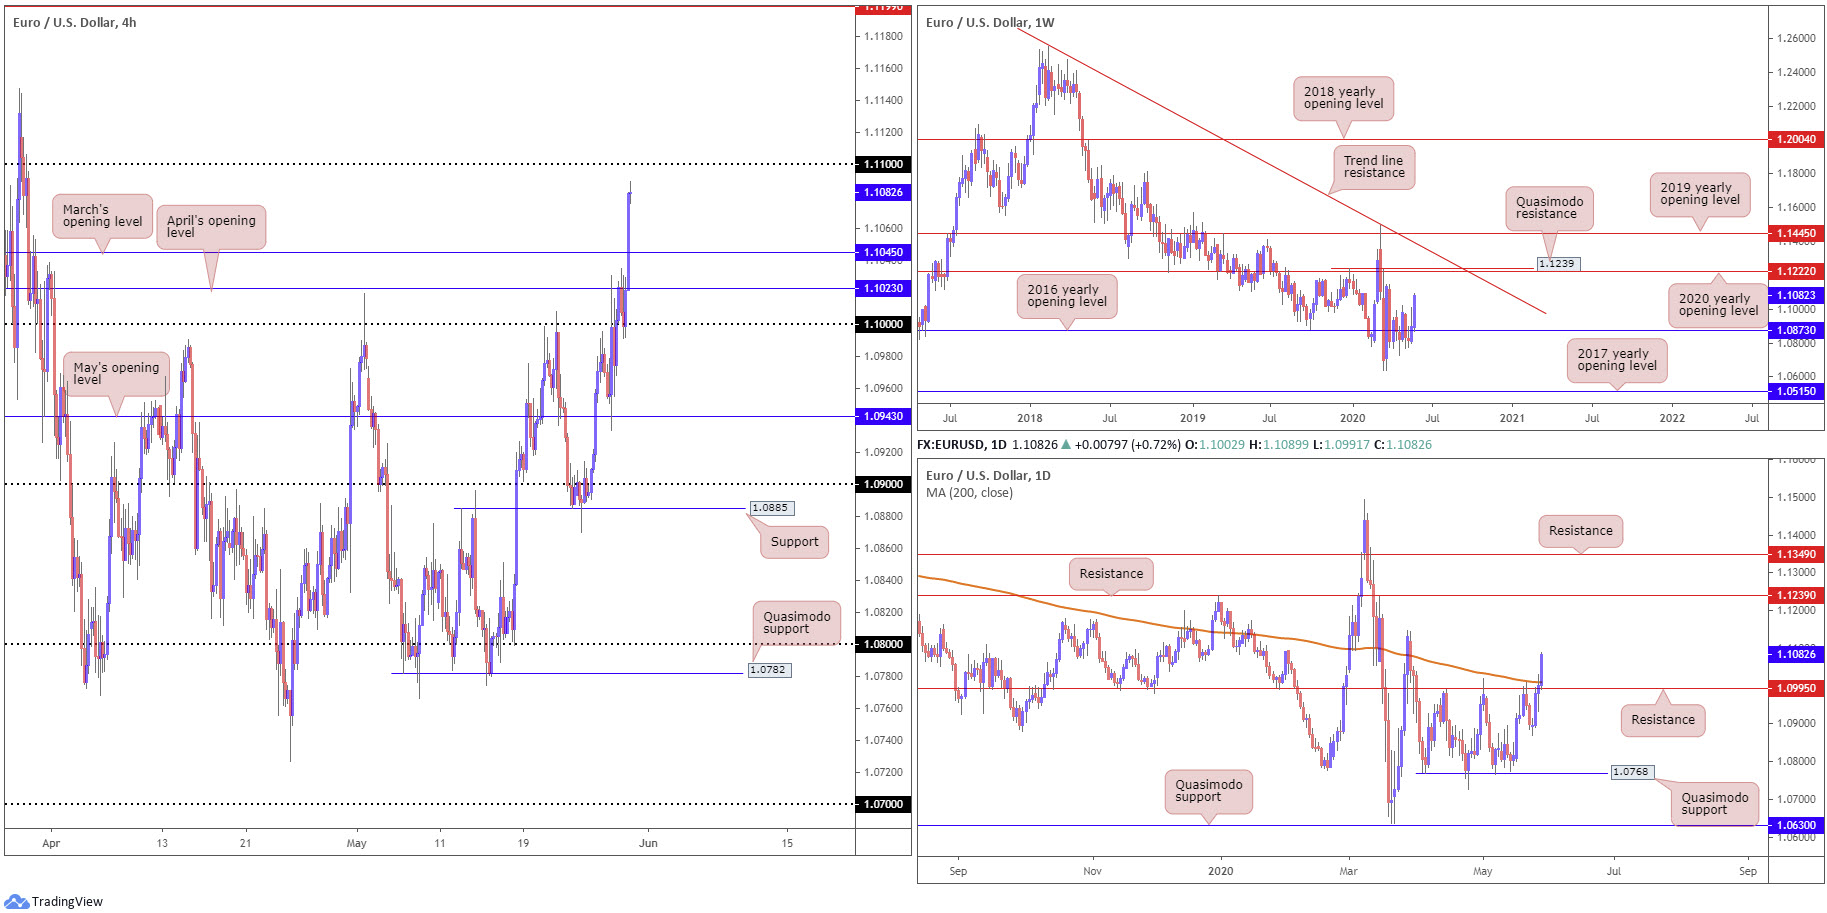
Europe’s shared currency retained a healthy underlying bid against the US dollar Thursday, adding 0.7% by London’s close. The US dollar index maintained a position south of 99.00, crossing through 98.50. In spite of this, the DXY was initially unmoved by the revision lower to Q1 GDP and larger-than-forecast unemployment claims.
Chart studies reveal the H4 candles rebounded from the key figure 1.10 in strong fashion, following a dip off the underside of April’s opening level at 1.1023. The pair’s resilience to the downside was reconfirmed yesterday, following a healthy move through the aforementioned monthly opening level, followed by March’s opening level at 1.1045. This suggests we may be knocking on 1.11’s door in the near future. The area above, aside from the 1.1147 March 27 high and 1.1189 March 17 high, Quasimodo resistance rests as the next upside target from 1.1199.
Weekly price continues to echo an enthusiastic tone north of the 2016 yearly opening level at 1.0873. Major resistance is not expected to show itself until the 2020 yearly opening level at 1.1222, closely followed by Quasimodo resistance at 1.1239. With respect to the long-term trend, the pair has remained under weight since topping in early 2018.
Price action on the daily timeframe made its way through resistance at 1.0995, along with the 200-day SMA (orange – 1.1010) yesterday. Clearance of these areas shines the spotlight on a possible approach to resistance at 1.1239 (essentially the same base as weekly QM).
Areas of consideration:
Having noted limited confluence sponsoring 1.11 as a resistance base, buyers may attempt to engulf the level today. This will appeal to breakout buyers. Aggressive players will look to the breakout candle’s close as a means of entry; conservative traders, though, may seek a retest at 1.11 before taking action, targeting the 1.1147 March 27 high, the 1.1189 March 17 high and H4 Quasimodo resistance from 1.1199.
GBP/USD:
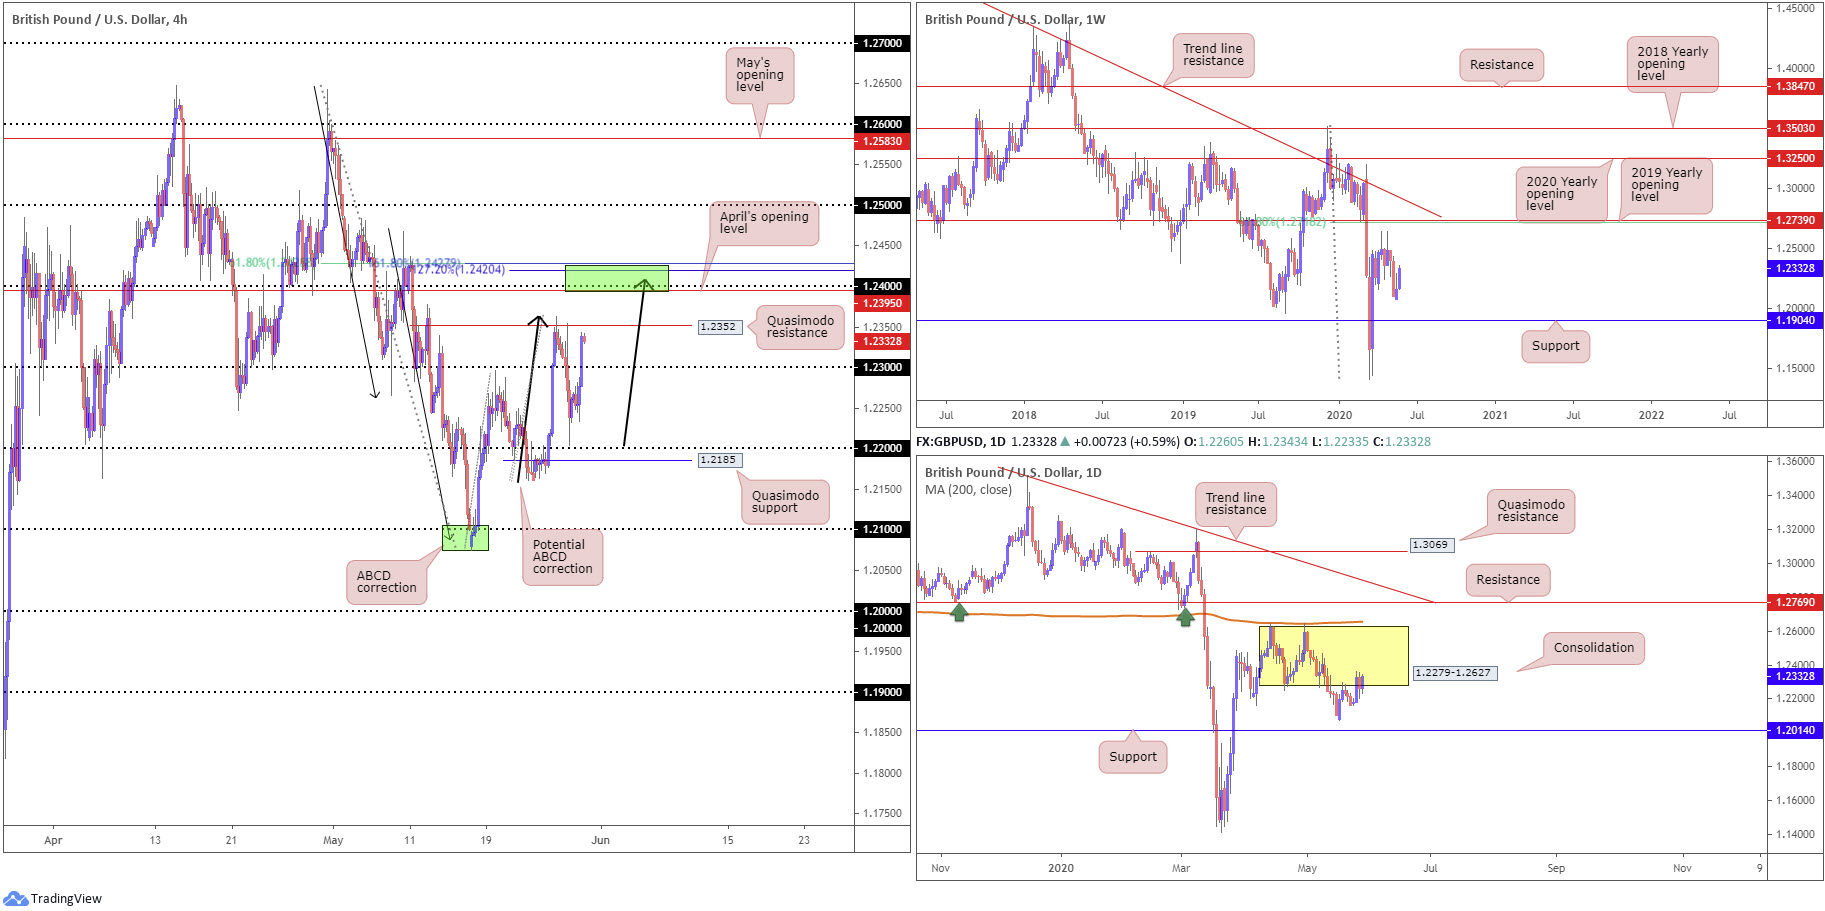
Demand for the British pound increased against the greenback Thursday, paring Wednesday’s losses.
Shrugging off yesterday’s weakness, we’re now testing waters above 1.23, in close proximity of Quasimodo resistance at 1.2352 on the H4 timeframe. North of here, April’s opening level at 1.2395 draws attention due to its surrounding confluence, including the 1.24 handle, the ABCD correction (black arrows) at 1.2408, a 127.2% Fibonacci extension point at 1.2420, a 161.8% Fibonacci extension point at 1.2427 and a 61.8% Fibonacci retracement ratio at 1.2428 (green).
Support on the weekly timeframe positions itself at 1.1904. Resistance, on the other hand, falls in at 1.2739, the 2019 yearly opening level, and a 61.8% Fibonacci retracement ratio at 1.2718, sited close by a trend line resistance, extended from the high 1.5930.
The daily window has buyers and sellers battling for position off range lows at around 1.2279. Bidding from this point may lead to an attack at range tops around 1.2627, along with the 200-day SMA at 1.2656. Moves lower, assuming a breach of the 1.2075 May 18 low, could find support at 1.2014.
Areas of consideration:
Although traders may witness H4 Quasimodo resistance at 1.2352 cap upside, the area between 1.2428/1.2395 on the H4 timeframe, technically speaking, emphasises a stronger base due to the number of technical resistances making up the zone (see above).
AUD/USD:
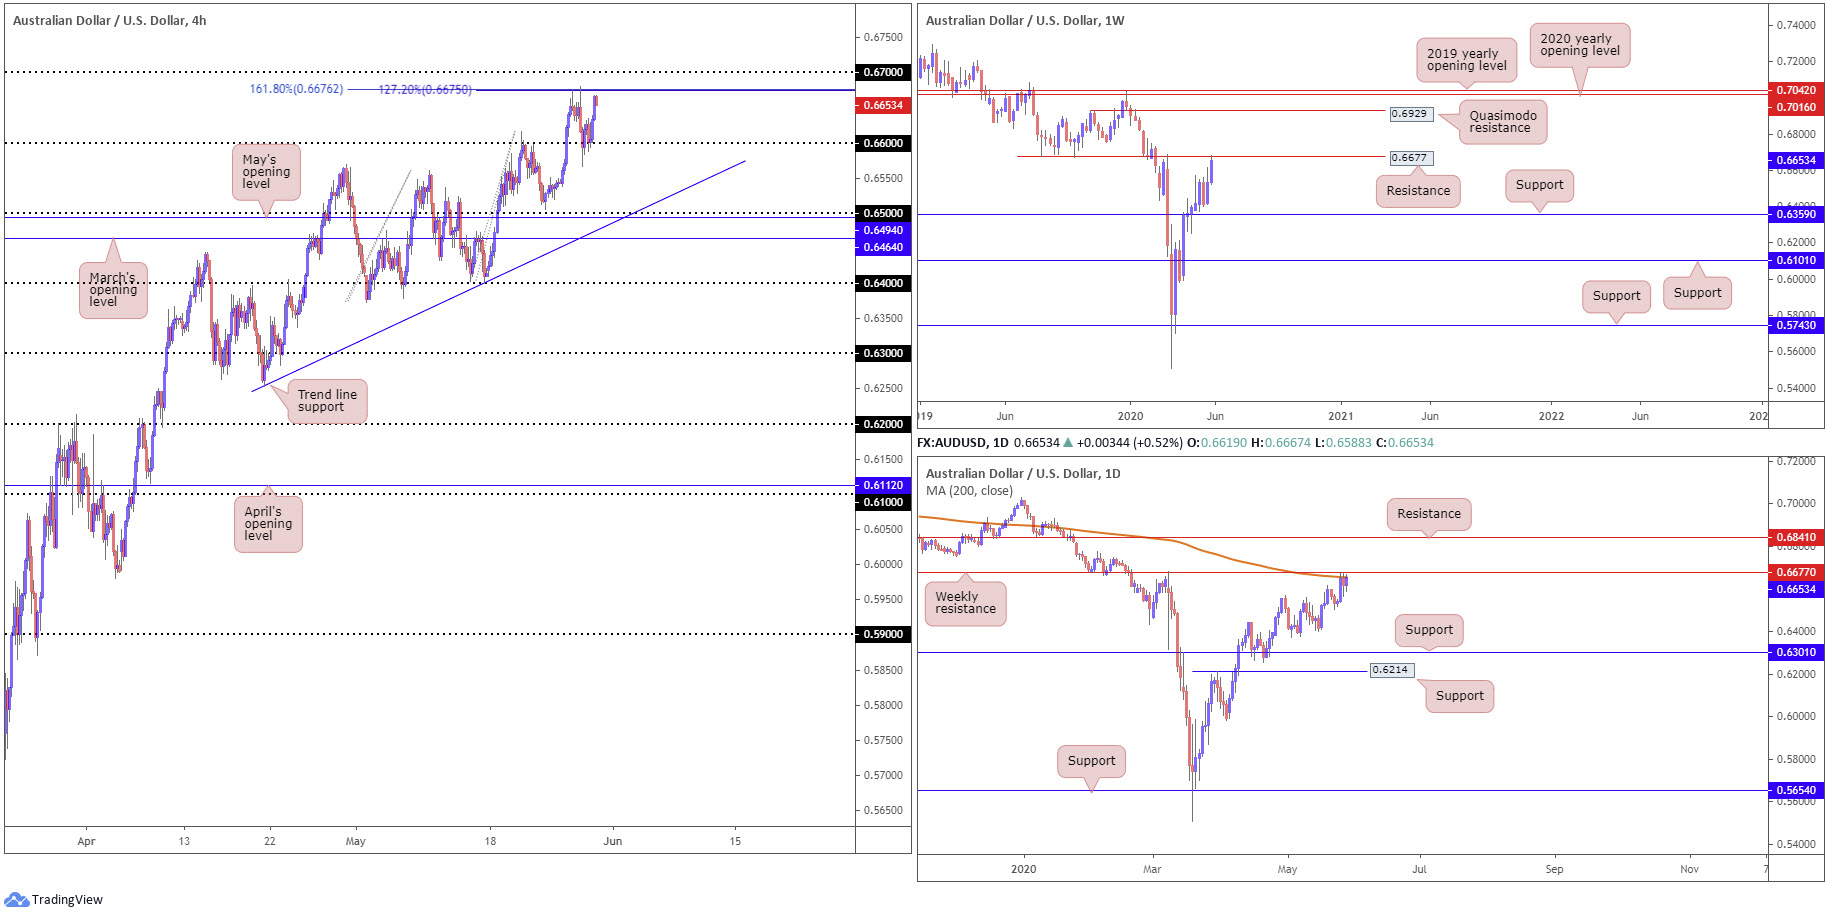
Kicking things off from the weekly timeframe this morning, we can see resistance at 0.6677 in motion. A rotation from this angle has support at 0.6359 to target, while breaching current resistance could see the pair face a run to Quasimodo resistance at 0.6929.
In conjunction with weekly flow, daily price recently crossed swords with its 200-day SMA (orange – 0.6655), a value closely shadowed by the weekly resistance highlighted above at 0.6677.
In terms of the H4 timeframe, intraday action recently found resistance off a 161.8% Fibonacci extension point at 0.6676 and a 127.2% Fibonacci extension point at 0.6675. Selling from this base landed 0.66 in the net yesterday, which, as evident from the chart, maintained a solid defence. Continued bidding today could throw 0.67 into the pan.
Areas of consideration:
Technically, with weekly resistance at 0.6677 in play, along with the 200-day SMA on the daily timeframe and a Fibonacci area of resistance on the H4 between 0.6676/75, sellers will likely remain interested in this region. However, the H4 timeframe exhibits scope for a push to 0.67 before fresh sellers step in.
Downside from 0.67ish offers strong risk/reward should we tunnel through 0.66, exposing 0.65 as the next support target.
USD/JPY:
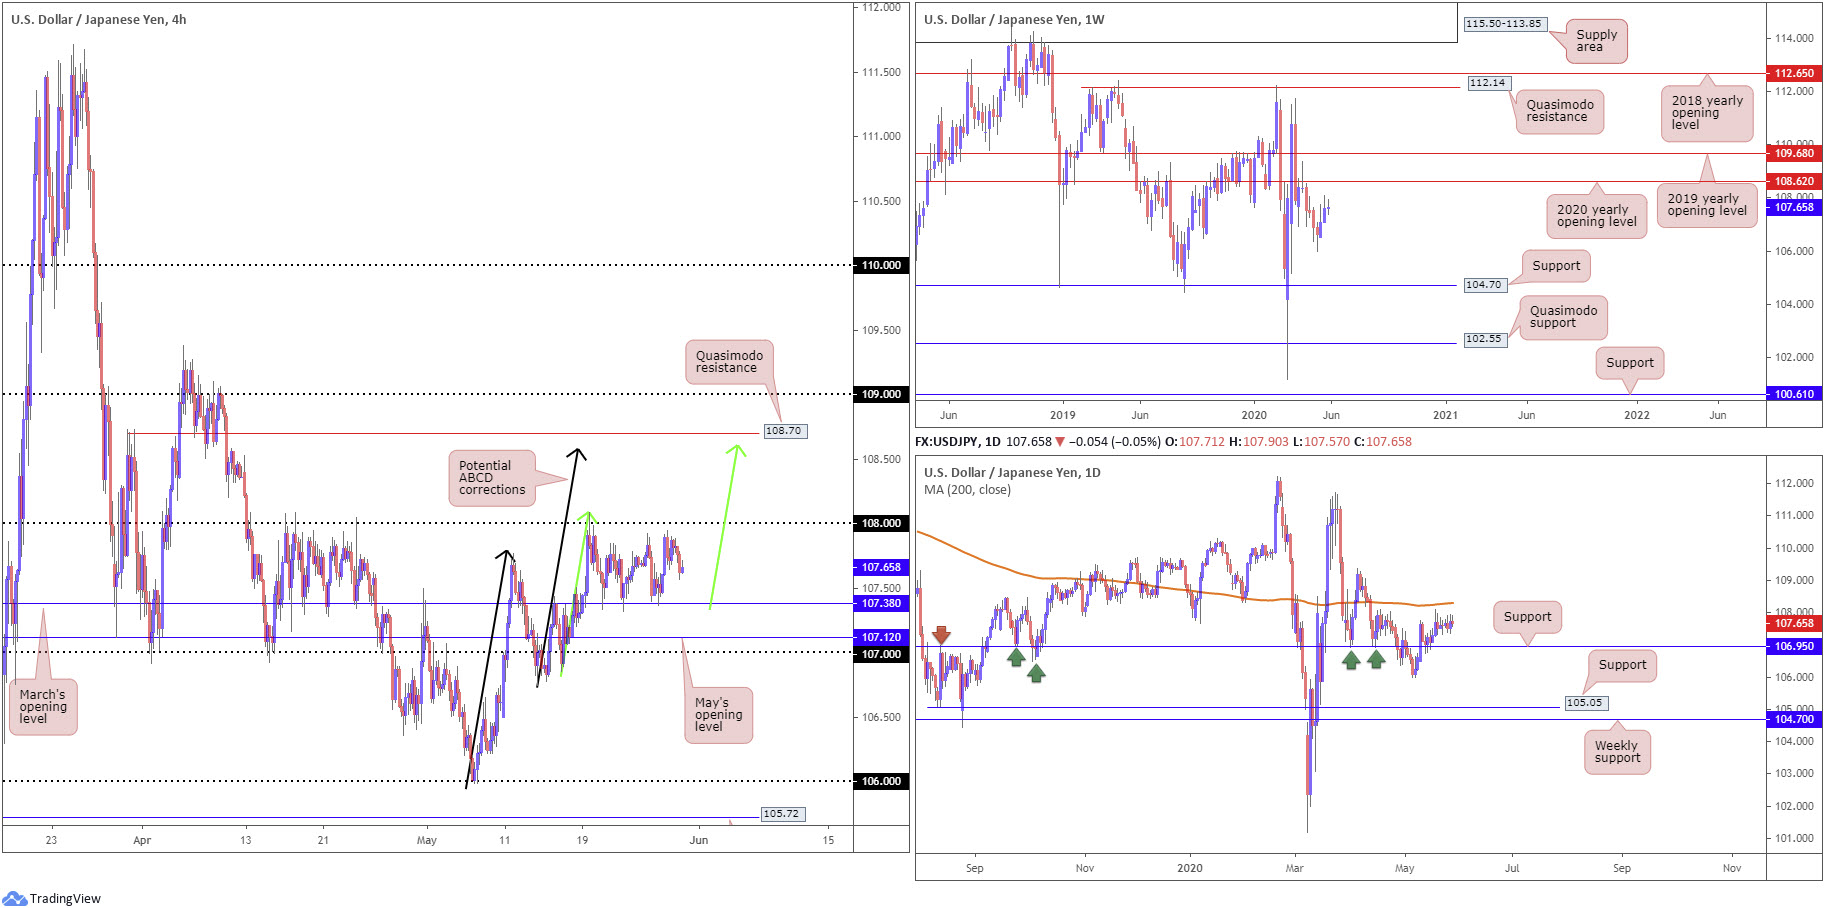
Outlook essentially unchanged due to ranging movement.
Since last Wednesday, the H4 candles established keen support off March’s opening level at 107.38, with 108 circling close by.
Above 1.08 we have two ABCD bearish patterns (black/green arrows) merging around 108.60ish, sited just south of Quasimodo resistance at 108.70. Space beneath 107.38, however, has May’s opening level at 107.12 to target.
Technical action on the weekly timeframe, following two consecutive weeks of gains, concluded within close proximity of the 2020 yearly opening level at 108.62. Continued bidding, moves that overthrow sellers at 108.62, nudges the 2019 yearly opening level at 109.68 into sight. A rotation to the downside from current price, nevertheless, has the 105.98 May 6 low in view, followed by support at 104.70.
On the daily timeframe, we can see price recently shook hands with support at 106.95, after dipping from three-week tops at 107.76. Since then, price has been kicking its heels within striking distance of the 200-day SMA (orange – 108.30), with a break exposing the 109.38 April 6 high.
Areas of consideration:
Lower-timeframe players may find use in noting 107.38 as possible support today.
A fakeout through 108 into the 200-day SMA at 108.30 is a potential scenario possibly interesting sellers. Buy-stops contained above 108 may provide enough fuel to sell. Conservative traders, however, may seek a H4 close beneath 108 before committing.
The H4 ABCD corrections at 108.60 also mark an interesting reversal zone, an area boasting a close relationship with H4 Quasimodo resistance at 108.70 and weekly resistance at 108.62 (the 2020 yearly opening level).
USD/CAD:
Outlook essentially unchanged due to ranging movement.
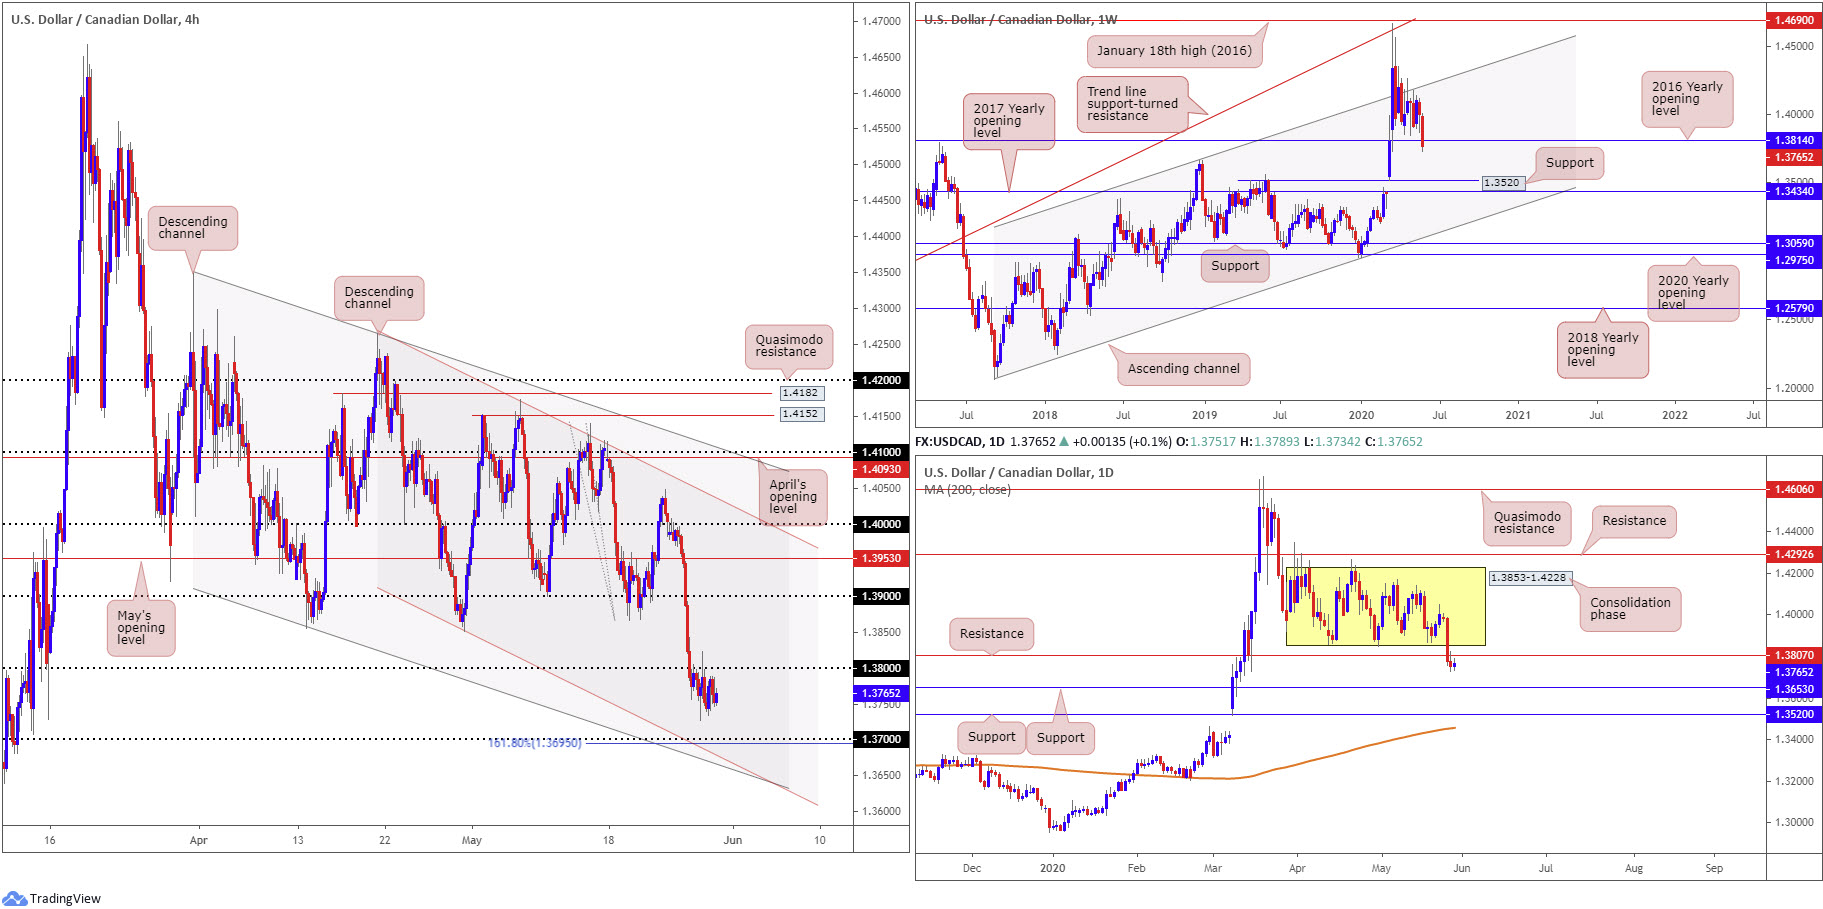
Following Tuesday’s precipitous 1.5% decline, momentum subsided in recent trading, hugging levels south of 1.38 on the H4 timeframe. This turns the spotlight to 1.37, and a 161.8% Fibonacci extension point at 1.3695 as well as two channel supports, taken from the low 1.3855 and 1.3850.
Further out on the weekly timeframe, support, in the shape of the 2016 yearly opening level, at 1.3814 is currently under pressure. Further downside perhaps sets the stage for a run to support at 1.3520 (a prior Quasimodo resistance level).
Since April, price action on the daily timeframe has been carving out a consolidation between 1.3853-1.4228. In the form of a near-full-bodied bearish candle, Tuesday tunnelled through the lower edge of the current range and also took on nearby support coming in at 1.3807, with both Wednesday and Thursday holding lower. The next port of call on the daily chart can be found at support from 1.3653.
Areas of consideration:
Assuming buyers take a back seat at the 2016 yearly opening level drawn from 1.3814, sellers likely have the upper hand going forward. As a result, the recent retest at 1.38 as resistance will likely tempt sellers towards 1.37 as an initial downside target, followed by the H4 161.8% Fibonacci extension point at 1.3695 as well as two H4 channel supports, taken from the low 1.3855 and 1.3850.
USD/CHF:
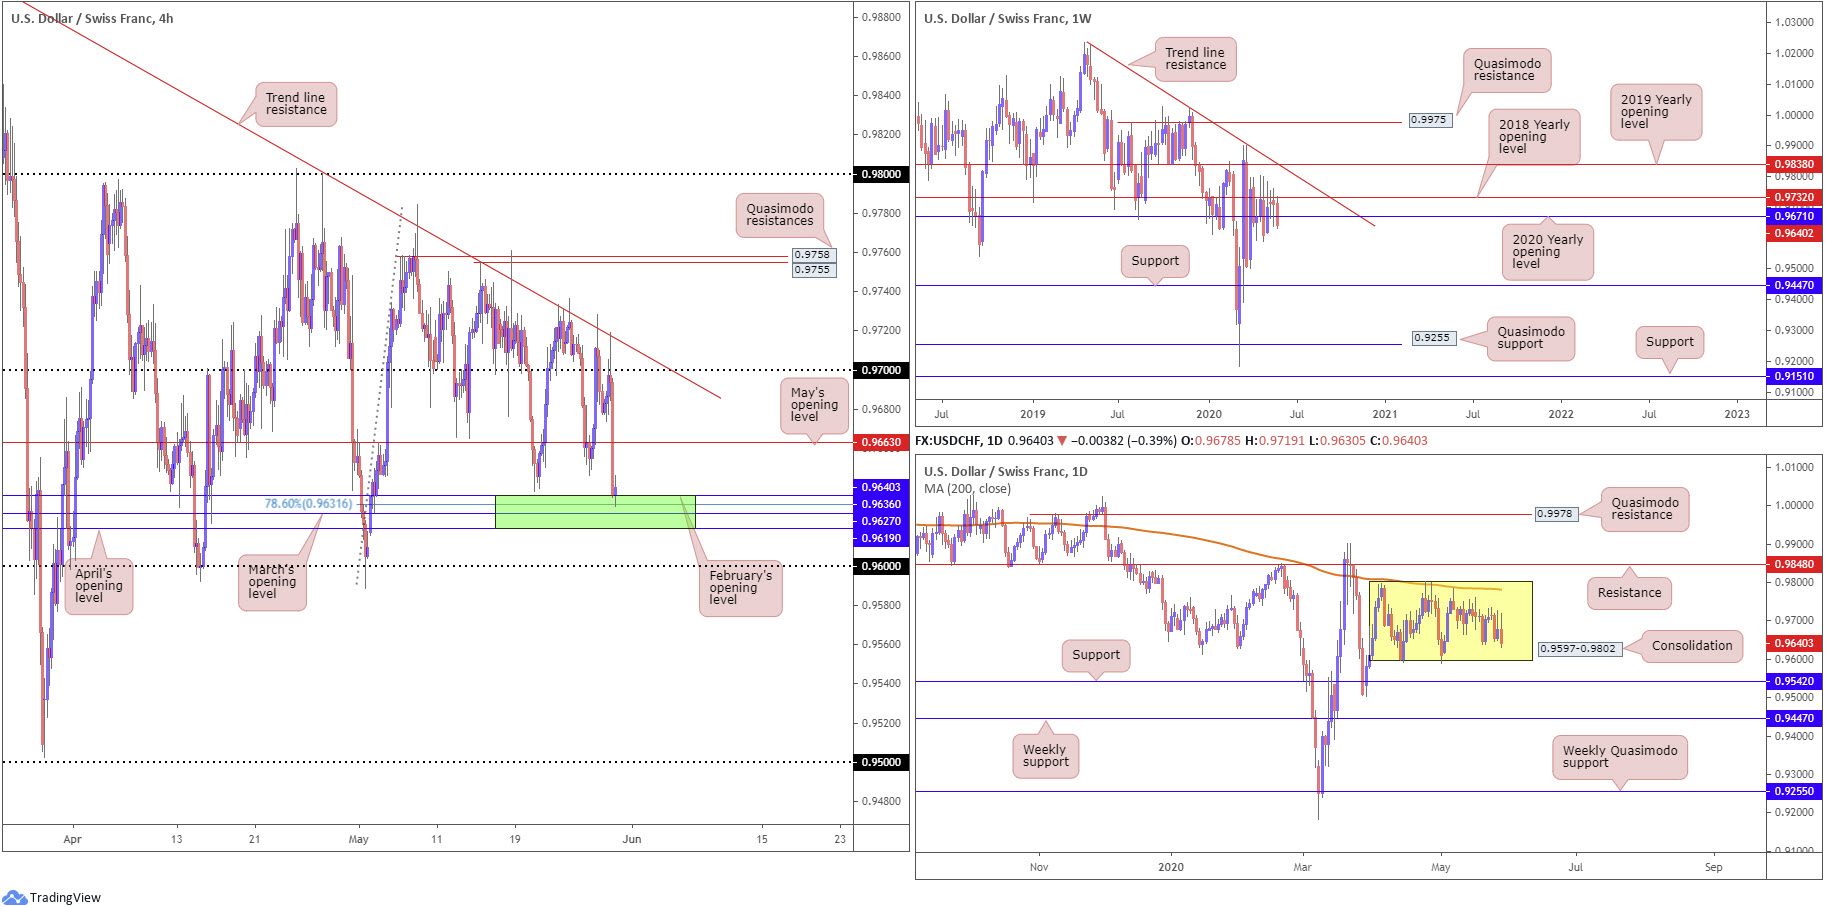
Despite dipping a finger in waters above 0.97, a move drawing in H4 trend line resistance, taken from the high 0.99, the US dollar dived 0.4% against the Swiss franc Thursday, crushing interest off May’s opening level at 0.9663. Sellers, according to research, found legs on the back of USD weakness – DXY crossed through 98.50 – and deteriorating US/China relations.
As a reminder, over the past few days the research team highlighted 0.9619/0.9636 (green) as a potential reversal zone on the H4 timeframe, an area made up of April, March and February’s opening levels, together with a 78.6% Fibonacci retracement ratio at 0.9631. As evident from the chart, recent hours saw price action touch gloves with the upper boundary of the said zone.
Higher up on the curve, longer-term flow based on the weekly timeframe has the unit trekking below the 2020 yearly opening level at 0.9671, following numerous failed attempts at overthrowing 0.9732, the 2018 yearly opening level. Technical structure above 0.9732 is seen at the 2019 yearly opening level drawn from 0.9838 and trend line resistance, taken from the high 1.0226. Moves south of 0.9671 shifts focus to support at 0.9447.
Since early April, price action on the daily timeframe has seesawed between 0.9802/0.9597, with current price circling the lower boundary of the range. Traders may also want to acknowledge the 200-day SMA (orange – 0.9781) joins the upper border of the aforementioned consolidation. Outside of the base, traders will note resistance rests at 0.9848 and support from 0.9542.
Areas of consideration:
0.9619/0.9636 (green) on the H4 timeframe is likely to appeal to buyers, owing to the number of technical supports this area attracts. Selling activity could emerge off 0.9663 from here, with a break exposing 0.97.
Alternatively, dipping lower buyers may find interest off 0.96, knowing the round number intersects with the lower edge of the daily range at 0.9597.
Dow Jones Industrial Average:
Thursday’s advance came to an abrupt halt as investors digested US President Trump stating he intends to hold a press conference on China. The Dow Jones Industrial Average dropped 147.63 points, or 0.58%; the S&P 500 erased 6.40 points, or 0.21%, and the tech-heavy Nasdaq 100 concluded lower by 25.33 points, or 0.27%.
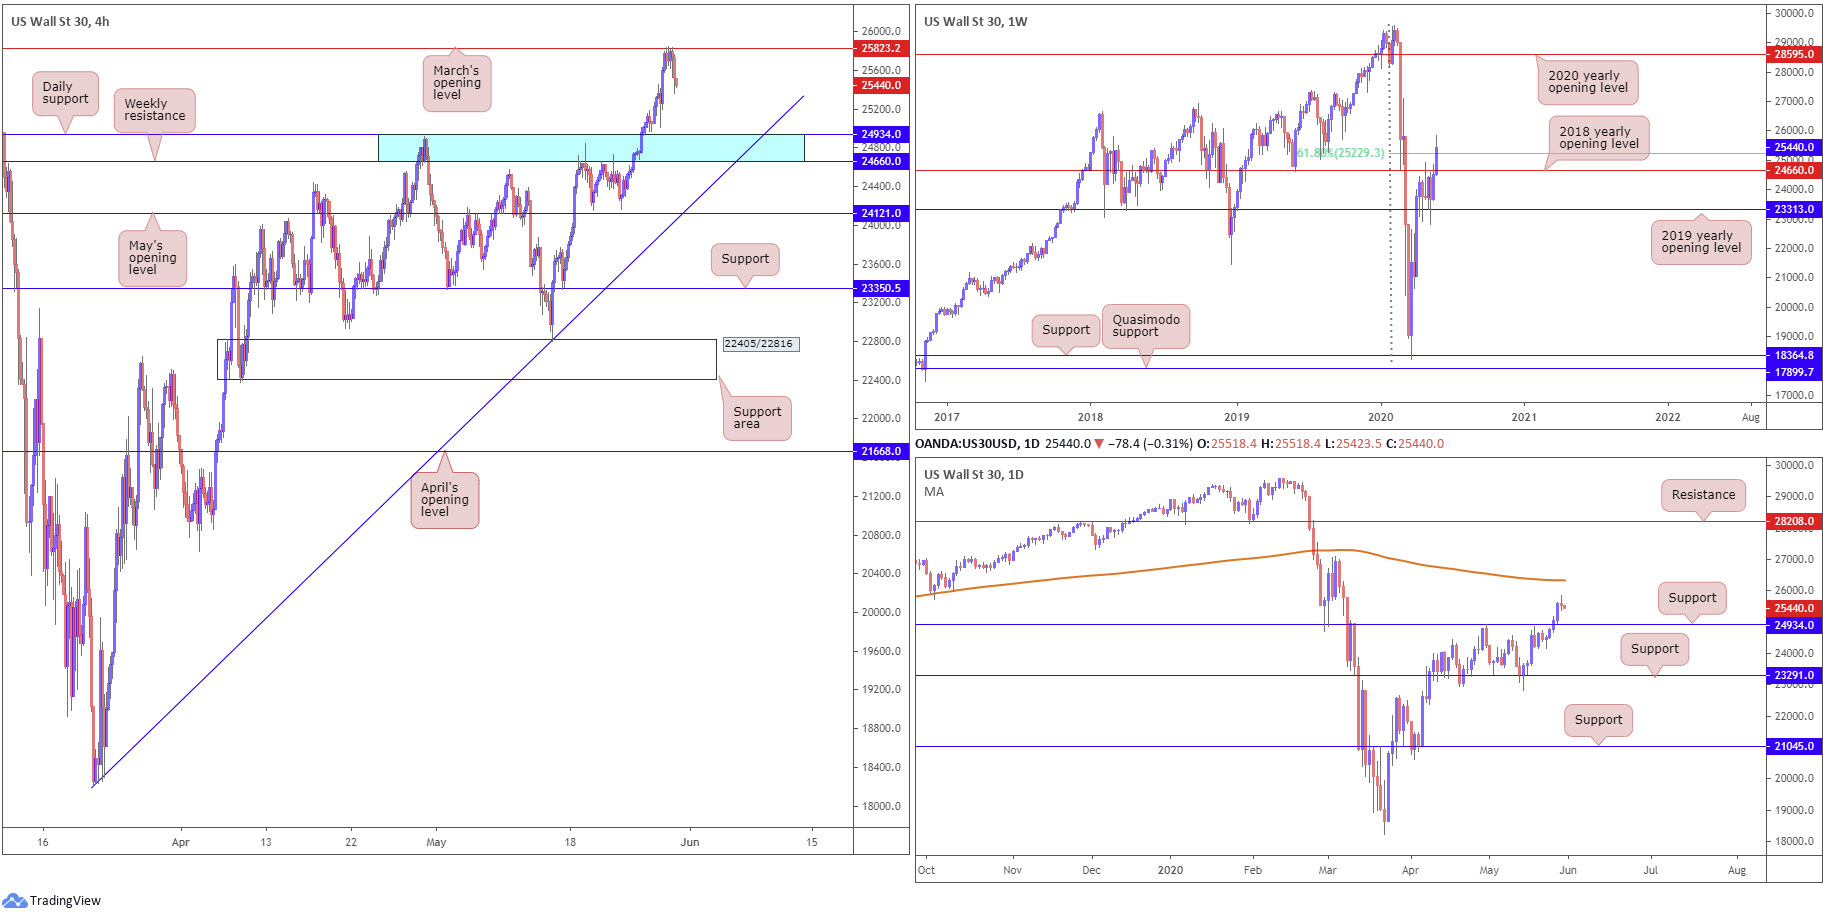
After overwhelming orders at a resistance zone plotted on the H4 timeframe between 24934/24660, an area comprised of a daily support level at 24934 and weekly resistance, by way of the 2018 yearly opening level, at 24660 (blue), March’s opening level at 25823 made an appearance on Thursday. This could guide candles back to 24934/24660 today for a possible retest play, with particular emphasis placed on H4 trend line support, extended from the low 18221.
In terms of the technical landscape on the weekly timeframe, demand recently lifted price action through a 61.8% Fibonacci retracement ratio at 25229. Sustained upside here could eventually have the 2020 yearly opening level at 28595 emerge.
On the daily timeframe, price is seen stalling ahead of the 200-day SMA (orange – 26335) after consuming resistance at 24934 (now a serving support).
Areas of consideration:
A retest scenario at 24934/24660 is a possibility today, an area many will expect buyers to make a show. Conservative traders will likely want to see at least a H4 bullish candlestick pattern form from this area before pulling the trigger; other traders, however, may be satisfied with present structure and position entry levels according to the higher-timeframe zone and trend line support based on the H4 timeframe.
XAU/USD (GOLD):
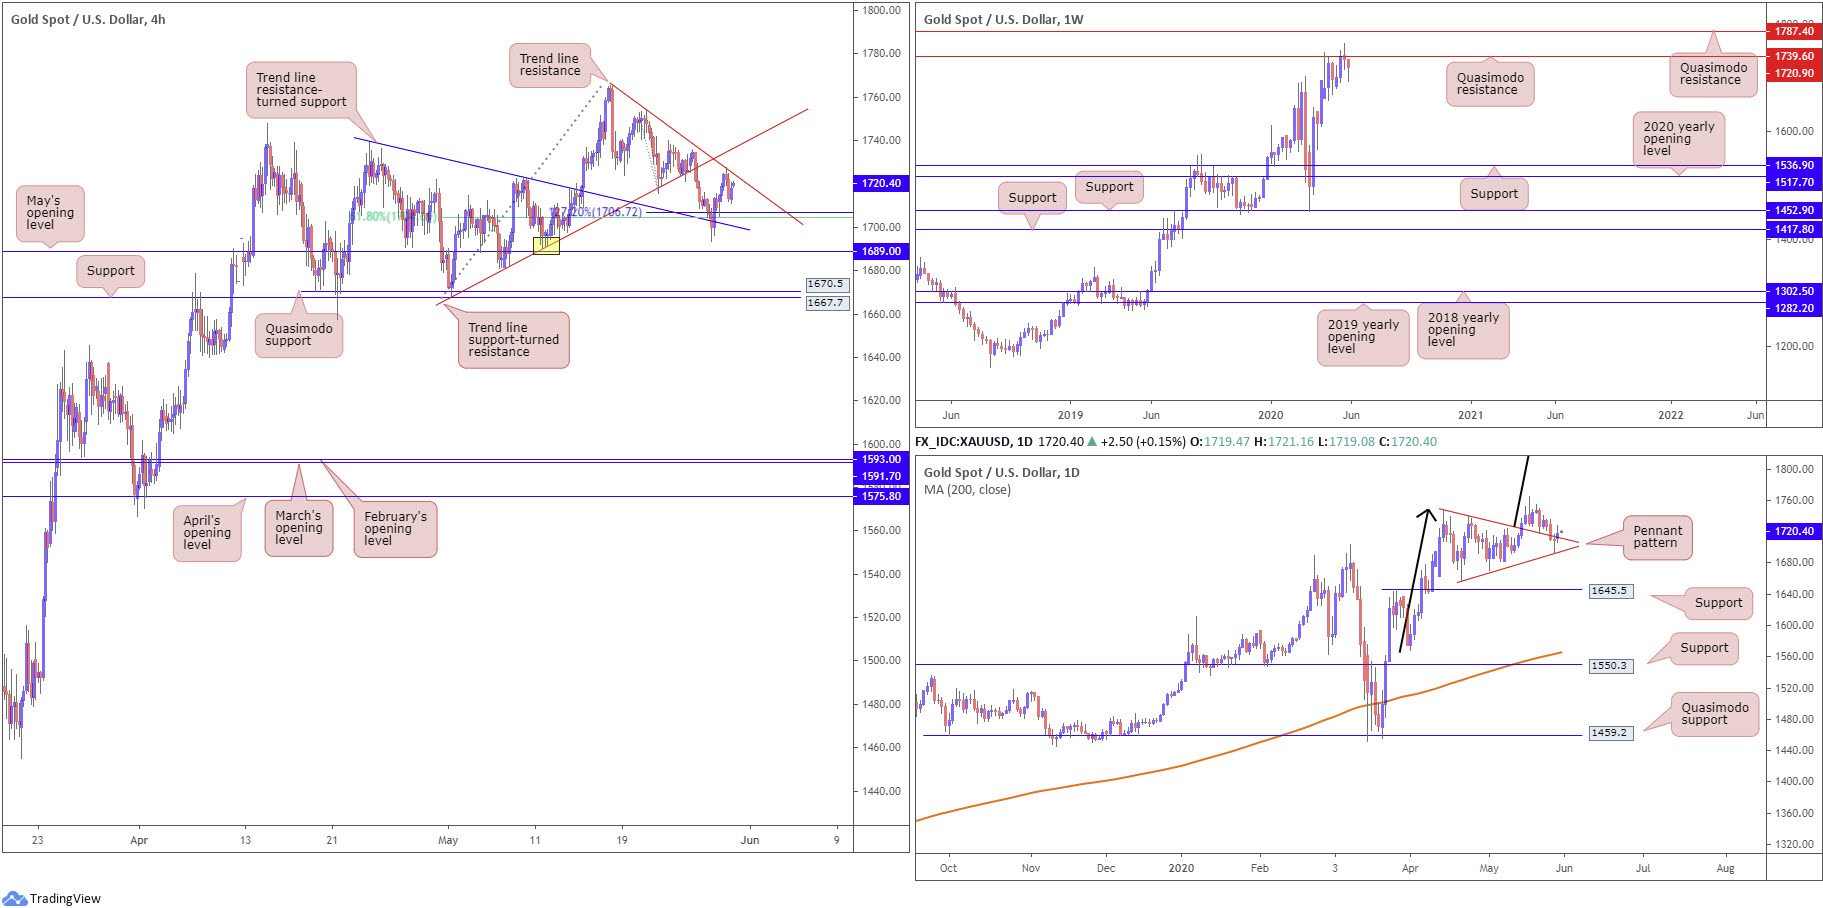
Thursday welcomed a modest recovery, a move that snapped a three-day bearish phase. US/China concerns and a persistent USD offer elevated gold to highs at 1727.7.
H4 trend line resistance-turned support, taken from the high 1739.1, which joins with a 61.8% Fibonacci retracement ratio at 1704.7 and a 127.2% Fibonacci extension point at 1706.7, contained downside in recent trading. However, as emphasised in Thursday’s technical briefing, H4 trend line resistance, extended from the high 1765.1, could hamper upside from here.
What was also highlighted in Thursday’s report was the bullish pennant configuration on the daily timeframe, established from a high of 1747.7 and a low coming in from 1658.1. In the event buyers recover from retesting the pattern’s upper edge as support, take-profit targets out of pennant patterns are measured by taking the preceding move (black arrows) and adding the value to the breakout point. This offers a sizeable take-profit, coming in at 1909.4.
The technical landscape on the weekly timeframe has, from mid-April, seen buyers and sellers battle for position around the underside of Quasimodo resistance at 1739.6. Clearance of this base places another layer of Quasimodo resistance on the hit list at 1787.4. It may also interest some traders to note the trend on gold has faced a northerly trajectory since 2016.
Areas of consideration:
Traders long current H4 support will be watching for H4 price to drive through H4 trend line resistance, perhaps regarded as a cue to reduce risk to breakeven and bank partial profits. H4 trend line support-turned resistance, taken from 1668.0, fits as the next hurdle to the upside, which actually intersects closely with weekly Quasimodo resistance mentioned above at 1739.6. This area, therefore, may house active sellers, likely prompting longs to cover the majority of their risk.
The accuracy, completeness and timeliness of the information contained on this site cannot be guaranteed. IC Markets does not warranty, guarantee or make any representations, or assume any liability regarding financial results based on the use of the information in the site.
News, views, opinions, recommendations and other information obtained from sources outside of www.icmarkets.com.au, used in this site are believed to be reliable, but we cannot guarantee their accuracy or completeness. All such information is subject to change at any time without notice. IC Markets assumes no responsibility for the content of any linked site.
The fact that such links may exist does not indicate approval or endorsement of any material contained on any linked site. IC Markets is not liable for any harm caused by the transmission, through accessing the services or information on this site, of a computer virus, or other computer code or programming device that might be used to access, delete, damage, disable, disrupt or otherwise impede in any manner, the operation of the site or of any user’s software, hardware, data or property.


