
A note on lower timeframe confirming price action…
Waiting for lower timeframe confirmation is our main tool to confirm strength within higher timeframe zones, and has really been the key to our trading success. It takes a little time to understand the subtle nuances, however, as each trade is never the same, but once you master the rhythm so to speak, you will be saved from countless unnecessary losing trades. The following is a list of what we look for:
- A break/retest of supply or demand dependent on which way you’re trading.
- A trendline break/retest.
- Buying/selling tails/wicks – essentially we look for a cluster of very obvious spikes off of lower timeframe support and resistance levels within the higher timeframe zone.
- Candlestick patterns. We tend to only stick with pin bars and engulfing bars as these have proven to be the most effective.
For us, lower timeframe confirmation starts on the M15 and finishes up on the H1, since most of our higher timeframe areas begin with the H4. Stops usually placed 5-10 pips beyond your confirming structures.
EUR/USD:
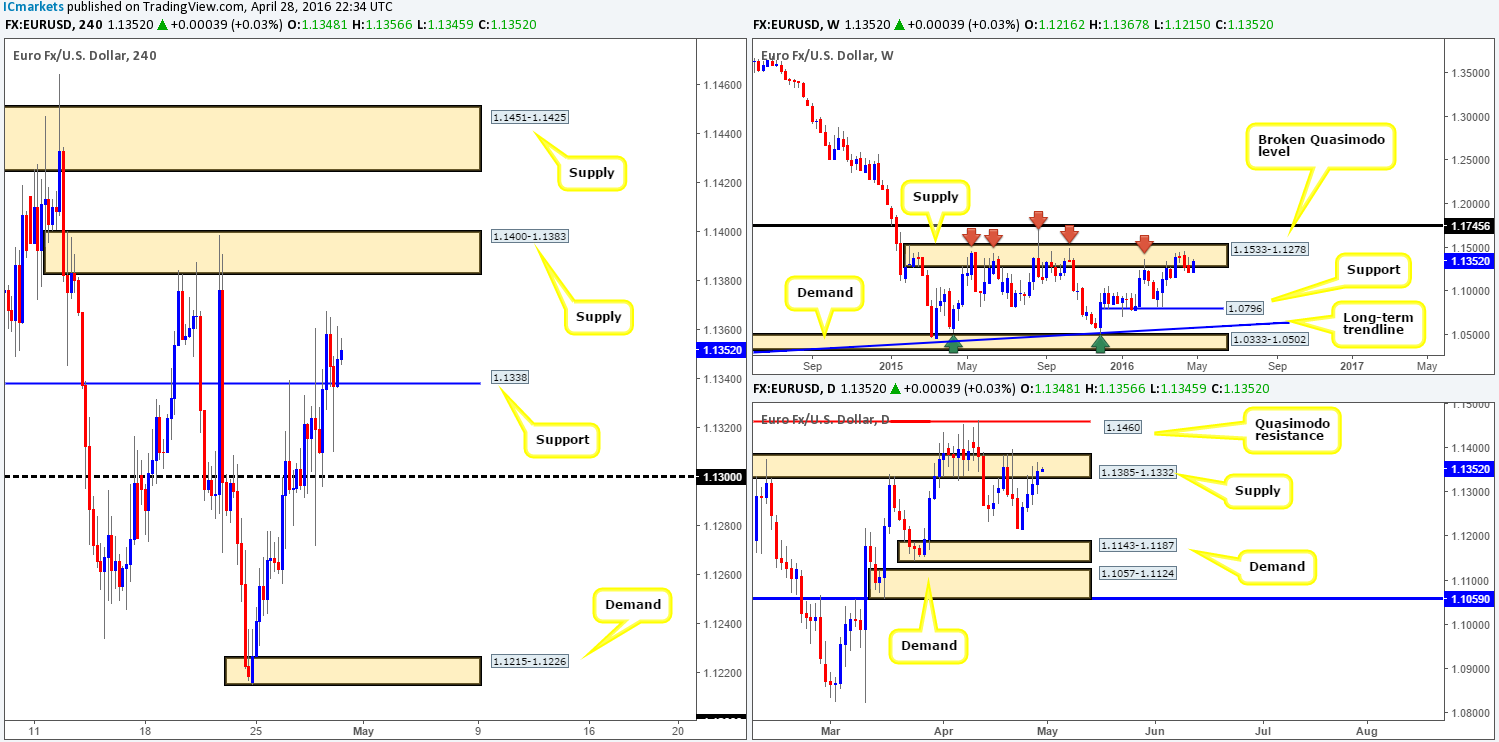
In recent sessions the single currency pushed to new highs of 1.1367, and has since settled around the 1.1338 mark – a resistance-turned support. On the assumption that this line holds steady today, there’s little H4 structure seen overhead stopping the EUR from reaching H4 supply chalked up at 1.1400-1.1383. While this may be true, given the recent rejection from the high 1.1367 and aggressive stab down to lows of 1.1310 yesterday, we have no interest in buying this market. In addition to this, if one scans across to the higher-timeframe charts you’ll be able to see that both the weekly and daily timeframes are currently trading within supplies at the moment (weekly: 1.1533-1.1278, daily: 1.1385-1.1332), which does not exactly place one in an ideal environment to buy!
Therefore, despite the EUR posting gains since the beginning of the week, traders should take into consideration what the bigger picture is showing (see above). As such, to our way of seeing things right now we have two options:
- Watch for price to close below and retest the current H4 support as resistance at 1.1338. This would, in our opinion, place one on solid footing to short this market, targeting the 1.1300 line as a first take-profit zone.
- In the event that this pair continues to advance north, selling at the overhead H4 supply coming in at 1.1400-1.1383 could be a possibility considering what we’ve noted on higher-timeframe structure (see above).
Of course, how you enter at these zones is totally up to the individual trader. Our analysis, however, states that both of the above said areas require to be confirmed with lower timeframe price action before risking capital (for confirmation techniques, please see the top of this report). Reason being is the H4 supply, although bolstered by higher-timeframe supply, has already been aggressively tested twice already, and the H4 support, being a fixed level, is liable to fakeouts.
Levels to watch/live orders:
- Buys: Flat (Stop loss: N/A).
- Sells: 1.1400-1.1383 [Tentative – confirmation required] (Stop loss: dependent on where one confirms this area). Watch for price to close below the H4 support 1.1338 and look to trade any retest seen thereafter (lower timeframe confirmation required).
GBP/USD:
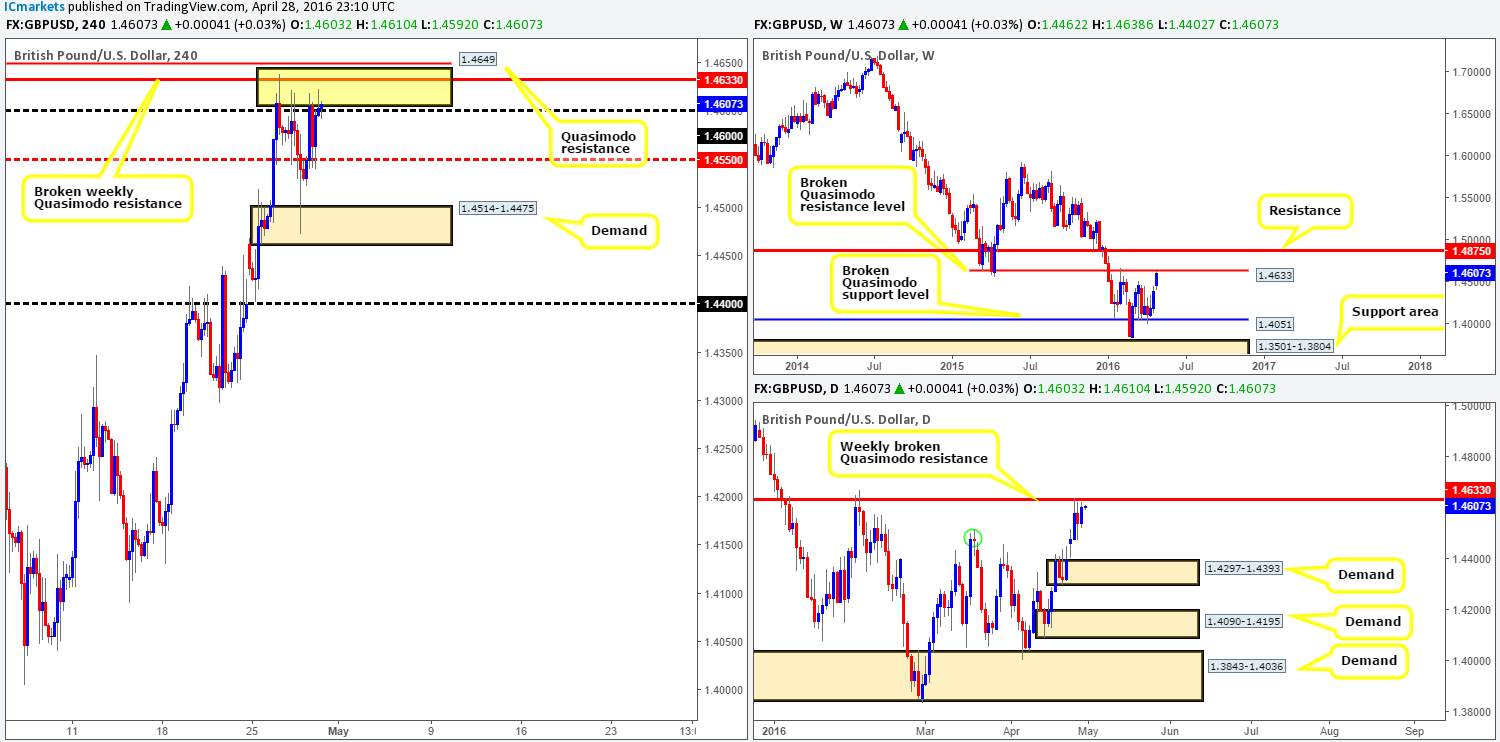
Coming at you directly from the weekly chart this morning reveals that Cable remains trading below a broken weekly Quasimodo resistance barrier penciled in at 1.4633. With this level holding price lower back in early February, there’s a good chance we may see a re-run of this scenario in the coming weeks. Scrolling down to the daily chart, however, one can see that the bulls are not giving up here without a fight, as support is being seen from the recently engulfed 18th March highs at 1.4514 (green circle).
Stepping across to the H4 chart, demand at 1.4514-1.4475 which held beautifully on Wednesday, is in actual fact the decision-point area where the market decided to push above the 18th March highs. It will only be until this zone is taken out can we expect to see price drive down to daily demand at 1.4297-1.4393 (the next down-side target on the daily timeframe), essentially the 1.4400 handle on the H4 chart.
Right now, price is trading within a nice-looking H4 sell zone marked with a yellow box:
- A H4 Quasimodo resistance level at 1.4649.
- A broken weekly Quasimodo resistance level seen at 1.4633.
- Psychological resistance 1.4600.
With everything taken into consideration, we feel a short from here is viable today. Nevertheless, given that the H4 demand at 1.4514-1.4475 recently held firm (which as we already know is connected to the break of daily highs – see above), we’re only going to be looking to enter short with the aid of lower timeframe price action confirmation. A break of lower timeframe demand and retest of this area as supply would be perfect, a break below and retest of a trendline or even a collection of selling wicks around lower-timeframe resistance would suffice in our opinion.
Levels to watch/live orders:
- Buys: Flat (Stop loss: N/A).
- Sells: 1.4649/1.4600 [Tentative – confirmation required] (Stop loss: dependent on where one confirms this area).
AUD/USD:
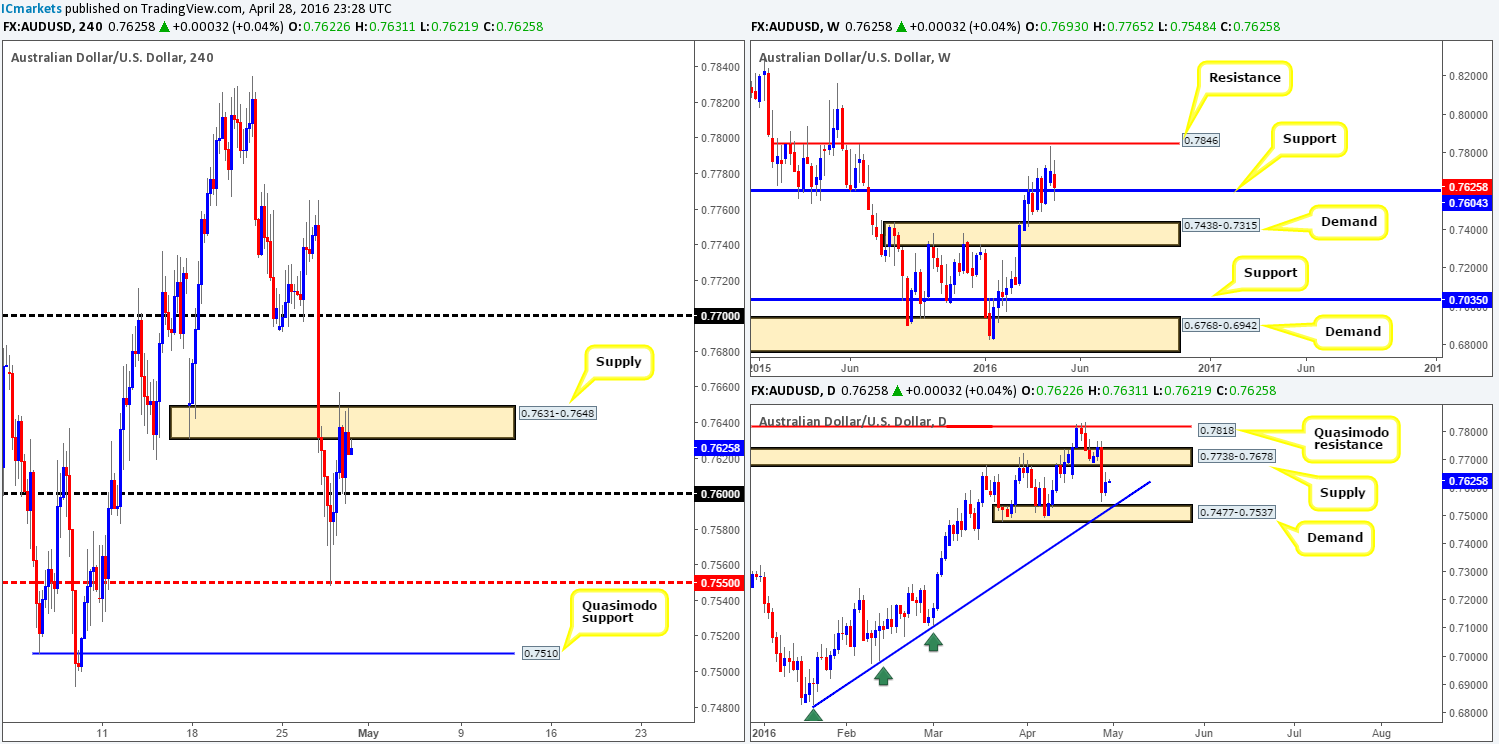
Throughout the course of yesterday’s sessions, we saw the commodity currency advance to highs of 0.7657 before retreating back down to retest the 0.7600 handle going into the U.S. open. What this also did, as you can see, was breach H4 supply coming in at 0.7631-0.7648, potentially unlocking the gates north for an push up to the 0.7700 resistance. This – coupled with the weekly chart positioning itself above support at 0.7604 could possibly encourage further buying in this market today. However, before pressing the buy button, traders may want to take note that thirty or so pips above the current H4 supply sits the underside of daily supply drawn from 0.7678, which, as we’re sure you’ll agree, does not really leave much room to play with!
With upside to this market looking rather cramped at the moment, we feel that opting to stand on the sidelines may very well be the best path to take on this pair today.
Levels to watch/live orders:
- Buys: Flat (Stop loss: N/A).
- Sells: Flat (Stop loss: N/A).
USD/JPY:
Whoa! The USD/JPY was certainly the place to be if you were selling yesterday! The pair tanked almost 340 pips (daily open/close) after the BoJ decided to leave monetary policy unchanged. This, as can be seen from the H4 chart, took out several technical levels before bottoming out around H4 support at 107.19. On top of this, the recent surge in selling also brought price down into the jaws of a daily demand zone at 107.60-108.35, which sits directly above weekly demand drawn from 105.19-107.54.
In light of recent events, where does one go from here? Well, taking into consideration where price is now positioned on the higher-timeframe picture (see above), we’re going to be looking to buy this market from 107.50/107.91 (yellow box) today. The reason for this zone is simply to include both the top-side of weekly demand at 107.54 and the daily demand base at 107.60-108.35 in one compact area. Should we manage to pin down a lower timeframe buy setup within this box, our first take-profit target will be the H4 mid-way resistance 108.50, followed closely by the 109.00 resistance and then H4 supply at 109.27-109.49 (blends nicely with a recently broken daily demand-turned supply at 109.26-109.83).

Levels to watch/live orders:
- Buys: 107.50/107.91 [Tentative – confirmation required] (Stop loss: dependent on where one confirms this area).
- Sells: Flat (Stop loss: N/A).
USD/CAD:
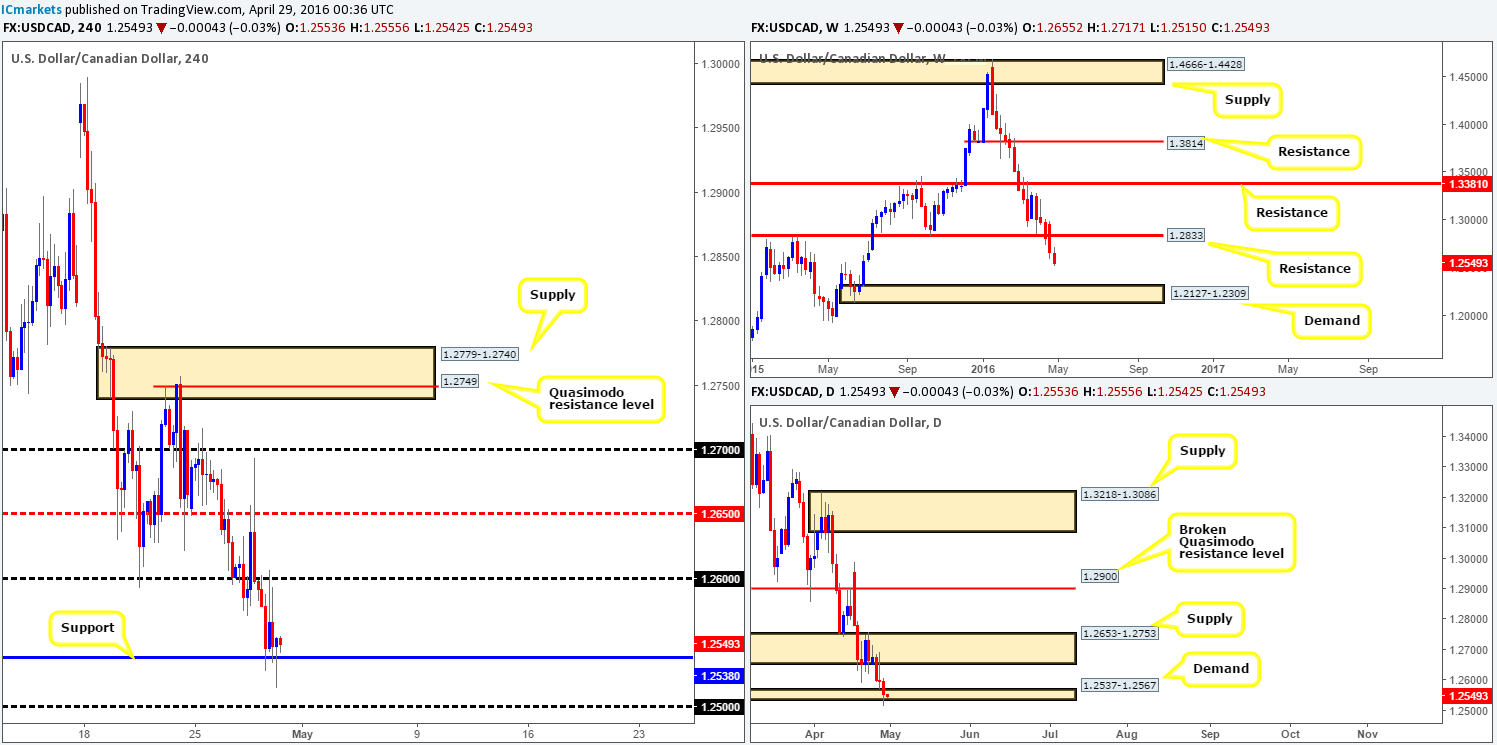
In recent trading the USD/CAD retested the 1.2600 handle and plunged lower to cross swords with H4 support chalked up at 1.2538. This was a noted move to watch for in Thursday’s report, so well done to any of our readers who managed to board this train before it headed south. As of now we can see that both of the above said levels remain firm. So let’s take a peek across to the higher-timeframe charts which will hopefully give us a little more direction to focus on!
Over on the weekly chart, there is, as we mentioned in previous reports, room seen for a possible continuation move south down towards demand at 1.2537-1.2567. Meanwhile, down on the daily chart, demand at 1.2537-1.2567 was recently breached which likely triggered a truckload of stops below this zone! Thanks to this, the road south appears to now be clear down to demand seen at 1.2309-1.2397, which sits on top of the aforementioned weekly demand.
As things stand, buying from the current H4 support level is a risky play as far as we can see. Therefore, the best and in our opinion most logical route would be to wait for a close below this H4 support. That way, traders can position themselves to take advantage of any (confirmed) retest that may be seen to the underside of this line (for confirmation techniques, please see the top of this report). Should the above scenario come into view, we’ll be looking to take partial profits at the 1.2500 line, followed by the 1.2400 line since this marks the top-side of the next target demand on the daily timeframe (see above).
Levels to watch/live orders:
- Buys: Flat (Stop loss: N/A).
- Sells: Watch for price to close below the H4 support 1.2538 and look to trade any retest seen thereafter (lower timeframe confirmation required).
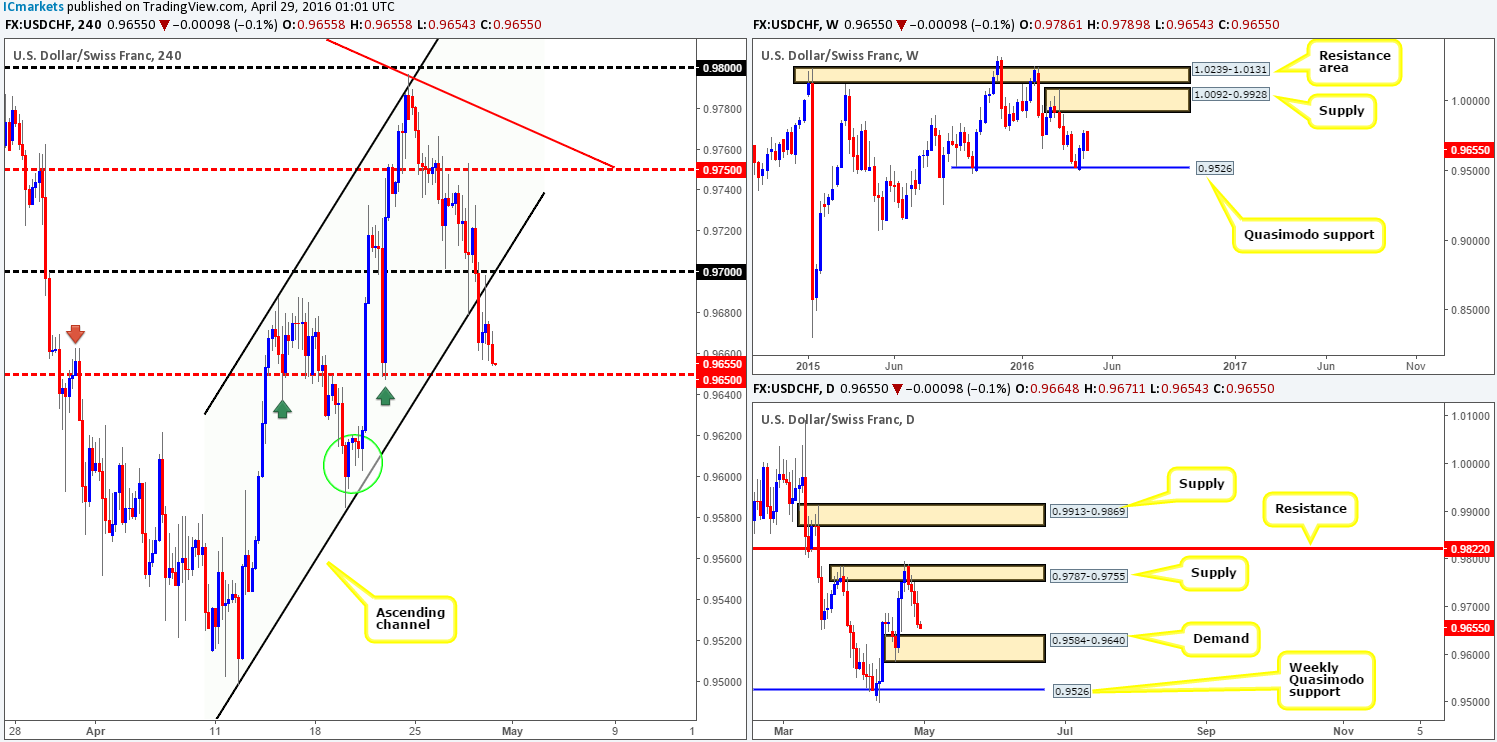
USD/CHF:
Early on in yesterday’s trading, the Swissy took on a more bearish stance. Both the psychological support 0.9700 along with the H4 channel support line (0.9498) was wiped out. Shortly after, price stabbed north to retest these broken lines as resistance, which, as you can see, clearly held and helped push the pair into its fourth consecutive loss.
At the time of writing, the market is seen heading in the direction of a H4 mid-way support at 0.9650. Check out how well this line has held in the past (green/red arrows), it is quite impressive. Furthermore, ten pips below this line lurks the top-side of a daily demand at 0.9640. As such, we feel that this small area might be enough to bounce prices and potentially give us a trade opportunity today. We would not be confident enough to enter without lower timeframe confirmation (for confirmation techniques, please see the top of this report), however, due to the following points:
- There is little support seen below 0.9650 on the H4 down until the extreme point of the daily demand (mentioned above) at 0.9584-0.9615 (green circle).
- Little support is seen on the weekly timeframe until price retests the Quasimodo support at 0.9526.
In the event that our above analysis is correct, the first upside target can be seen at the 0.9700 line.
Levels to watch/live orders:
- Buys: 0.9650 region [Tentative – confirmation required] (Stop loss: dependent on where one confirms this area).
- Sells: Flat (Stop loss: N/A).
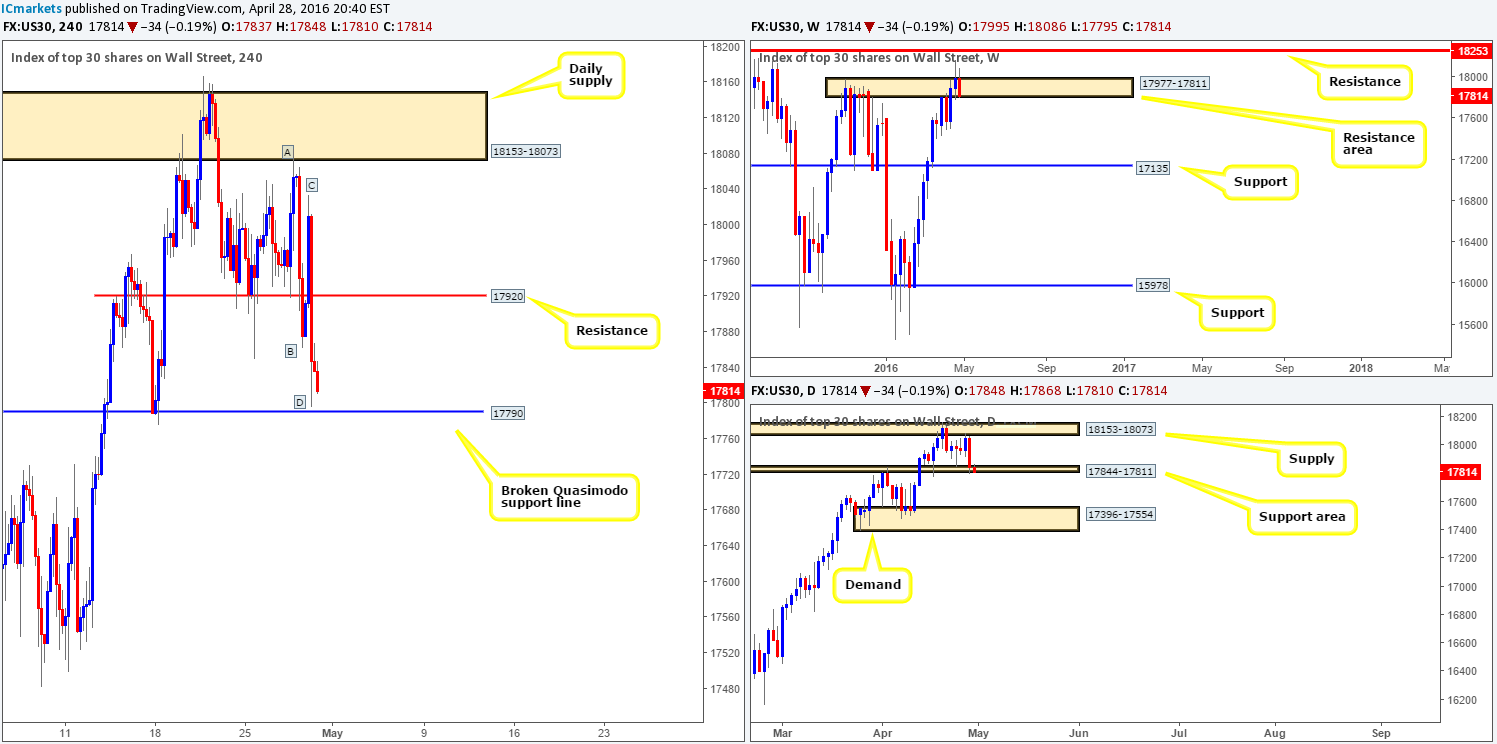
DOW 30:
(Slight change in structure)
U.S. stocks took a turn for the worse yesterday as prices collapsed to lows of 17796 by the day’s end, missing the broken H4 Quasimodo support line at 17790 by only a few points. Consequent to this movement, the DOW effectively chalked up a nice-looking H4 AB=CD bullish pattern (see letters A-D). Does this H4 support and its approach alongside price now also trading within a small daily support area at 17844-17811 present enough to contemplate buying this market today? Well, up on the weekly chart, the resistance area coming in at 17977-17811, despite suffering two whipsaws, is holding firm for the time being. Therefore, even though both the H4 and daily charts indicate buying may be an option, we cannot simply forget what weekly traders are doing!
Given the above points, we believe that buying is risky if one simply enters long with a market order hoping that the weekly sellers do not crush them! If on the other hand one has the patience to wait for buying strength to formulate on the lower timeframes around the H4 broken Quasimodo support line (see above), then a long trade could be possible, targeting H4 resistance at 17920 (for confirmation techniques, please see the top of this report).
Levels to watch/live orders:
- Buys: 17790 region [Tentative – confirmation required] (Stop loss: dependent on where one confirms this area).
- Sells: Flat (Stop loss: N/A).
XAU/USD:
As shown on the H4 chart, Gold aggressively advanced north yesterday reaching highs of 1269.5 on the back of dollar weakness. Now, considering that the yellow metal is trading just ahead of a very tasty-looking H4 Quasimodo resistance level at 1279.7, do we have enough support from the higher timeframes to condone a short from this line? High up on the weekly chart, price is seen loitering within touching distance of a weekly supply base at 1307.4-1280.0, which held price lower back in early March this year. Not only this, but also notice that the lower edge of this weekly supply fuses almost perfectly with our H4 Quasimodo resistance line! On the other side of the field, however, daily price has just recently peeked above supply coming in at 1270.8-1257.5, and has opened the door to a potential continuation move up to daily resistance at 1283.4.
With the above info in mind, the H4 Quasimodo resistance line looks to be a smashing line to short today. We have placed a pending order at 1278.93 with a stop above the apex of the H4 Quasimodo formation at 1285.50. Placing our stop here also clears the daily resistance hurdle at 1283.4. Should the H4 continue to rally without pulling back before hitting the sell order, our first take-profit target will be the recently engulfed high formed on the 21st April at 1270.1 (green circle).
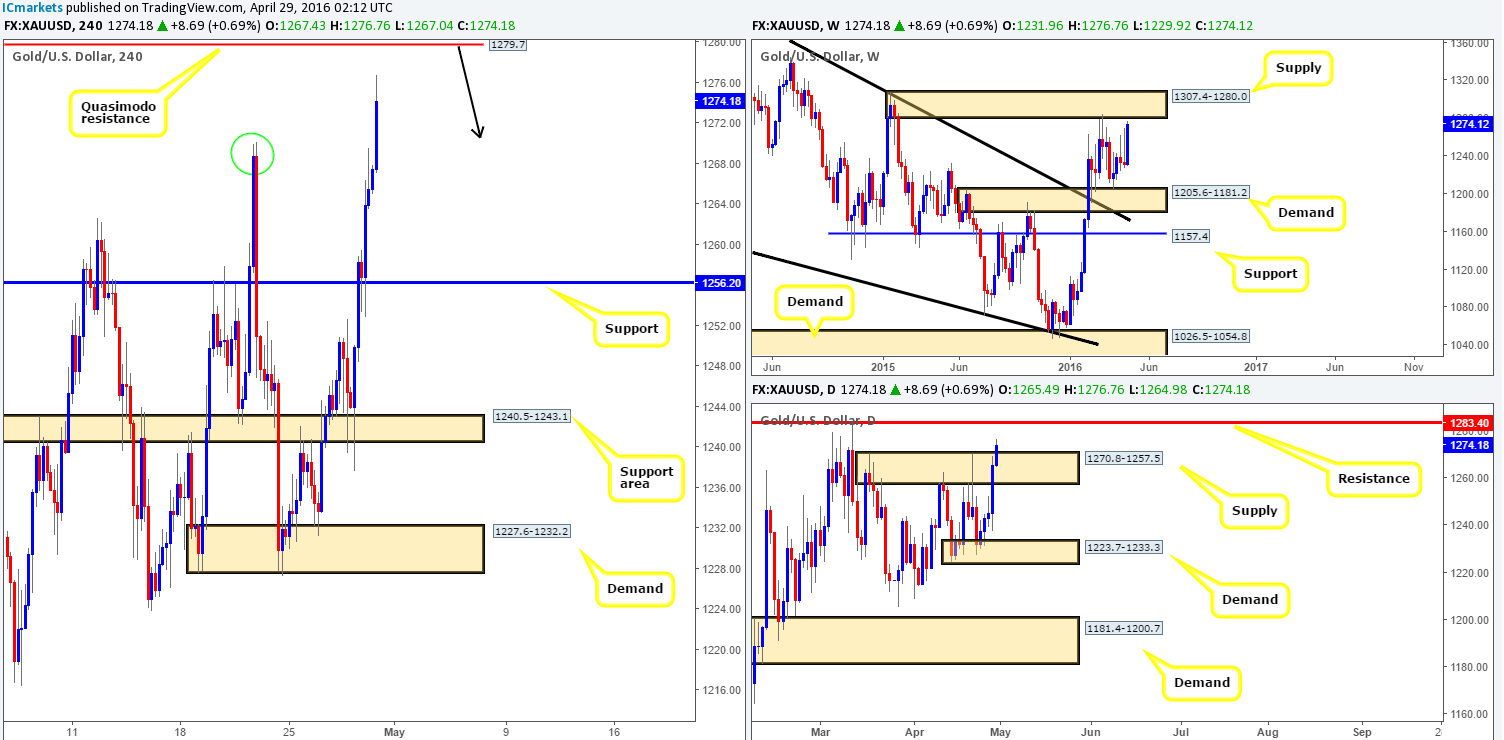
Levels to watch/live orders:
- Buys: Flat (Stop loss: N/A).
- Sells: 1278.93 [Pending order] (Stop loss: 1285.50).


