Waiting for lower timeframe confirmation is our main tool to confirm strength within higher timeframe zones, and has really been the key to our trading success. It takes a little time to understand the subtle nuances, however, as each trade is never the same, but once you master the rhythm so to speak, you will be saved from countless unnecessary losing trades. The following is a list of what we look for:
- A break/retest of supply or demand dependent on which way you’re trading.
- A trendline break/retest.
- Buying/selling tails/wicks – essentially we look for a cluster of very obvious spikes off of lower timeframe support and resistance levels within the higher timeframe zone.
- Candlestick patterns. We tend to stick with pin bars and engulfing bars as these have proven to be the most effective.
We typically search for lower-timeframe confirmation between the M15 and H1 timeframes, since most of our higher-timeframe areas begin with the H4. Stops are usually placed 1-3 pips beyond confirming structures.
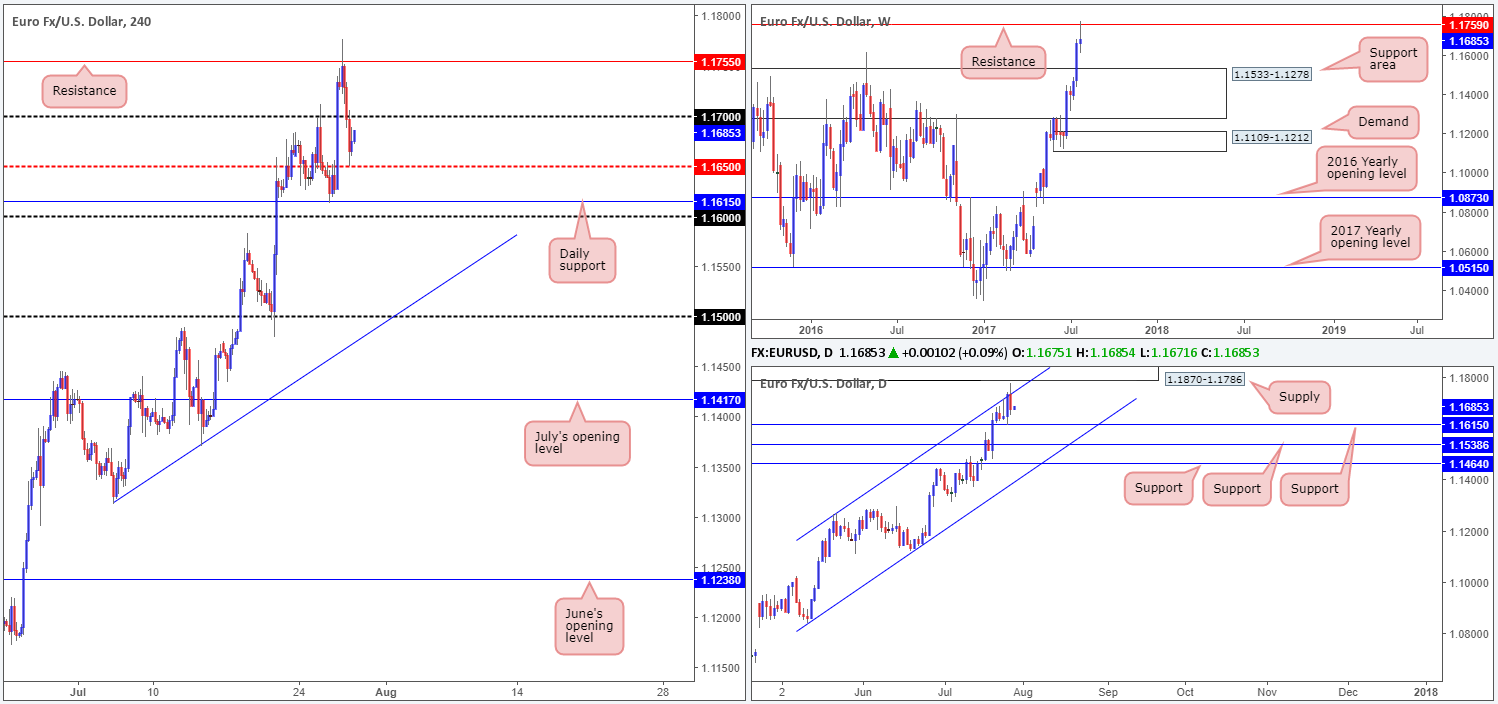
EUR/USD:
During the course of yesterday’s segment, the EUR/USD underwent a rather aggressive downside correction from a H4 resistance level seen at 1.1755. Likely influenced by the daily channel resistance line extended from the high 1.1263 and a weekly resistance level seen at 1.1759 (we missed this weekly level yesterday), the single currency managed to run through the 1.17 handle and cross swords with the H4 mid-level barrier at 1.1650 going into the closing bell.
According to weekly structure, price could stretch down as low as the support area seen at 1.1533-1.1278. On the daily timeframe, nonetheless, the next downside target is seen a little closer at 1.1615 (a support level). Therefore, a H4 close beyond 1.1650 is not necessarily an indication to short!
Our suggestions: As price is nearing a daily support right now, our team is reluctant to sell this market. By the same token, buying the pair would also be a risky move, in our opinion, given where both the weekly and daily candles are trading from at the moment (see above). On that note, remaining flat may very well be the better path to take today.
Data points to consider: US Advance GDP figures q/q at 1.30pm, FOMC member Kashkari speaks at 6.20pm GMT+1.
Levels to watch/live orders:
- Buys: Flat (stop loss: N/A).
- Sells: Flat (stop loss: N/A).
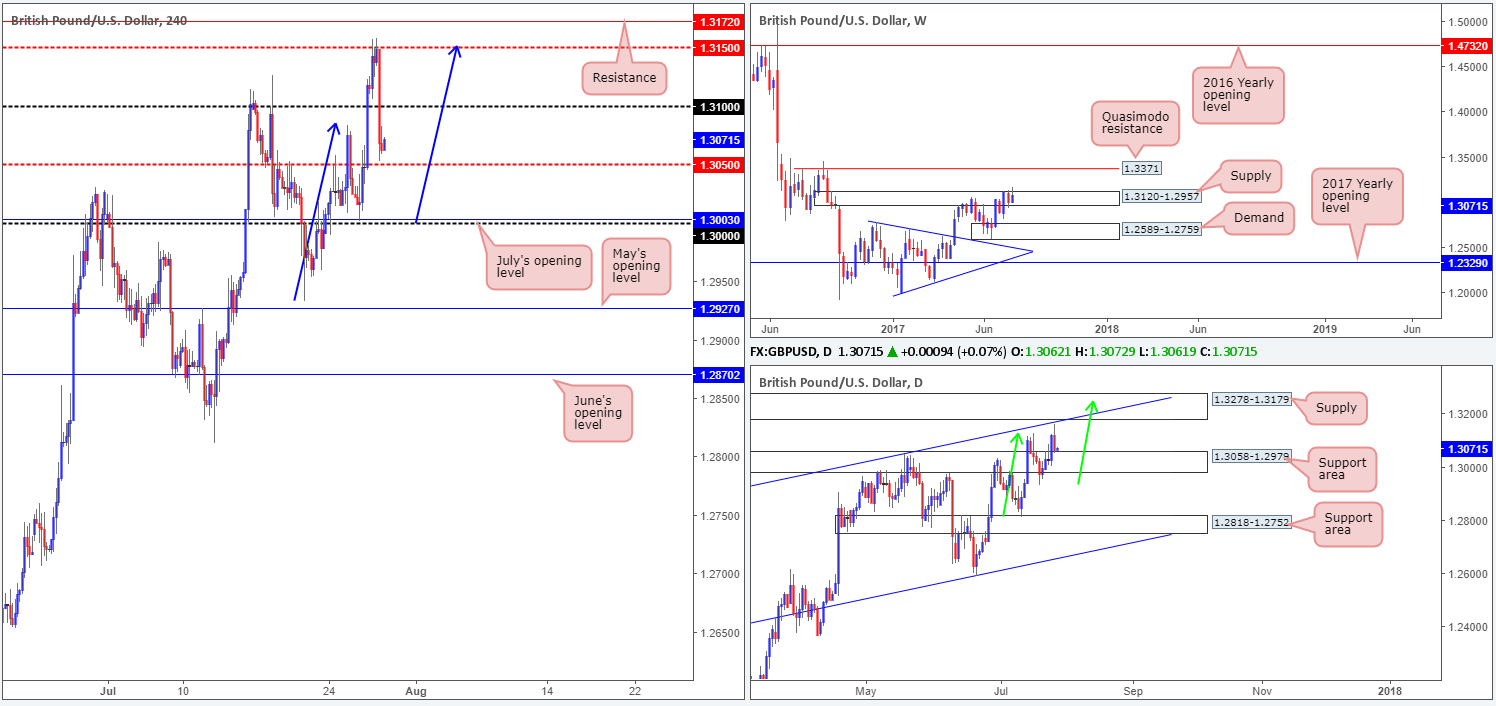
GBP/USD:
Strong sellers came into the market yesterday after price shook hands with a H4 mid-level resistance at 1.3150. The approach to this barrier, as we highlighted in Thursday’s report, was a nice-looking H4 AB=CD bearish formation which terminated at exactly 1.3150 (see blue arrows). We did not take this trade as we were looking for price to connect with the daily supply seen above this line at 1.3278-1.3179 (converges with a daily channel resistance line drawn from the high1.2774).
Moving forward, we can see that weekly price is currently trading back within the walls of supply at 1.3120-1.2957, and daily action is now seen challenging the top edge of a support area coming in at 1.3058-1.2979. Over on the H4 chart, the pair is hovering above the mid-level number 1.3050.
Our suggestions: At current prices, similar to the EUR/USD, we have conflicting signals in this market. A buy would place one against potential weekly sellers, whereas a sell would have you shorting into a daily support area.
We would, nonetheless, still be interested in selling from the daily supply base mentioned above at 1.3278-1.3179, given the potential AB=CD bearish pattern (green arrows) that completes within the supply, and the aforesaid converging daily channel resistance line.
Data points to consider: US Advance GDP figures q/q at 1.30pm, FOMC member Kashkari speaks at 6.20pm GMT+1.
Levels to watch/live orders:
- Buys: Flat (stop loss: N/A).
- Sells: 1.3278-1.3179 ([waiting for a H4 bear candle to form – preferably a full, or near-full-bodied candle – before pulling the trigger is advised] stop loss: ideally beyond the candle’s wick).
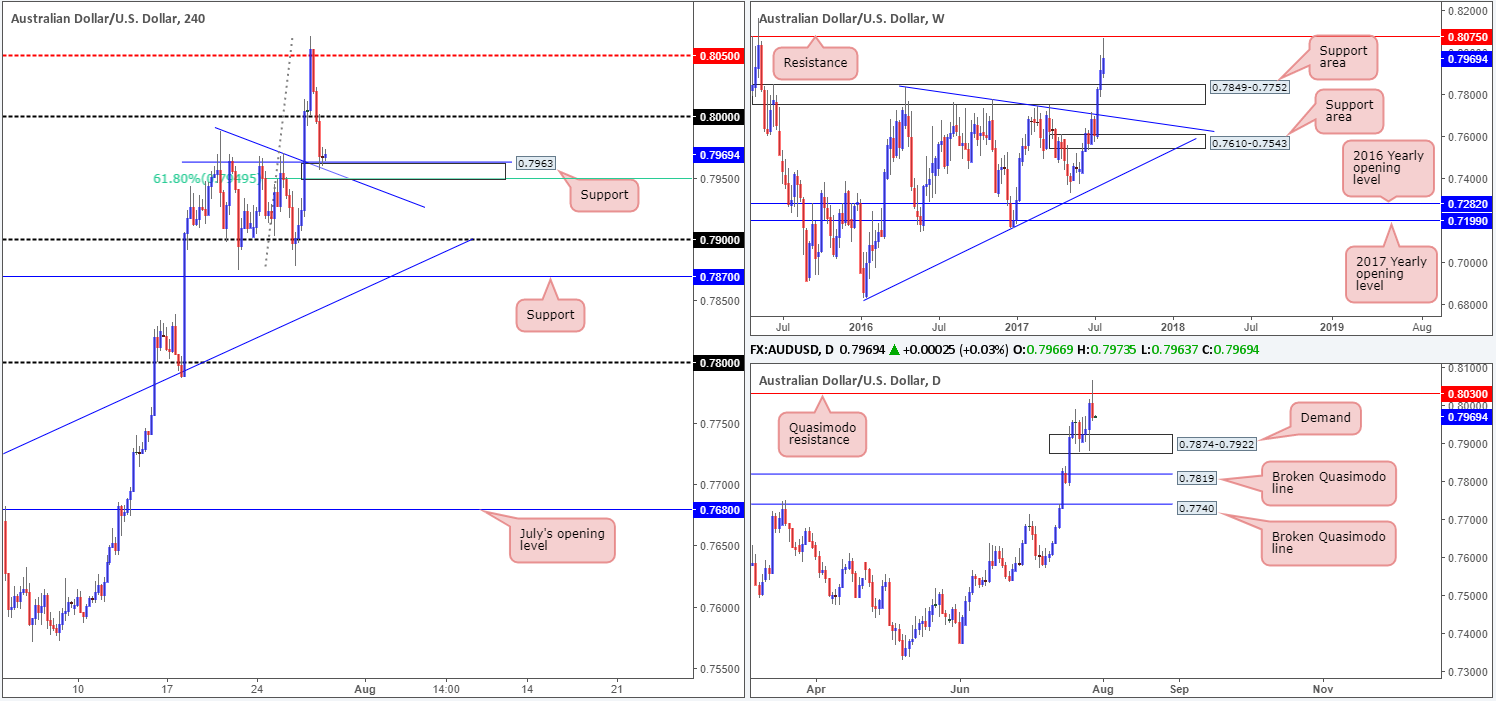
AUD/USD:
Coming in from the top this morning, the weekly timeframe shows that price came within ten pips of connecting with a major resistance line at 0.8075 yesterday, before selling off. Assuming that the bears remain in a dominant position here, this could lead to price trading as far down as the support area seen at 0.7849-0.7752. Turning our attention to the daily candles, the Quasimodo resistance at 0.8030 has managed to hold firm which could force the unit down to demand at 0.7874-0.7922.
Sliding across to the H4 timeframe, price is now seen challenging a support at 0.7963, after driving through the nearby psychological band at 0.80. As you can see, this support also fuses nicely with a trendline support taken from the high 0.7987, a nearby mid-level support at 0.7950 and also a 61.8% Fib support at 0.7950 drawn from the low 0.7877.
Our suggestions: While H4 price is seen holding steady above 0.7963 right now, both the weekly and daily charts suggest further selling may be on the cards. In view of this, despite the surrounding H4 confluence, we are reluctant to buy this market at this time.
With longs out of the question, what about shorts? Well, a close below the 0.9550 neighborhood would likely open the trapdoor down to the 0.79 handle. However, seeing as how the top edge of the current daily demand is sited at 0.7922, there’s a good chance 0.79 may not be challenged!
Data points to consider: US Advance GDP figures q/q at 1.30pm, FOMC member Kashkari speaks at 6.20pm GMT+1.
Levels to watch/live orders:
- Buys: Flat (stop loss: N/A).
- Sells: Flat (stop loss: N/A).
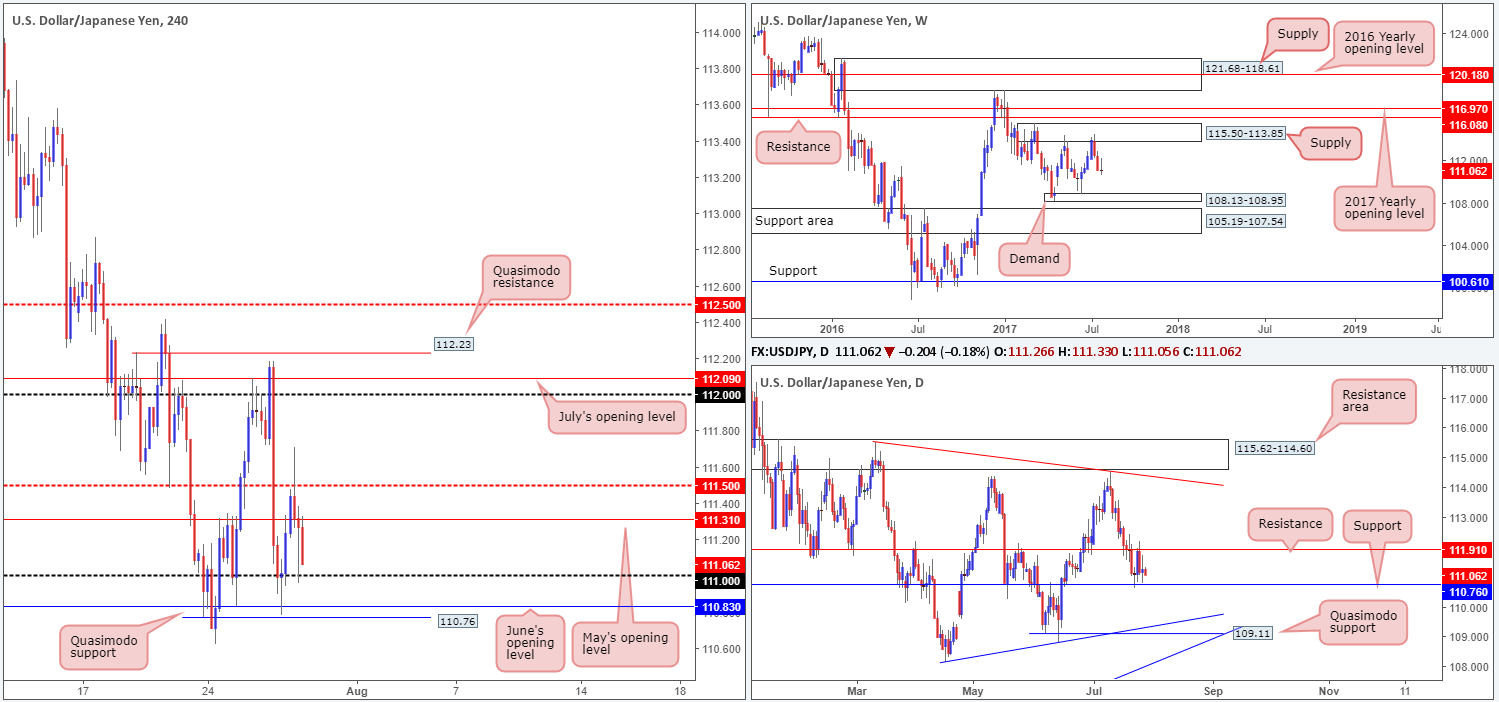
USD/JPY:
For those who read Thursday’s report, you may recall that our team placed a pending buy order at 110.77. As you can see, the order came within a pip of being filled before the market turned in our desired direction! Well done to any of our readers who managed to get on board with this one.
Despite yesterday’s movement, there’s been little change in the overall structure of this market, hence the daily indecision candle recently printed. Weekly price continues to range between supply at 115.50-113.85 and demand at 108.13-108.95. In addition to this, daily flow is also still seen sandwiched between support coming in at 110.76 and resistance at 111.91.
Our suggestions: Personally, there is very little that interests us at the moment. Stop-loss orders have likely all been squeezed below 111 and the buy orders from the H4 Quasimodo support at 110.76/June’s opening level at 110.83 have also likely been consumed. Why not sell then? Good question! The simple reason we are not willing sellers here is due to the daily support at 110.76! Given its history, it is very difficult to judge whether this level is on the verge of giving way or not. It is just not worth the risk, in our humble opinion.
Data points to consider: US Advance GDP figures q/q at 1.30pm, FOMC member Kashkari speaks at 6.20pm GMT+1.

Levels to watch/live orders:
- Buys: Flat (stop loss: N/A).
- Sells: Flat (stop loss: N/A).
USD/CAD:
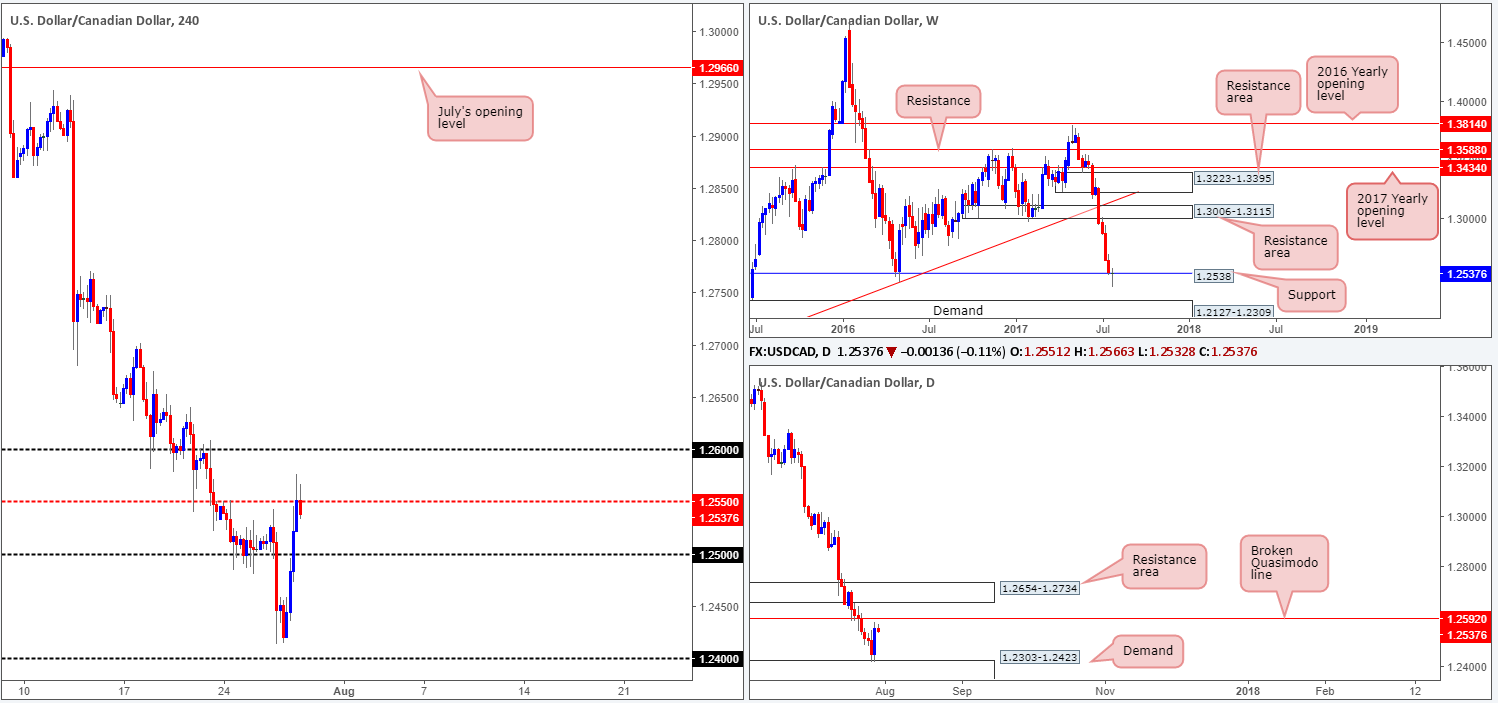
In recent trading, we’ve seen the current weekly candle begin to chalk in a fairly substantial buying tail. Should this market remain bid today and end the week closing back above the nearby weekly support level at 1.2538, this may suggest that the bulls could be attempting to make a play here. As you can see from the daily chart, the recent advance was helped by demand pegged at 1.2303-1.2423, which has consequently now placed the pair within striking distance of a broken Quasimodo line coming in at 1.2592.
Thursday’s advance saw H4 action run through offers at the 1.25 handle and connect with the mid-level resistance at 1.2550 going into the closing bell. Until 1.2550 is consumed, it’ll be difficult for the unit to attack the aforesaid daily broken Quasimodo line.
Our suggestions: This pair has been entrenched within a substantial downtrend for almost two months now. As such, yesterday’s bounce to the upside may only be just that: a bounce! Even if the weekly candle closes back above the weekly support level this week, we would need to see both the current daily broken Quasimodo line as well as the daily resistance area at 1.2654-1.2734 taken out, before we become willing buyers.
We feel that the daily broken Quasimodo line at 1.2592, coupled with the nearby 1.26 handle, will likely hold this market lower today, therefore a trade from here is an option. Waiting for additional confirmation, however, is strongly advised, since if weekly buyers do kick into action from the current weekly support, being on the wrong side of this move would be a rather painful experience!
Data points to consider: US Advance GDP figures q/q at 1.30pm, FOMC member Kashkari speaks at 6.20pm. Canadian growth data at 1.30pm GMT+1.
Levels to watch/live orders:
- Buys: Flat (Stop loss: N/A).
- Sells: 1.26 region ([waiting for a H4 bear candle to form – preferably a full, or near-full-bodied candle – before pulling the trigger is advised] stop loss: ideally beyond the candle’s wick).
USD/CHF:
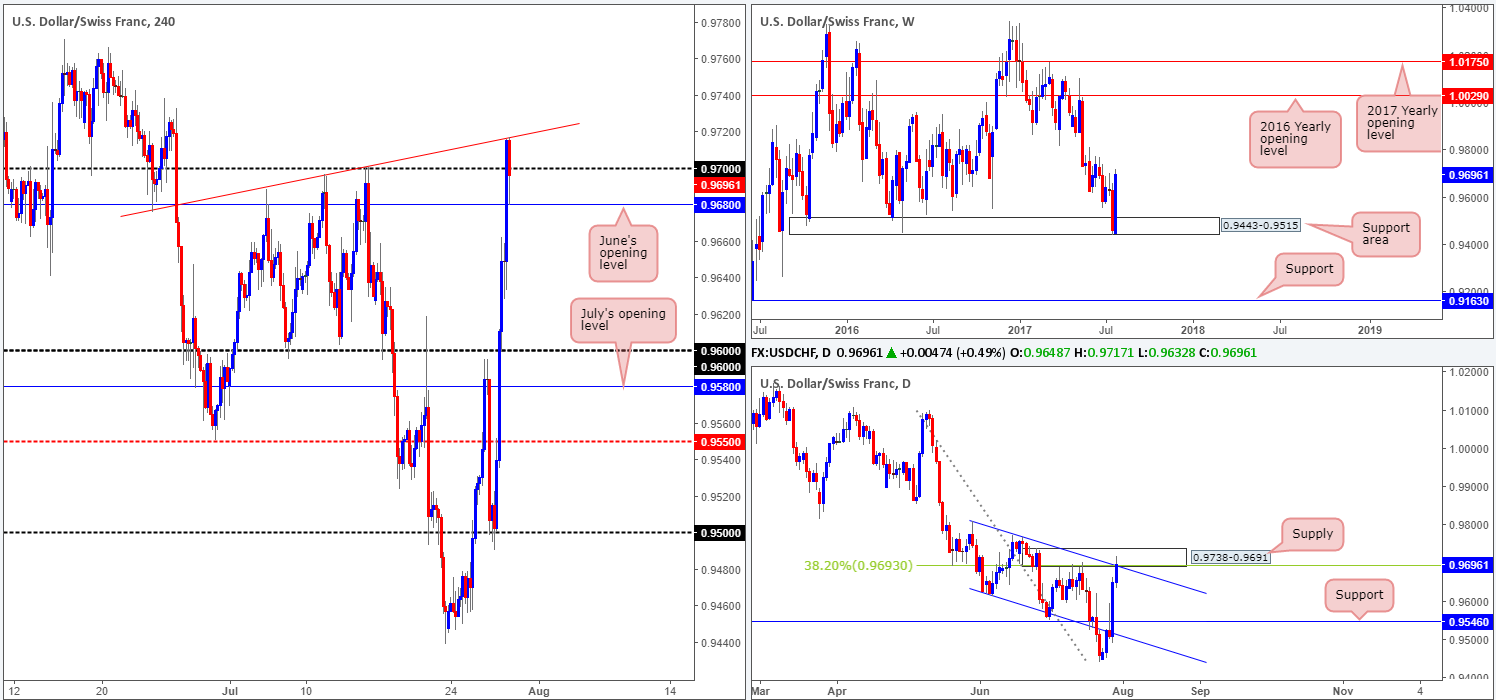
A stronger-than-expected bounce has been seen from the weekly support area at 0.9443-0.9515, consequently forcing daily action to challenge supply at 0.9738-0.9691. This area also happens to converge with a daily channel resistance extended from the high 0.9808 and a daily 38.2% Fib resistance at 0.9693 taken from the high 1.0099.
Although weekly price looks bull strong at the moment, the confluence surrounding the daily supply zone, coupled with H4 price reacting so well off of a minor trendline resistance extended from the low 0.9675 seen positioned just above 0.97, strongly suggests that sellers may make an appearance.
Our suggestions: We have entered short at 0.9694 and placed the stop above the current daily supply at 0.9740, with an overall target objective set at 0.9546: a daily support level. Should the trade come to fruition, this will net over three times our initial risk.
Data points to consider: US Advance GDP figures q/q at 1.30pm, FOMC member Kashkari speaks at 6.20pm GMT+1.
Levels to watch/live orders:
- Buys: Flat (stop loss: N/A).
- Sells: 0.9694 ([live] stop loss: 0.9740).
DOW 30:
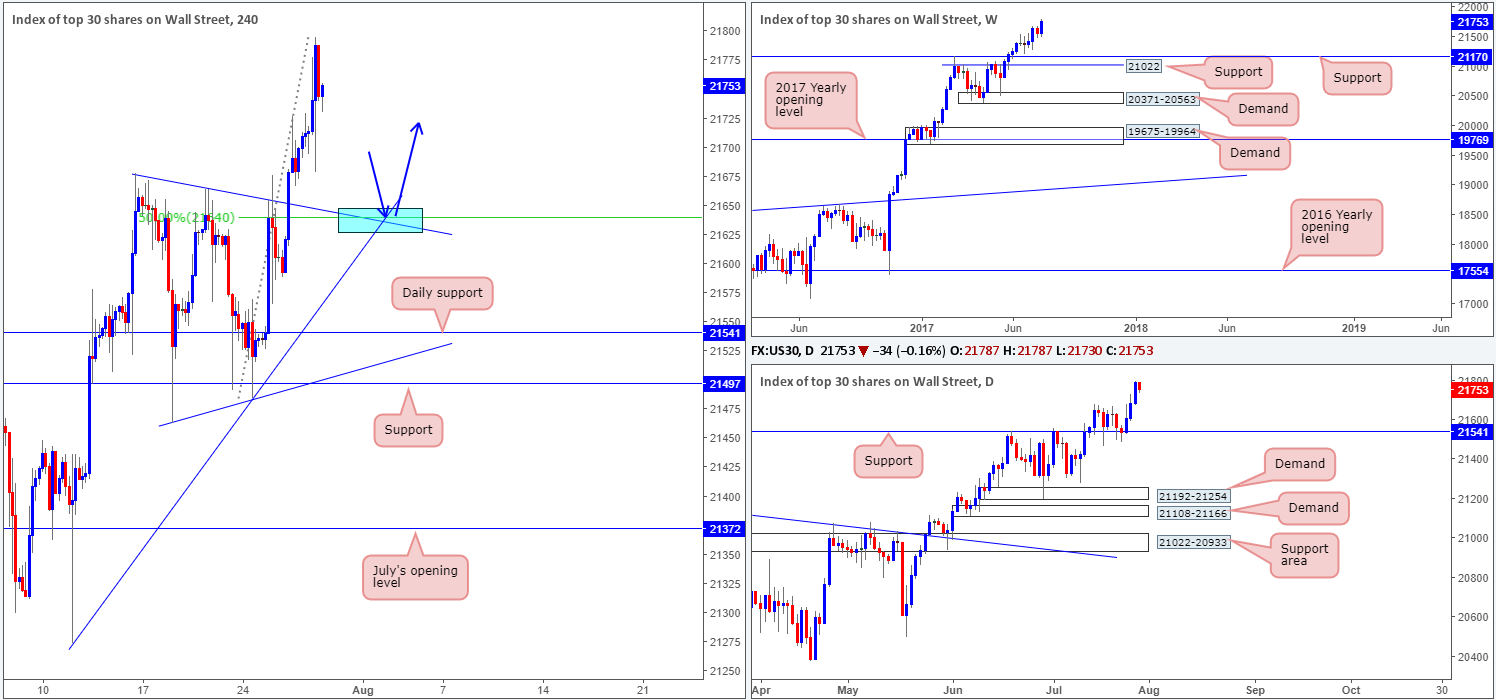
US equities recorded a third consecutive bull candle on Thursday, reaching an all-time high of 21778 on the day. With both the weekly and daily charts showing room for further buying, we are watching for H4 price to pullback and test the 50.0% support value at 21640 extended from the low 21484 for a possible long trade. The reason we like this level is due to it converging closely with two trendline supports – one taken from the low 21273 and the other taken from a high at 21677 (blue area).
Our suggestions: While we expect a bounce to be seen from the aforesaid blue zone, we would not feel comfortable placing pending orders here, since the area is small and therefore susceptible to a fakeout. With that in mind, waiting for a H4 bull candle to form (preferably a full-bodied candle) would be ideal since this would show buyer intent.
Data points to consider: US Advance GDP figures q/q at 1.30pm, FOMC member Kashkari speaks at 6.20pm GMT+1.
Levels to watch/live orders:
- Buys: Watch for H4 price to retest 21640 ([waiting for a full, or near-full-bodied H4 bull candle to form following the retest is advised] stop loss: ideally beyond the candle’s tail).
- Sells: Flat (stop loss: N/A).
GOLD:
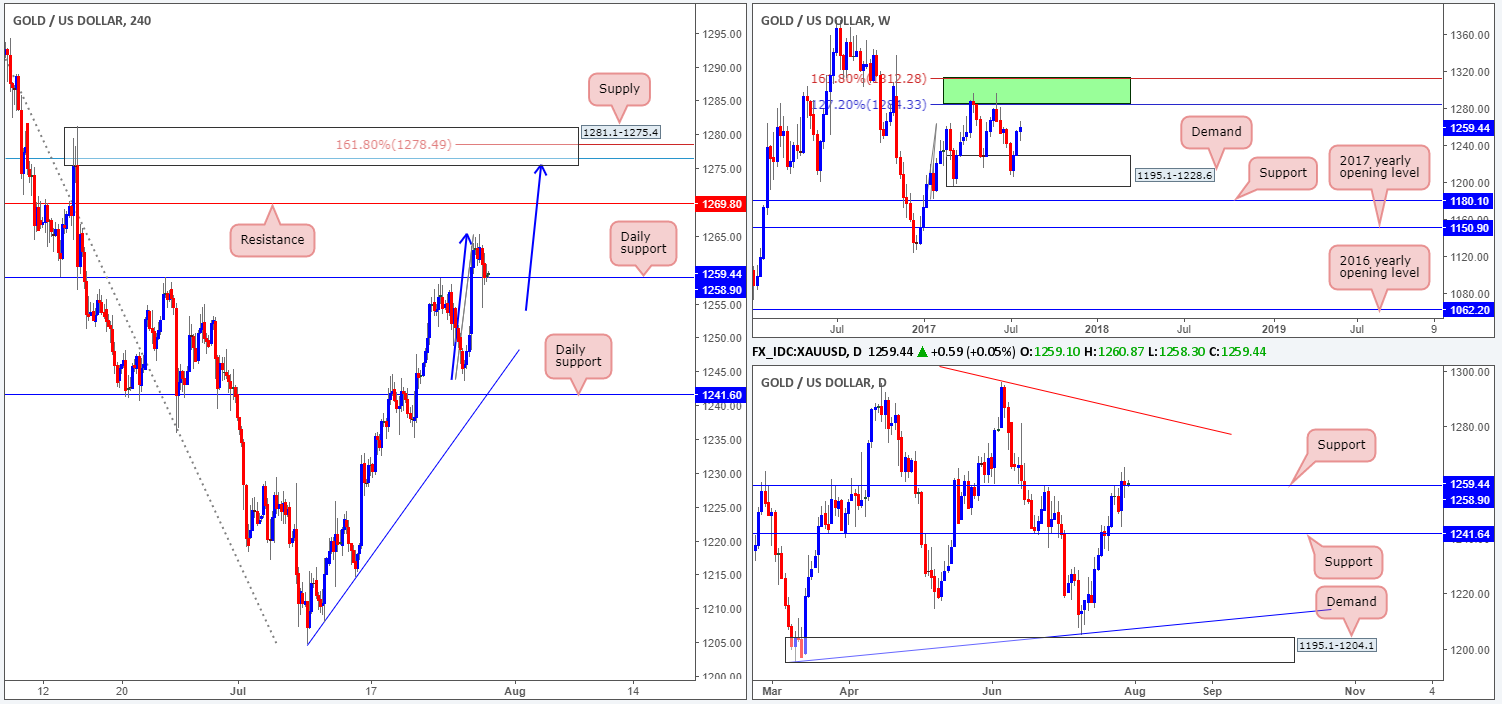
In recent trading, the yellow metal topped at a high of 1265.2 and retested daily support at 1258.9, which for the time being is holding firm. Should this level remain in play, the next area of interest on the H4 chart can be seen at 1269.8 (resistance), followed closely by supply at 1281.1-1275.4.
With daily price remaining afloat above support and weekly flow showing room to extend north as far as the area comprised of two Fibonacci extensions 161.8/127.2% at 1312.2/1284.3 taken from the low 1188.1 (green zone), we would not really feel comfortable selling at the H4 resistance mentioned above at 1269.8. The H4 supply above on the other hand, is interesting. Although it equally boasts little higher-timeframe structure, it does have potential for a bounce. Encased within the area is a H4 AB=CD (blue arrows) 161.8% Fib ext. at 1278.4 drawn from the low 1243.6, and a H4 78.6% Fib resistance at 1276.5 taken from the high 1296.0.
Our suggestions: Despite the confluence, we would strongly recommend waiting for additional candle confirmation to form from the current H4 supply, before pulling the trigger, as we are effectively trading against higher-timeframe flow here.
Levels to watch/live orders:
- Buys: Flat (stop loss: N/A).
- Sells: 1281.1-1275.4 ([waiting for a full, or near-full-bodied H4 bear candle to form is advised] stop loss: ideally beyond the candle’s wick).


