
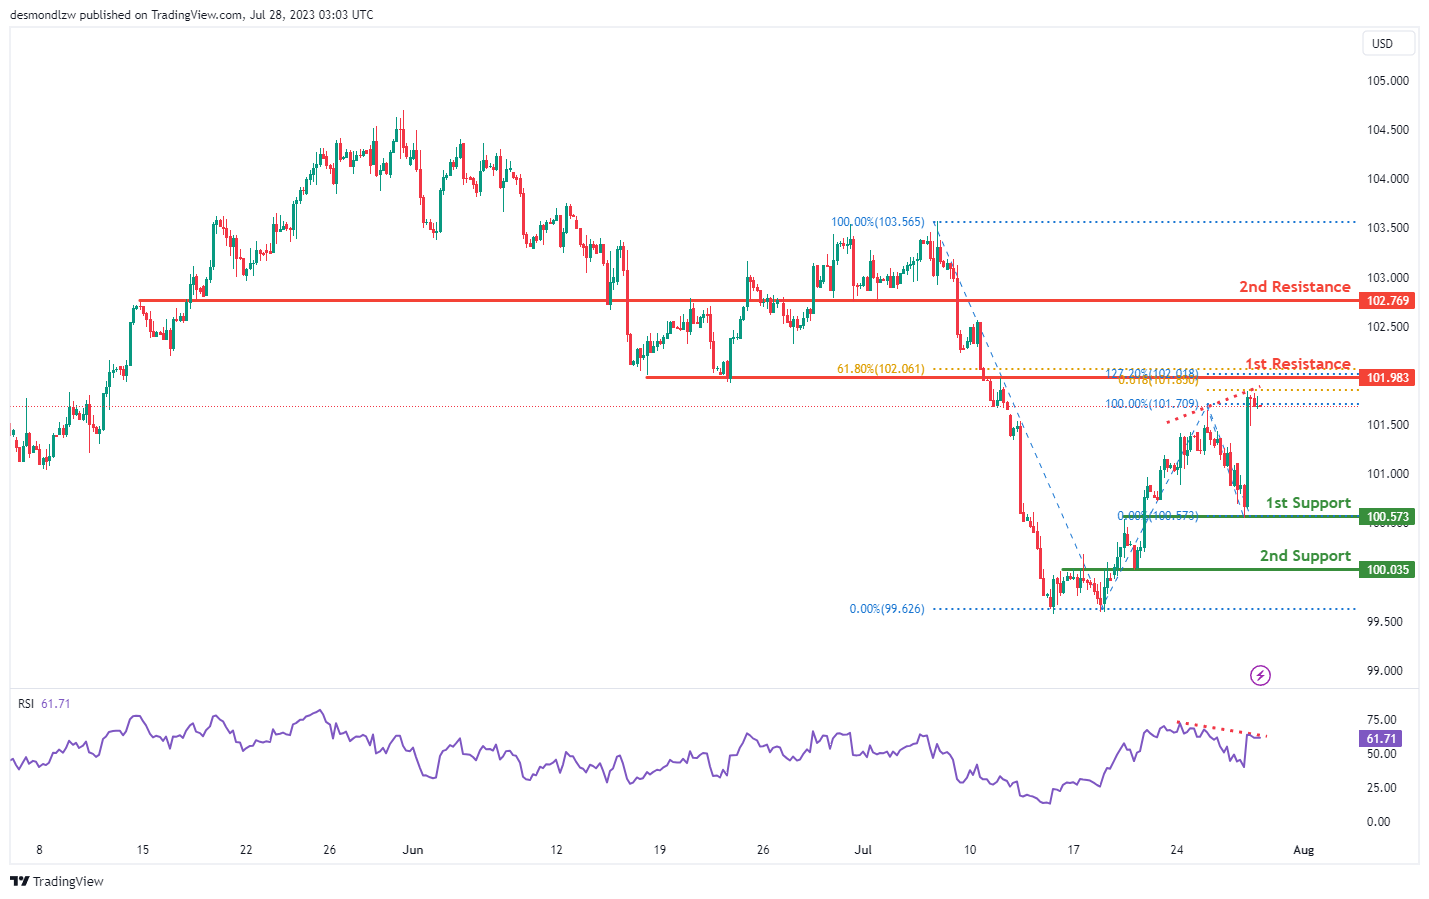
DXY:
The U.S. Dollar Index (DXY) exhibits an overall bearish momentum and may potentially see a bearish reaction off the 1st resistance at 101.98, a level that is significant due to its alignment with the 61.8% Fibonacci retracement and is at the 127.2% Fibonacci extension, indicating a strong Fibonacci confluence. If this reaction occurs, the price may drop to the 1st support at 100.57, which is an overlap support level. The 2nd support level is at 100.03, another overlap that could reinforce the price floor. The 2nd resistance level is identified at 102.76, acting as a potential cap to upward movement due to its function as a pullback resistance. Notably, the Relative Strength Index (RSI) displays a bearish divergence against the price, suggesting that the bullish momentum may be weakening and a bearish price action could soon ensue.
EUR/USD:
The EUR/USD currency pair exhibits a bullish momentum, with the price currently positioned above a major ascending trend line, indicating potential further bullish momentum. A potential scenario could be a bullish bounce off the 1st support level at 1.0975, moving towards the 1st resistance level. The 1st support level is significant because it aligns with the 50% Fibonacci retracement and the 78.6% Fibonacci projection, presenting a Fibonacci confluence. The 2nd support level is at 1.0882, which matches the 100% Fibonacci projection and the 61.8% Fibonacci retracement, indicating another Fibonacci confluence.
On the upside, the 1st resistance level is found at 1.1022, serving as a pullback resistance. The 2nd resistance is at 1.1146, which marks a swing high resistance.
Worth noting is the Relative Strength Index (RSI) which is displaying bullish divergence versus the price, suggesting that a bullish bounce might occur soon.

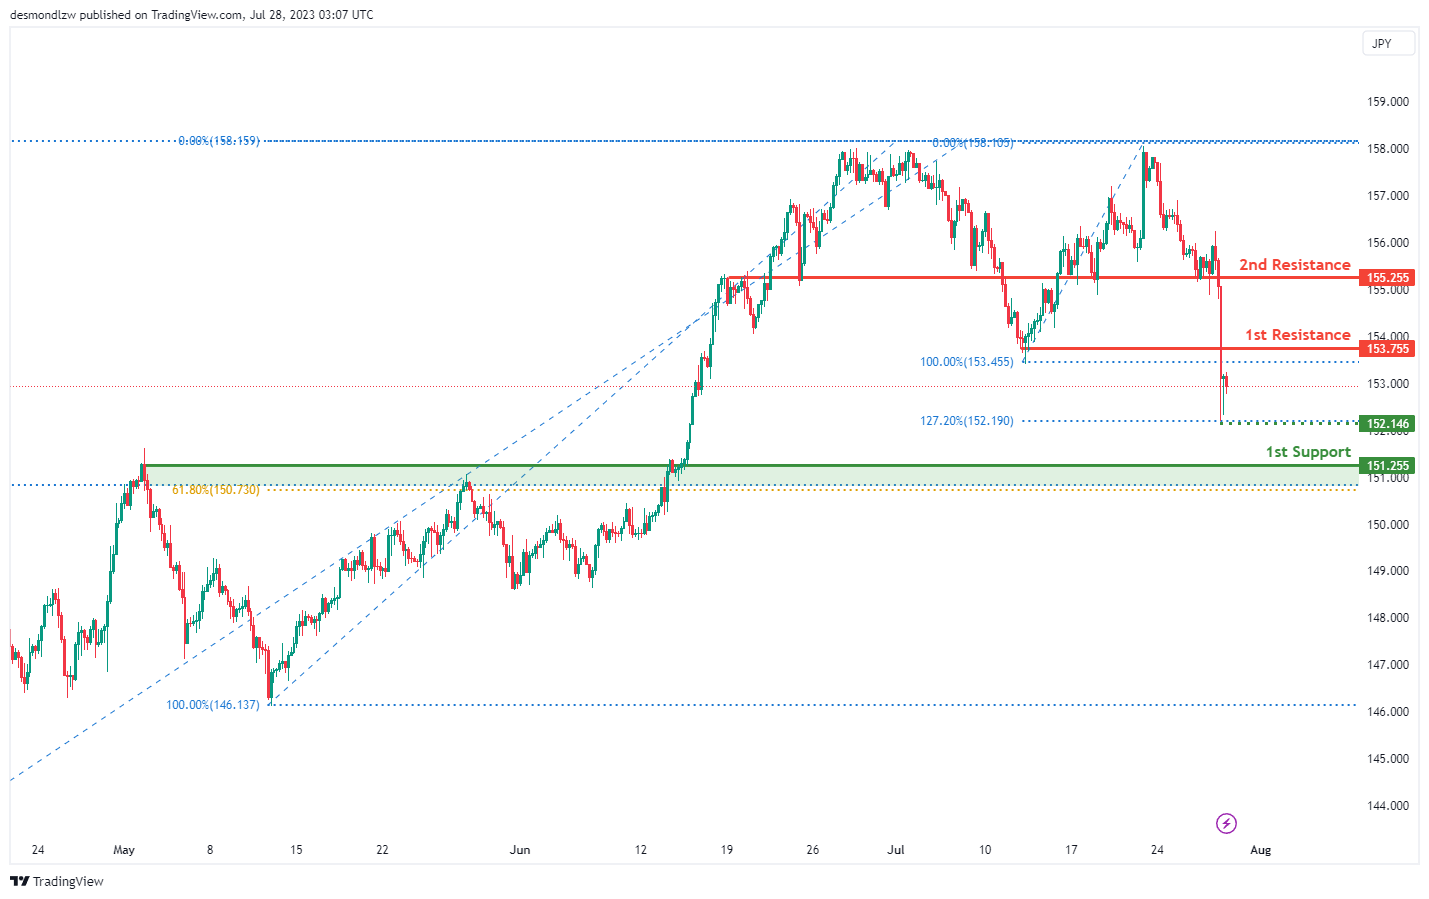
EUR/JPY:
The EUR/JPY currency pair is currently showing a bearish momentum. It’s likely that the price could continue on a bearish trajectory towards the 1st support level at 151.25. This level serves as a pullback support and aligns with the 61.8% Fibonacci retracement, making it a strong potential turning point.
The intermediate support level is at 152.14, marking a swing low support and aligning with the 127.2% Fibonacci extension, providing further potential support for the price.
Looking upwards, the 1st resistance level is at 153.75, acting as a pullback resistance. A further advance in price could meet the 2nd resistance level at 155.25, which also serves as a pullback resistance. Both resistance levels could potentially halt the bullish momentum of the price.
EUR/GBP:
The EUR/GBP currency pair is currently showing bullish momentum. As a result, the price could continue to rise towards the 1st resistance level at 0.8603, which is seen as an overlap resistance.
The 1st support level is at 0.8544, offering a potential floor as it’s a swing low support. If the price falls further, the 2nd support level is at 0.8510, which is seen as a multi-swing low support. Both these levels could potentially halt a bearish momentum in the price.
On the upside, beyond the 1st resistance, there is a 2nd resistance level at 0.8510, acting as a multi-swing high resistance. This level could potentially impede further price increases.

GBP/USD:
The GBP/USD currency pair presently demonstrates a bearish trend. It’s currently positioned below a significant descending trend line, suggesting that there might be a potential extension of the bearish momentum.
The price is likely to continue its bearish course towards the 1st support level, which is situated at 1.2755. This level is considered a key overlap support, which may potentially halt the price decline in the short term.
If the bearish momentum continues to persist and the price breaches the 1st support, the 2nd support level at 1.2591, which is another overlap support, could provide an additional level of security against a continued downtrend.
On the upside, if a reversal in momentum occurs, the 1st resistance level to watch is at 1.2838, which is categorized as a pullback resistance. This could provide an initial obstacle to any bullish movement.
Further up, the 2nd resistance level is observed at 1.2996. This level, known as a swing high resistance, could prove to be a substantial challenge to the price advancement.

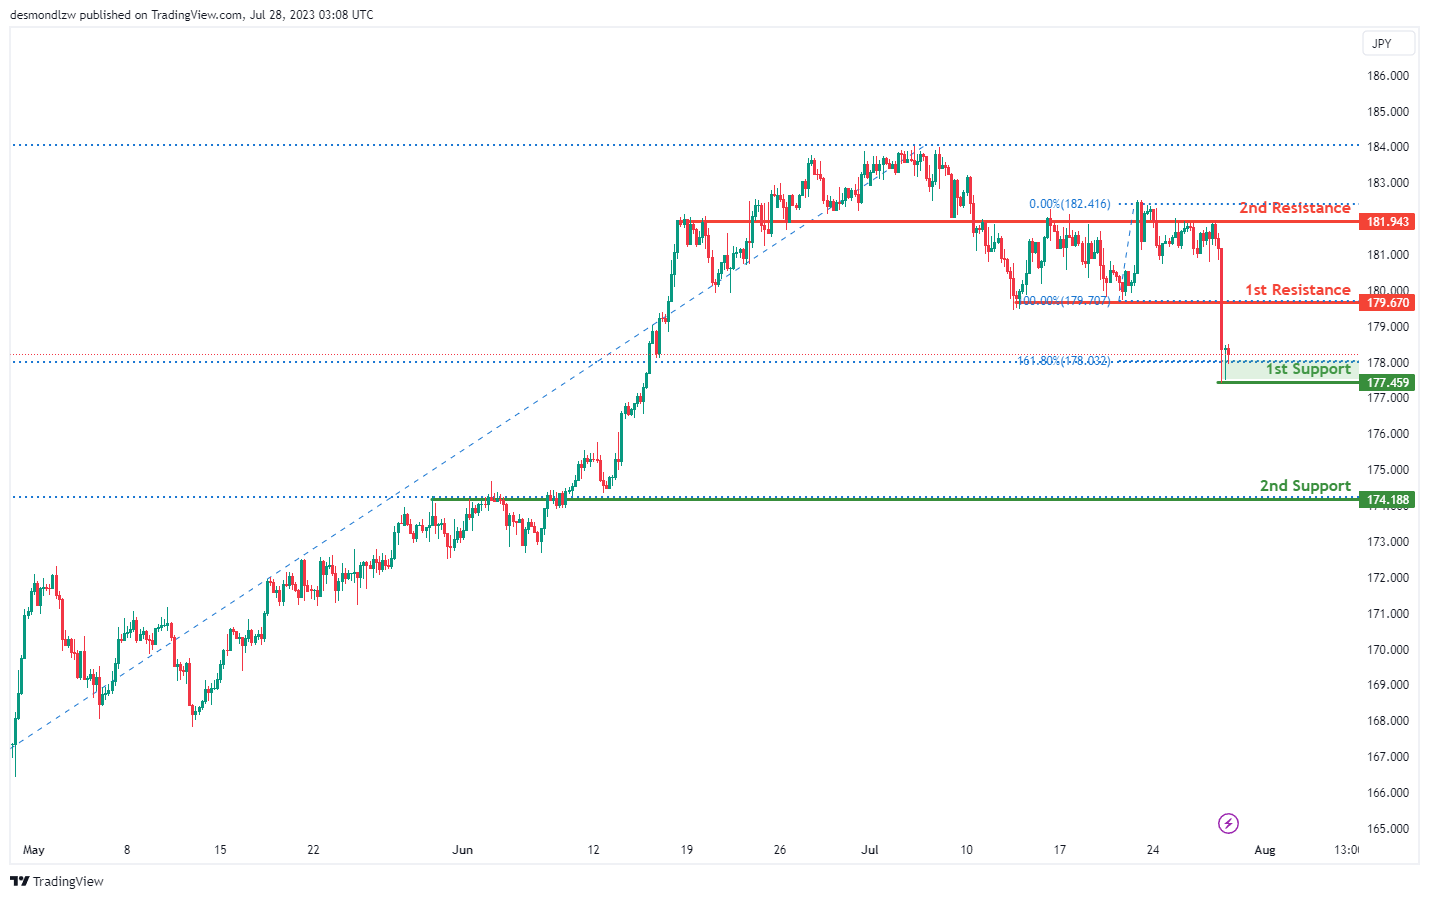
GBP/JPY:
The GBP/JPY currency pair currently exhibits a bullish momentum. Given this dynamic, the price might bounce off the 1st support and make a move towards the 1st resistance.
The 1st support level is at 177.45 and it stands out due to its historical significance as a multi-swing low support. The support level also coincides with the 161.80% Fibonacci Extension and the 23.60% Fibonacci Retracement, indicating a Fibonacci confluence, which could provide a robust foundation for price support.
Should the price break below this level, the 2nd support comes into play at 174.18. This level serves as an overlap support and aligns with the 38.20% Fibonacci Retracement, which could provide additional defence against a more significant price decline.
On the upside, the initial hurdle for any bullish movement is the 1st resistance at 179.67, which is categorised as a pullback resistance.
Further up, the 2nd resistance is found at 181.94. This overlap resistance could pose a considerable challenge to the upward price movement.
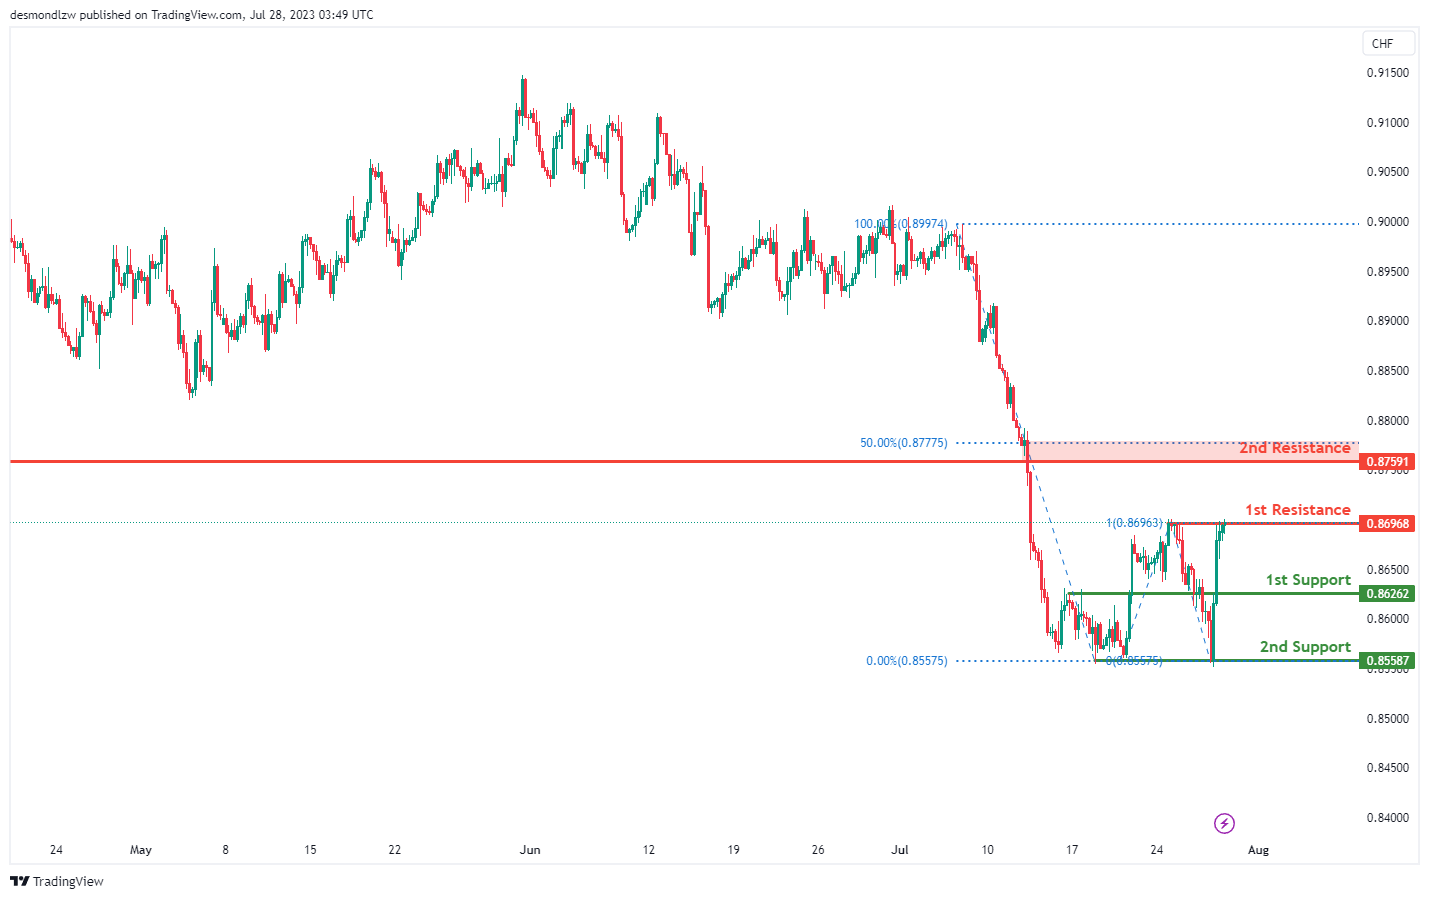
USD/CHF:
The USD/CHF currency pair is currently experiencing a bearish momentum. As such, it’s anticipated that we might see a bearish reaction off the 1st resistance level leading to a decline towards the 1st support level.
The 1st support level is identified at 0.8626, recognized as a pullback support. This area could provide a certain level of stabilization for the price in case of a downward movement.
If the price goes further down, the 2nd support is at 0.8558. This level has been acting as a multi-swing low support, indicating that it is a significant barrier that could potentially hinder further price depreciation.
On the upside, the 1st resistance level is at 0.8696. This level has acted as a multi-swing high resistance and aligns with the 100% Fibonacci Projection, reinforcing its importance.
Should the price manage to break above this, the 2nd resistance level at 0.8759 comes into play. This level functions as a pullback resistance and coincides with the 50% Fibonacci Retracement, making it a significant hurdle for the price to overcome.
USD/JPY:
The USD/JPY currency pair is currently experiencing a bullish momentum. Traders can expect a potential bullish bounce off the 1st support level, leading the price towards the 1st resistance level.
The 1st support level is at 139.01, which is considered a significant level due to its nature as an overlap support, combined with its alignment with the 61.80% Fibonacci retracement level. This position indicates that the price may experience a bounce at this point.
In case the price breaks below this level, the 2nd support at 137.67, another overlap support, becomes relevant. This level could further halt the bearish progression.
On the upside, the 1st resistance level is at 141.26, which has served as a multi-swing high resistance in the past and aligns with the 61.80% Fibonacci projection. This level can be seen as a potential barrier to bullish progression.
If the price manages to surpass this level, the next target is the 2nd resistance at 143.15. This level aligns with the 78.60% Fibonacci retracement and the -27% Fibonacci expansion, indicating a Fibonacci confluence, which underscores its significance as a potential barrier.

USD/CAD:
The USD/CAD chart demonstrates a bearish momentum, suggesting a potential bearish reaction off the 1st resistance level at 1.3242, which is identified as an overlap resistance.
In case of a downward movement, the 1st support at 1.3189 holds significance as it aligns with multiple factors of Fibonacci levels. These factors include being a pullback support that coincides with both the 61.80% Fibonacci retracement and the 61.80% projection levels, indicating a Fibonacci confluence. This convergence of Fibonacci levels strengthens the support’s significance.
On the upside, if the bearish reaction persists, the 2nd resistance at 1.3274 represents another important level to watch. It is identified as both an overlap resistance and coincides with the 61.80% Fibonacci retracement level, indicating its potential significance as a barrier for further upward movement.

AUD/USD:
The AUD/USD chart displays a strong bearish momentum with high confidence, attributed to the price breaking below an ascending support line, indicating a potential bearish move.
A possible scenario is a bearish continuation towards the 1st support level at 0.6655, which is identified as a pullback support that aligns closely with the 78.60% Fibonacci retracement level. Should the bearish trend persist, the 2nd support at 0.6598 represents another significant level, acting as an overlap support.
On the upside, if there is any corrective move, the 1st resistance at 0.6716 is a crucial level to watch, identified as an overlap resistance. Additionally, the 2nd resistance at 0.6736 serves as another important area, acting as an overlap resistance.

NZD/USD
The NZD/USD chart currently demonstrates a weak bullish momentum with low confidence. A potential scenario suggests a further drop towards the 1st support level at 0.6166 in the short term, followed by a bounce from that level leading to an upward movement towards the 1st resistance at 0.6222.
The 1st support at 0.6166 is a significant area, acting as an overlap support. Furthermore, the 2nd support at 0.6108 represents another key level, serving as an overlap support and coinciding with the 61.80% Fibonacci Projection level.
On the upside, the 1st resistance at 0.6222 is a crucial level to watch, identified as an overlap resistance. Additionally, the 2nd resistance at 0.6265 is another important area, acting as a pullback resistance and coinciding with the 38.20% Fibonacci Retracement level.

DJ30:
The DJ30 chart indicates a bearish momentum, suggesting a potential bearish continuation towards the 1st support at 35209.49. This support level is significant as it represents an overlap support, aligned with the 23.60% Fibonacci retracement and the 61.80% Fibonacci projection levels, indicating a Fibonacci confluence.
Moreover, the 2nd support at 34952.22 serves as another important area, acting as an overlap support and coinciding with the 38.20% Fibonacci retracement level.
On the upside, the 1st resistance at 35395.02 is a significant level, representing an overlap resistance. Additionally, the 2nd resistance at 35666.93 is another key area, functioning as an overlap resistance.

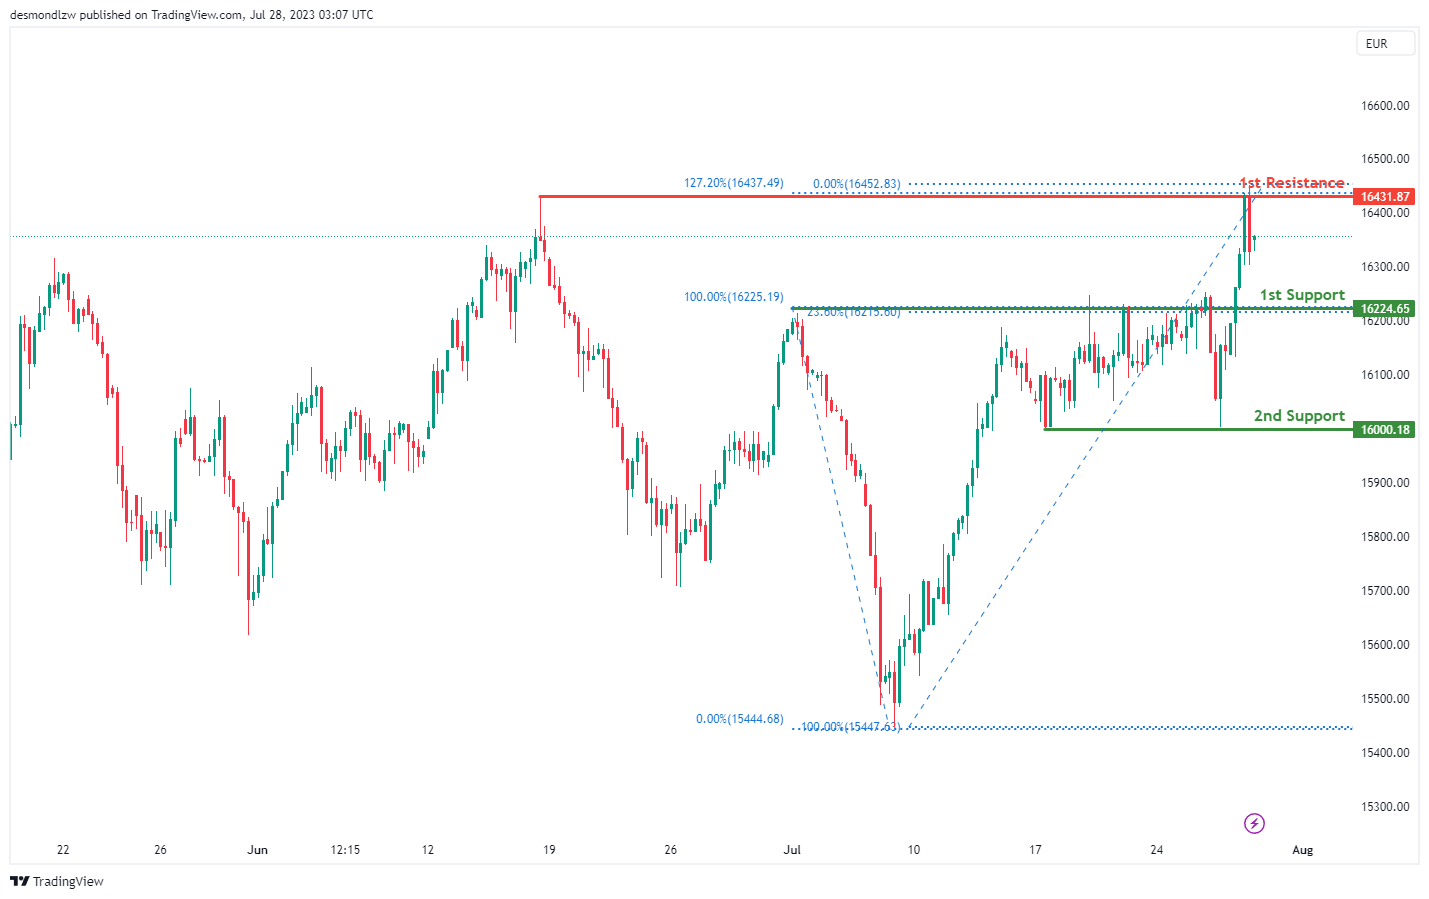
GER30:
The GER30 chart is demonstrating a bullish momentum currently. We anticipate a potential bullish continuation towards the 1st resistance level.
The 1st support level lies at 16224.65, which is a substantial level as it acts as a pullback support and coincides with the 23.60% Fibonacci retracement level. If the price plunges further, the subsequent key level to watch is the 2nd support at 16000.18, which has served as a multi-swing low support in the past.
Looking upwards, the 1st resistance level is positioned at 16431.87. This level is notable as it represents a multi-swing high resistance and is also at the 127.20% Fibonacci extension level.
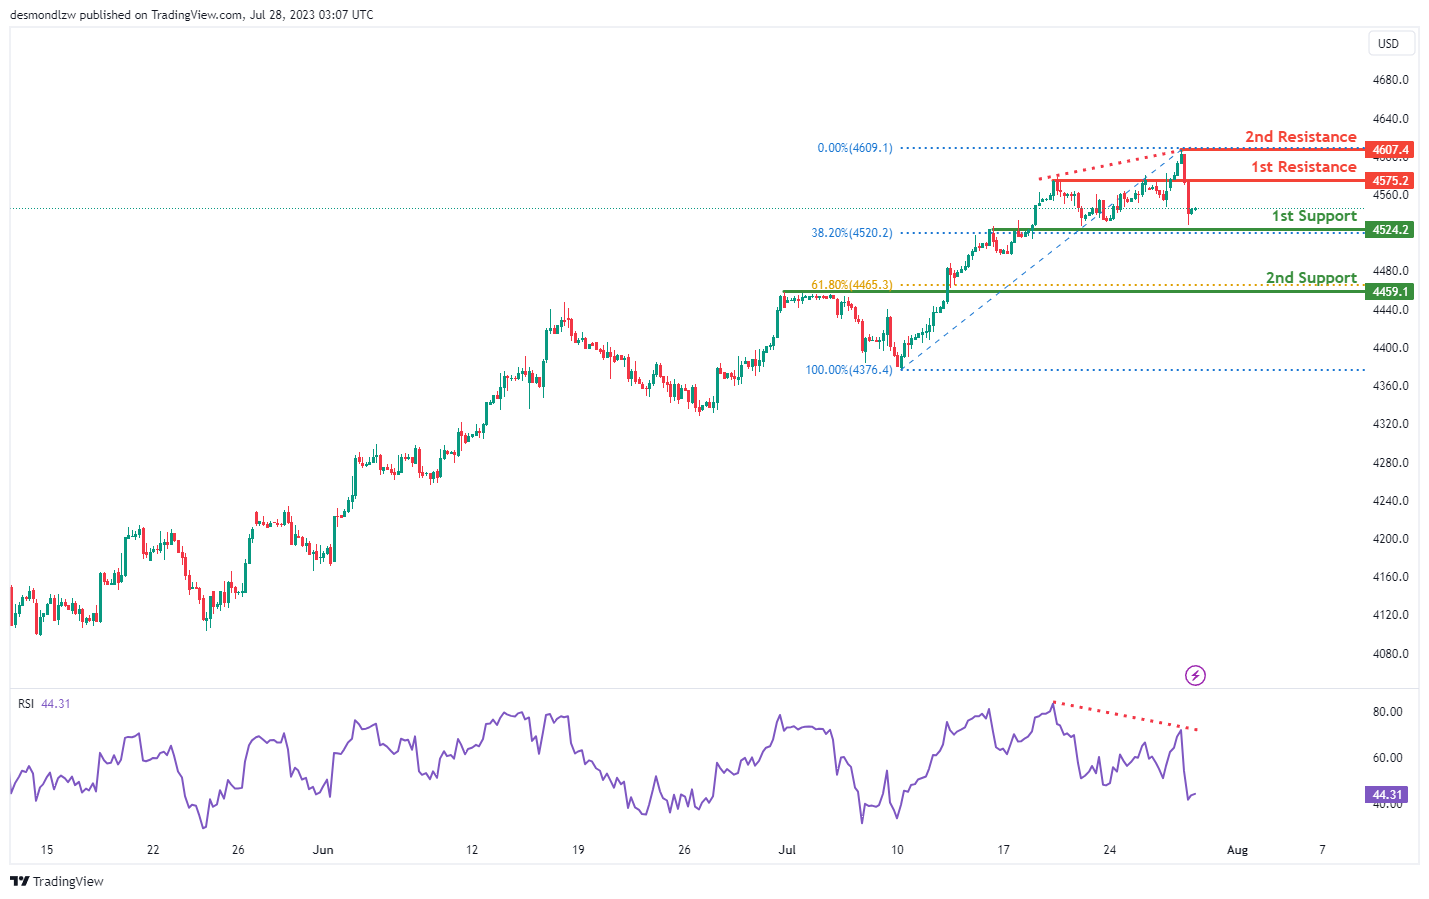
US500
The US500 is currently showing a bearish trend. Despite this, in the short term, we could anticipate a rise towards the 1st resistance level before witnessing a reversal. This potential reversal could send the price dropping towards the 1st support level.
The initial support level is located at 4524.20, which is deemed a solid support due to its dual role as an overlap support and a 38.20% Fibonacci retracement point. If the price continues to drop, the next significant level to observe is the 2nd support at 4459.10. This level is also notable as it is an overlap support and coincides with the 61.80% Fibonacci retracement level.
On the upward trajectory, the 1st resistance level is at 4575.20, acting as a pullback resistance. If the price manages to surpass this, the next key level to watch is the 2nd resistance at 4607.40, which has been a swing high resistance in the past.
Adding to the complexity of the situation, the Relative Strength Index (RSI) is showing a bearish divergence versus the price. This implies that there could be a rapid decline in price in the near future.
BTC/USD:
The BTC/USD chart indicates a bearish momentum, with the price currently within a bearish descending channel, which suggests the potential for further downward movement.
A possible scenario implies a bearish continuation towards the 1st support at 28,427.00. This support level is significant as it represents an overlap support and aligns with the 50% Fibonacci retracement level.
Furthermore, the 2nd support at 27,456.00 serves as another important area acting as an overlap support.
On the upside, the 1st resistance at 29,610.00 is a significant level as it represents an overlap resistance.
Additionally, the 2nd resistance at 30,431.00 is another key area, functioning as an overlap resistance.

ETH/USD:
The ETH/USD chart displays a bearish momentum, with the price currently below the bearish Ichimoku cloud, which indicates the potential for further downward movement.
A possible scenario suggests a bearish continuation towards the 1st support at 1845.80. This support level is significant as it represents an overlap support and aligns with the 61.80% Fibonacci projection level. Furthermore, the 2nd support at 1825.67 serves as another important area, functioning as an overlap support and coinciding with the 100% Fibonacci projection level.
On the upside, the 1st resistance at 1844.96 is a significant level, acting as an overlap resistance. Additionally, the 2nd resistance at 1906.07 is another key area, representing an overlap resistance and aligning with the 38.20% Fibonacci retracement level.

WTI/USD:
The WTI/USD chart currently shows a weak bullish momentum with low confidence. This is attributed to the price being above a major ascending trend line, suggesting the possibility of further bullish movement. However, it’s worth noting that the RSI is displaying bearish divergence versus price, suggesting a potential reversal might occur soon.
A potential scenario indicates a weak bullish continuation towards the 1st resistance at 80.14 which acts as a pullback resistance, coinciding with the 78.60% Fibonacci Retracement and the 61.80% Fibonacci Projection levels, indicating a Fibonacci confluence. Furthermore, the 2nd resistance at 81.62 is another key area, functioning as an overlap resistance and aligning with the 78.60% Fibonacci Projection level.
The 1st support at 78.49 is significant as it represents a pullback support, coinciding with the 23.60% Fibonacci Retracement and the 61.80% Fibonacci Projection levels, indicating a Fibonacci confluence. Additionally, the 2nd support at 76.65 serves as an overlap support.

XAU/USD (GOLD):
The XAU/USD pair, the chart’s overall momentum is bearish. Consequently, we could potentially witness a bearish reaction off the 1st resistance level, which would then cause the price to drop towards the 1st support level.
The 1st support level is located at 1938.31. This level is considered strong due to its dual role as both a pullback support and the 50% Fibonacci retracement level. These indicators suggest a possible price bounce at this point.
If the price breaches this level, the 2nd support at 1928.59 comes into play. This level doubles as an overlap support and the 61.80% Fibonacci retracement level, further enhancing its strength as a potential floor for price action.
Moving upwards, the 1st resistance level is found at 1954.07. This level has functioned as a pullback resistance in the past and could serve as a potential ceiling for price progression.
Beyond this level, the 2nd resistance level sits at 1968.24, which has also served as a pullback resistance previously, making it a significant hurdle for upward price movement.

The accuracy, completeness and timeliness of the information contained on this site cannot be guaranteed. IC Markets does not warranty, guarantee or make any representations, or assume any liability regarding financial results based on the use of the information in the site.
News, views, opinions, recommendations and other information obtained from sources outside of www.icmarkets.com, used in this site are believed to be reliable, but we cannot guarantee their accuracy or completeness. All such information is subject to change at any time without notice. IC Markets assumes no responsibility for the content of any linked site.
The fact that such links may exist does not indicate approval or endorsement of any material contained on any linked site. IC Markets is not liable for any harm caused by the transmission, through accessing the services or information on this site, of a computer virus, or other computer code or programming device that might be used to access, delete, damage, disable, disrupt or otherwise impede in any manner, the operation of the site or of any user’s software, hardware, data or property.


