
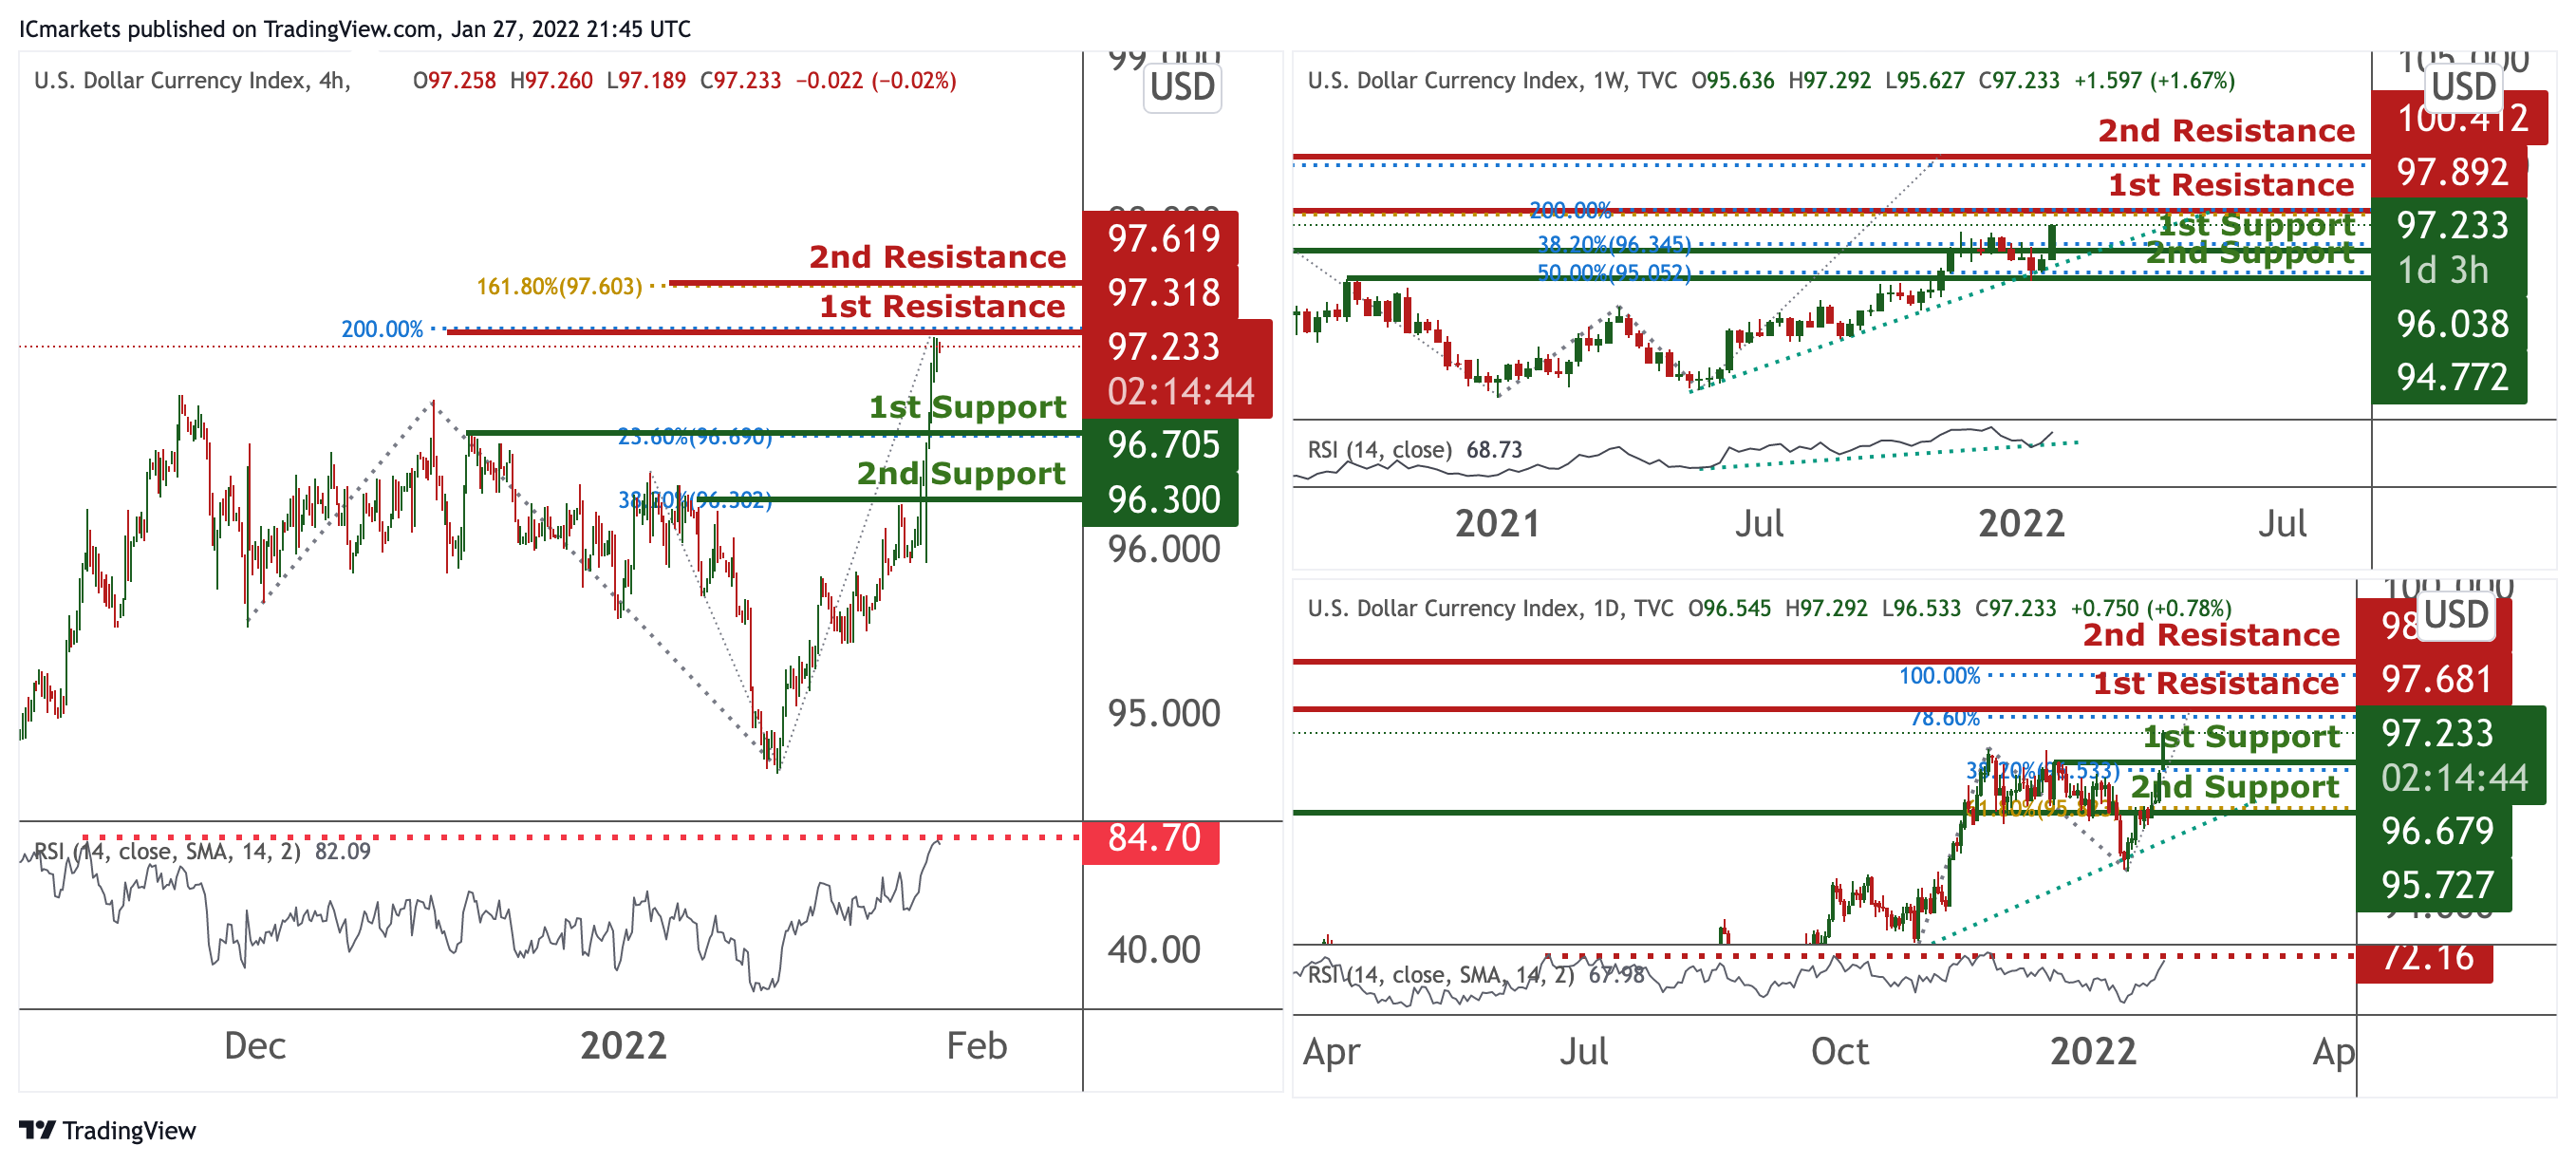
DXY:
On the weekly timeframe, prices were on bullish momentum and abiding to our ascending trendline. We see the potential for a dip from our 1st resistance at 97.892 in line with 200% Fibonacci projection towards our 1st support at 97.233 in line with 38.2% Fibonacci retracement. RSI are at levels where dips previously occurred.
On the daily timeframe, prices were on bullish momentum. We see the potential for further upside towards our 1st resistance at 97.681 in line with 78.6% Fibonacci extension towards our 1st support at 96.679 in line with 38.2% Fibonacci retracement. RSI are at levels where dips previously occurred.
On the H4 timeframe, prices are on bullish momentum and have reached an all time high. We would expect potentially a dip from our 1st resistance at 97.319 in line with 200% Fibonacci projection towards our 1st support at 96.705 in line with 23.6% Fibonacci retracement. RSI are at oversold extremes, further supporting our bearish bias.
Areas of consideration:
H4 time frame, 1st resistance at 97.318
H4 time frame, 1st support at 96.705
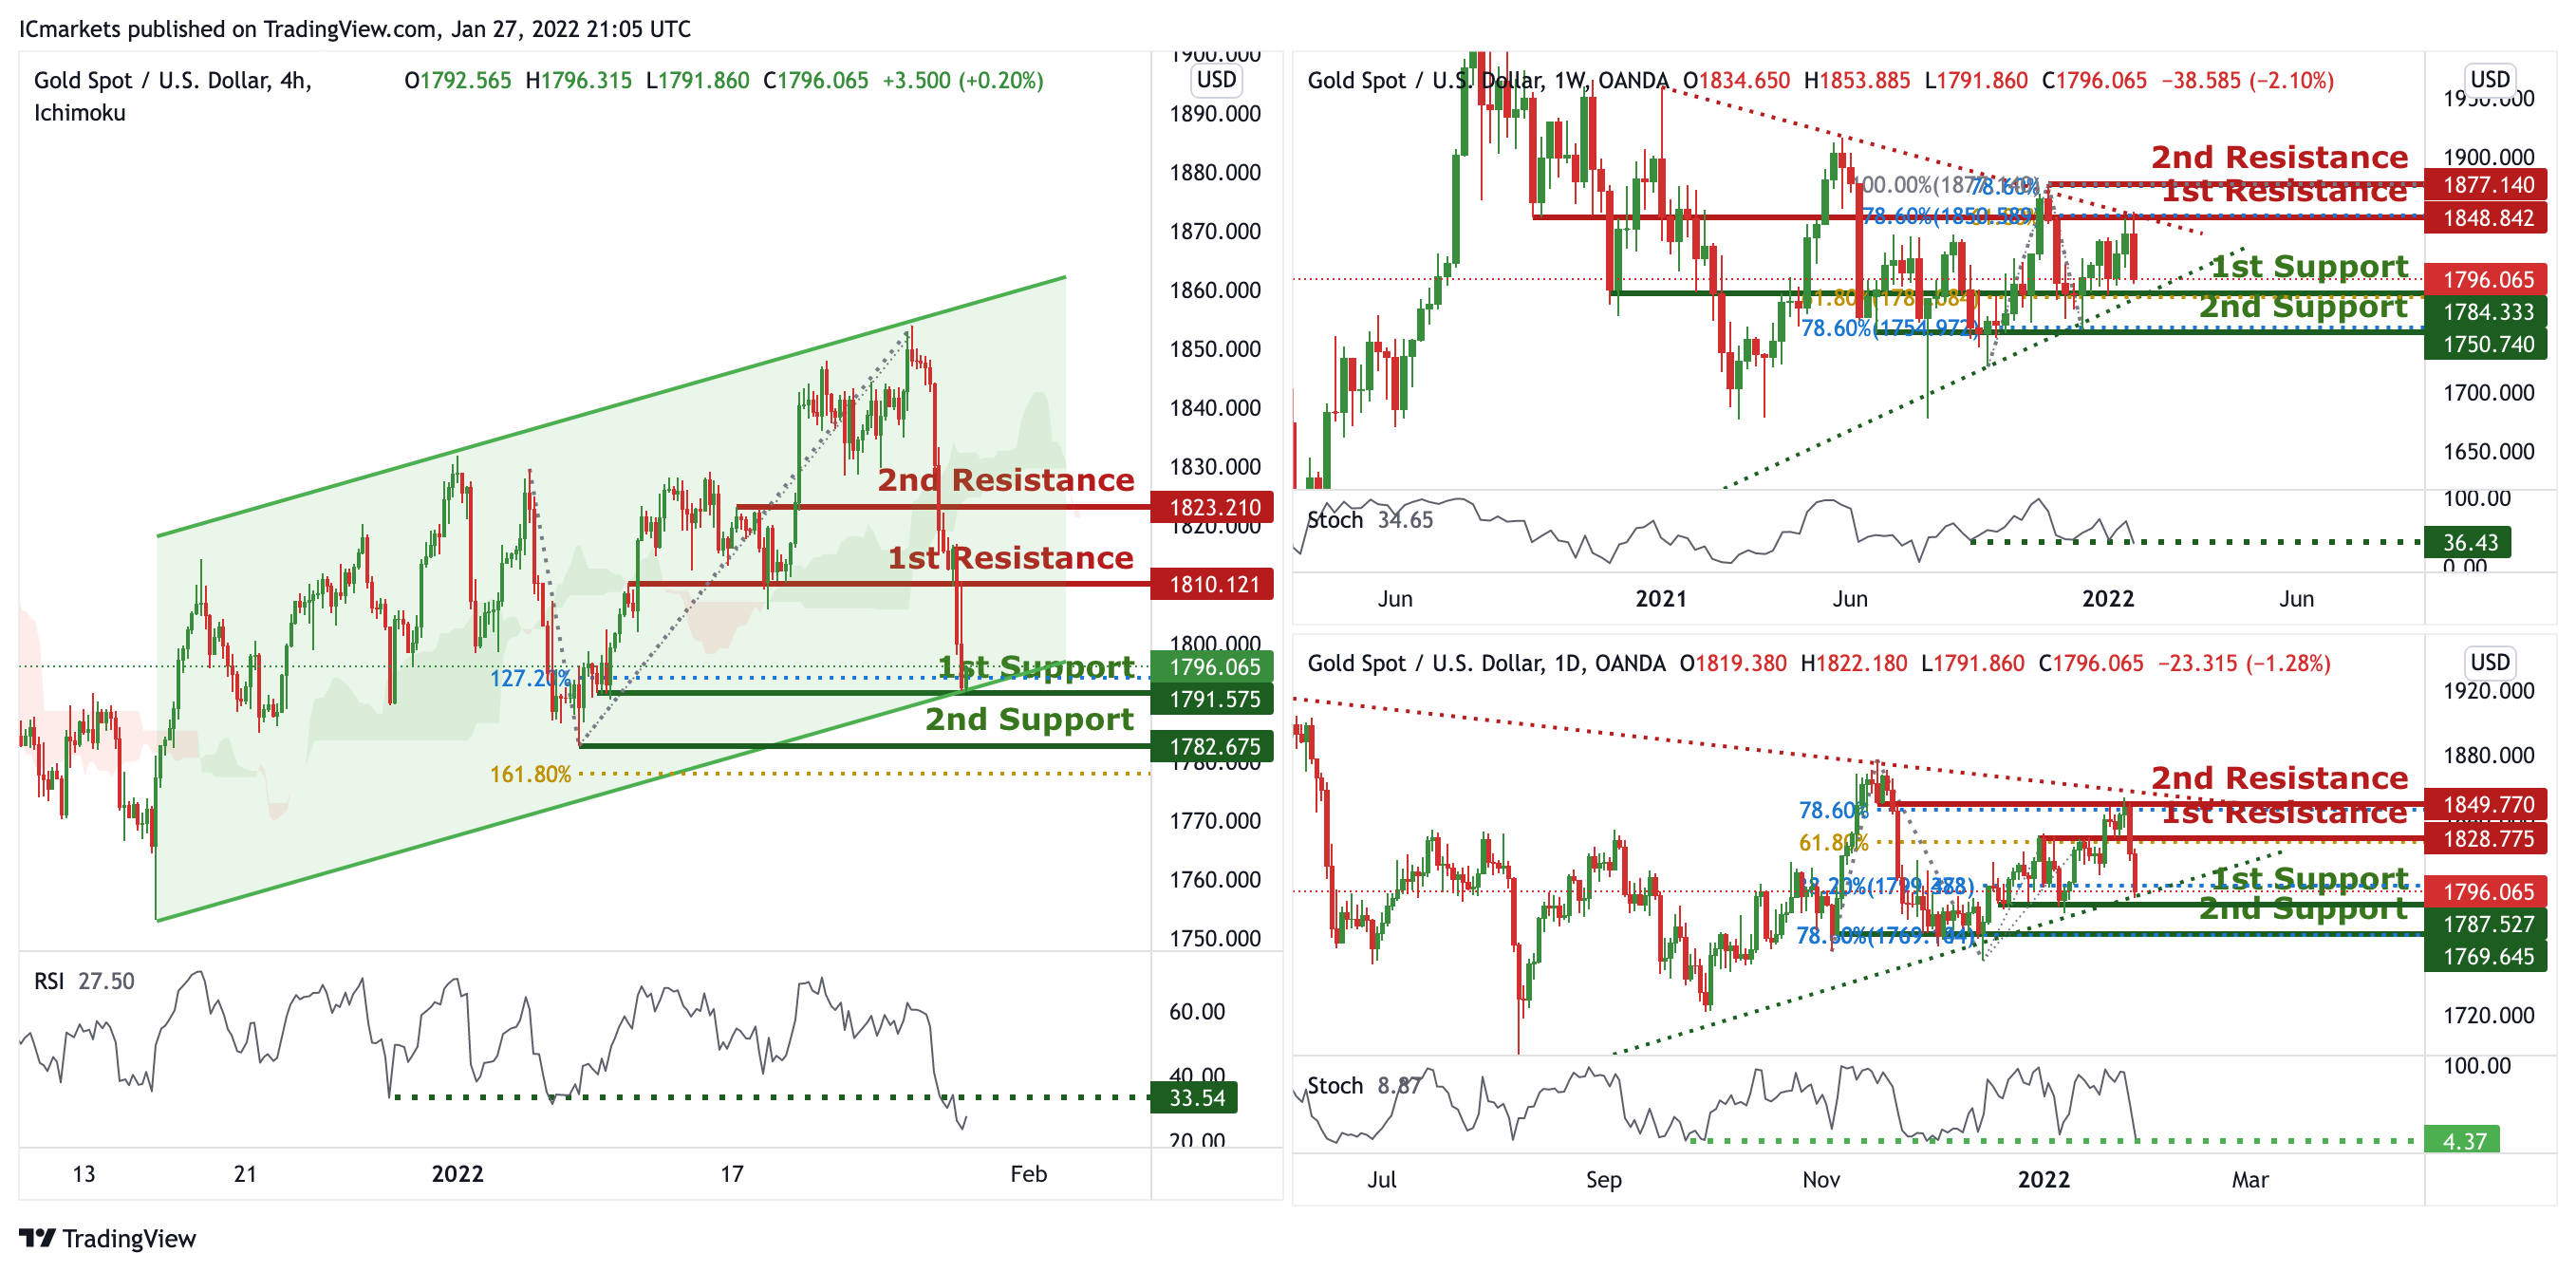
XAU/USD (GOLD):
On the weekly, prices are consolidating in a triangle and are approaching our 1st support. We see the potential for a bounce from our 1st support at 1784.333 in line with 61.8% Fibonacci retracement towards our 1st resistance at 1848.842 in line with 78.6% Fibonacci retracement. RSI are at levels where bounces previously occurred.
On the daily, prices are consolidating in a triangle and are approaching our 1st support. We see the potential for a bounce from our 1st support at 1787.527 in line with 38.2% Fibonacci retracement towards our 1st resistance at 1828.775 in line with 61.8% Fibonacci extension. RSI are at levels where bounces previously occurred.
On the H4 chart, prices are on bullish momentum and consolidating in a parallel channel. We see a potential for a bounce from our 1st support at 1791.575 in line with 127.2% Fibonacci extension towards our 1st resistance at 1810.121 which is a graphical overlap. RSI are at overbought extremes, further supporting our bullish bias.
Areas of consideration:
4h 1st support at 1791.575
4h 1st resistance at 1810.121
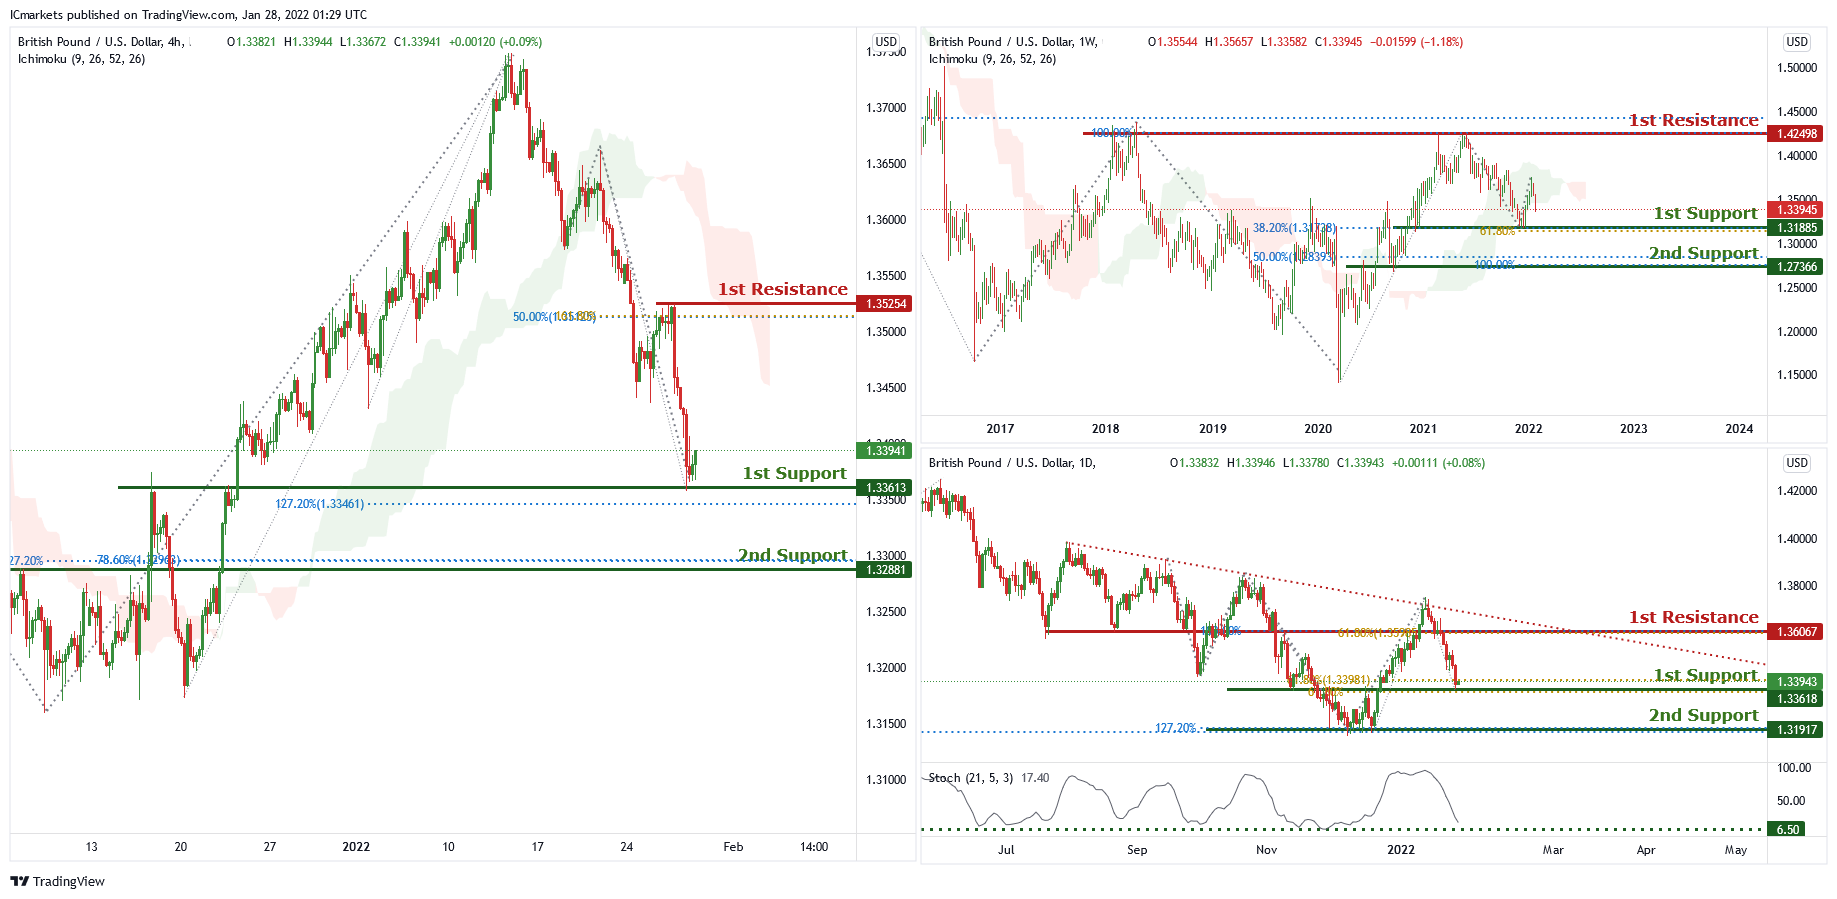
GBP/USD
On the weekly chart , price is near 1st support level of 1.31885 which is also 61.8% Fibonacci projection and 38.2% Fibonacci retracement. Price can potentially go to the 1st resistance level of 1.42498 which is also 100% Fibonacci projection and 50% Fibonacci retracement. Our bullish bias is supported by the ichimoku cloud indicator.
On the daily chart , price is abiding by the descending trendline and near 1st support level of 1.33618 which is also 61.8% Fibonacci retracement and 61.8% Fibonacci projection. Price can potentially experience a short bounce to the 1st resistance level of 1.36067 which is also 61.8% Fibonacci retracement and 100% Fibonacci projection. Our bullish bias is supported by the stochastic indicator as it is near support level.
On the H4 chart price is near 1st support level of 1.33613 which is also 127.2% Fibonacci retracement. Price can potentially bounce to the 1st resistance level of 1.35254 which is also 50% Fibonacci retracement and 161.8% Fibonacci projection. Our bullish bias is supported by the stochastic indicator as it is at support level.
Areas of consideration:
- H4 1st resistance 1.35254
- H4 1st support 1.33613
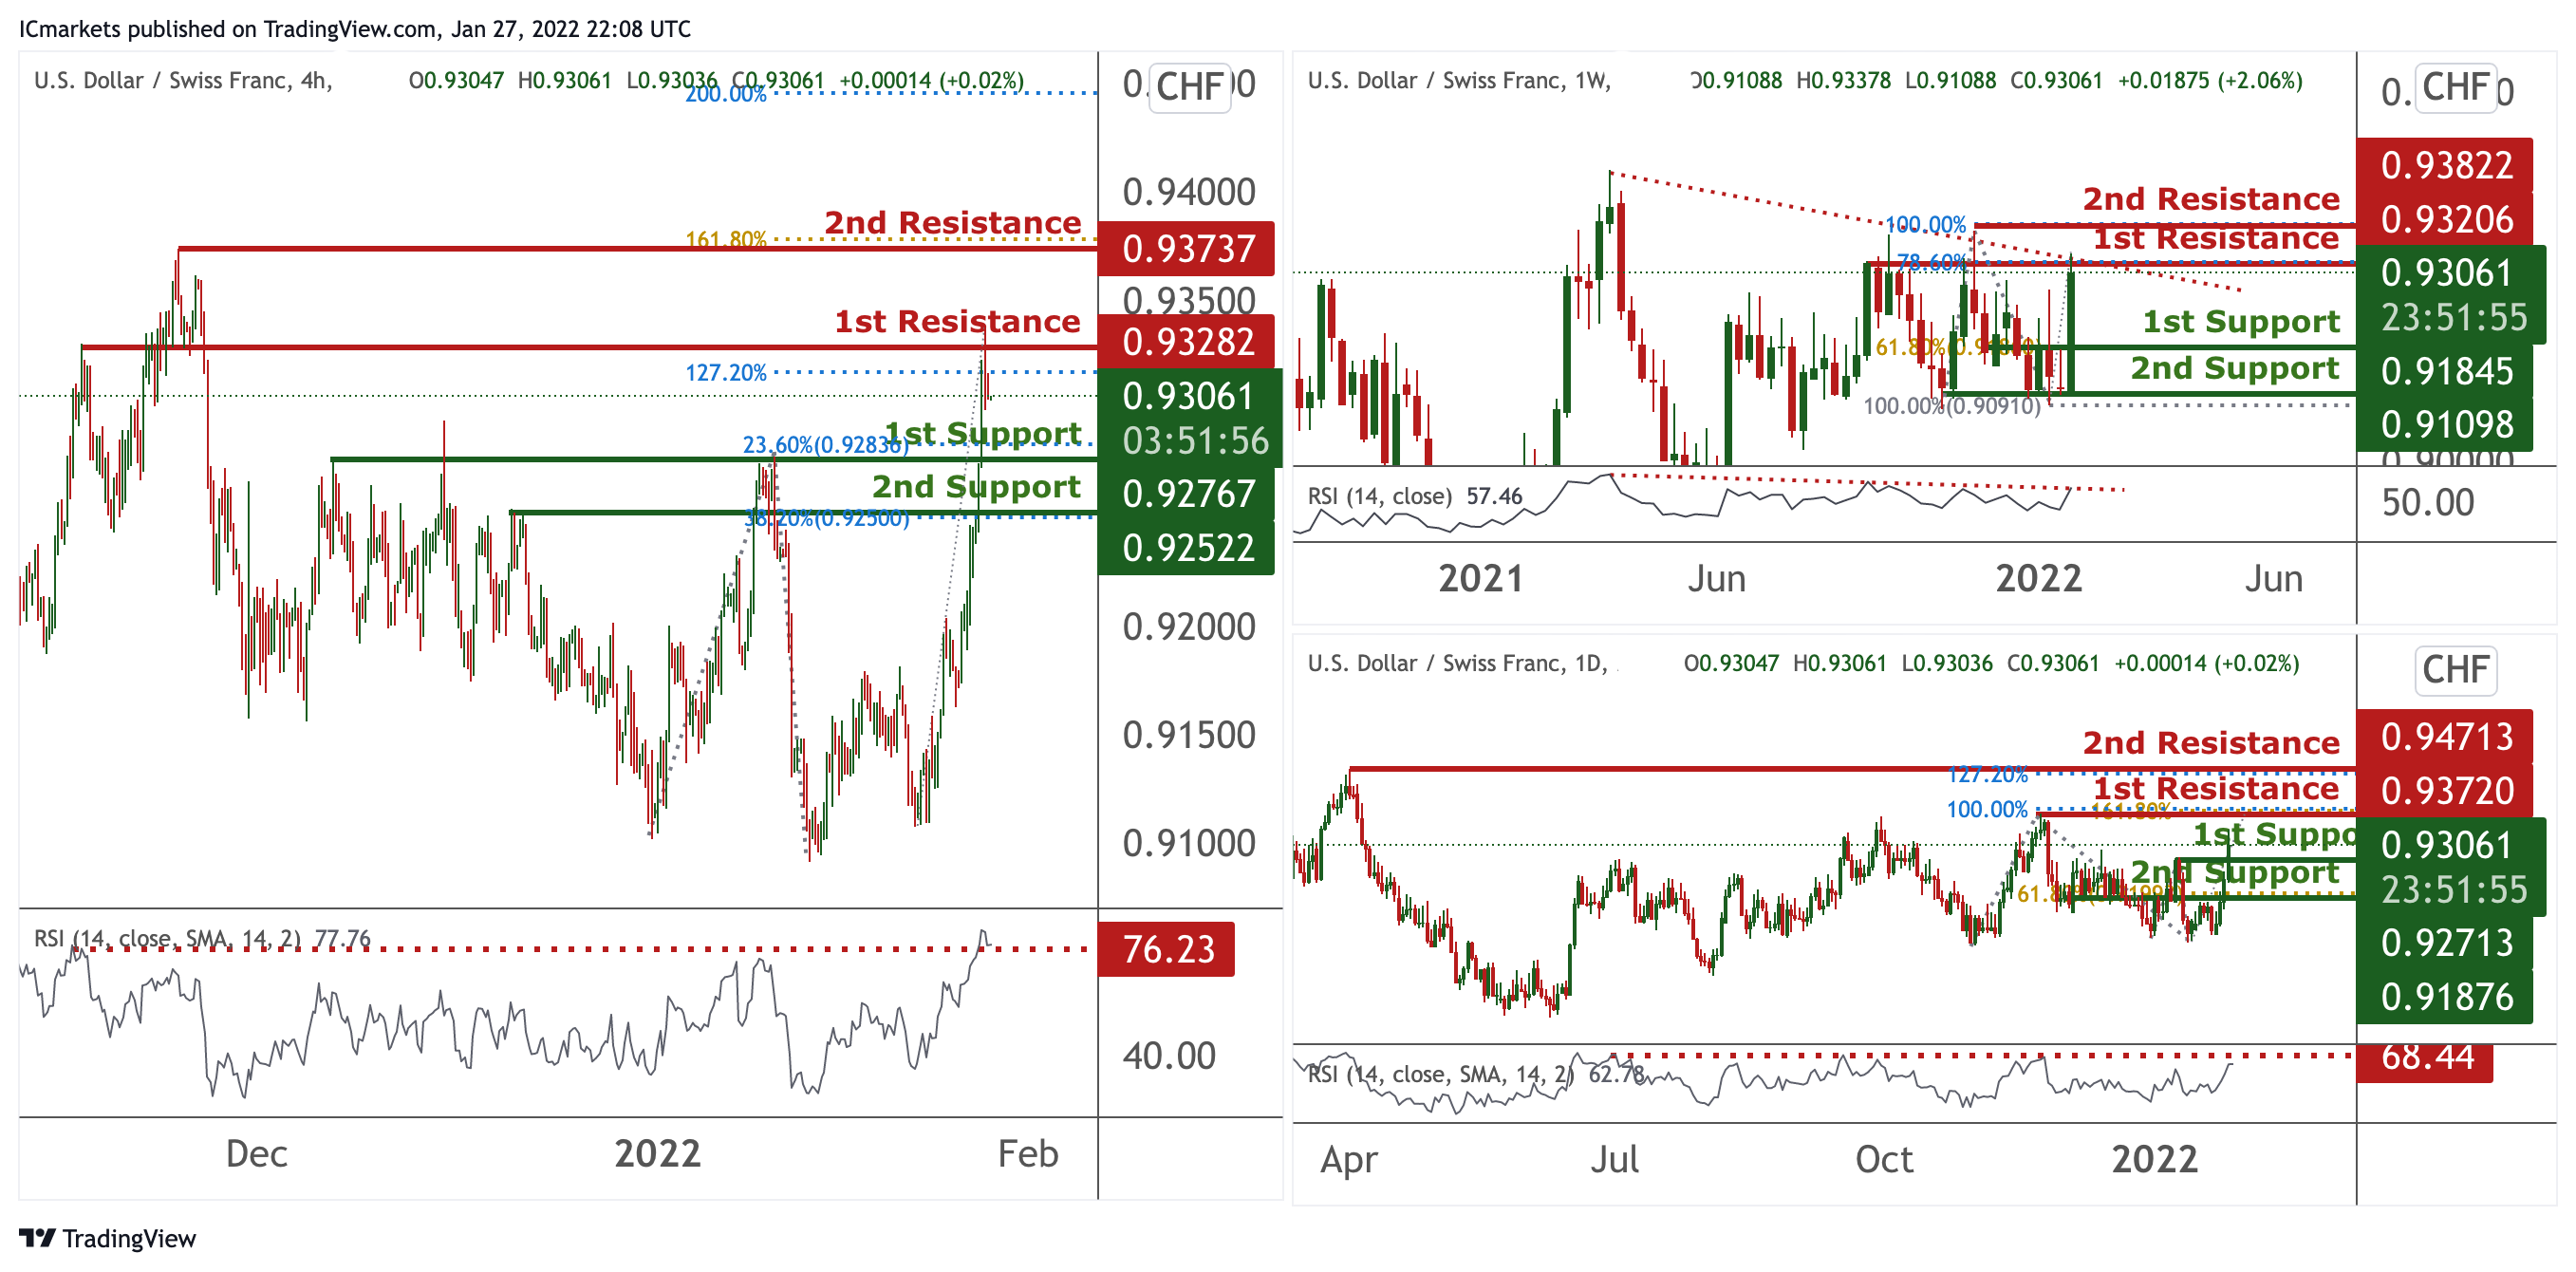
USD/CHF:
On the weekly, prices are on bearish momentum and abiding to our descending trendline. We see the potential for a dip from our 1st resistance at 0.93206 in line with 78.6% Fibonacci extension towards our 1st support at 0.91845 in line with 61.8% Fibonacci retracement. RSI is showing bearish momentum.
On the daily chart, prices are hovering in between 2 levels. We see the potential for a dip if prices approaches our 1st resistance at 0.93720 in line with 100% Fibonacci extension towards our 1st support at 0.92713 which is a graphical overlap. RSI are at levels where dips previously occurred.
On the H4 timeframe, prices were on bullish momentum and are at a pivot. We see the potential for a dip from our 1st resistance at 0.93282 in line with 127.2% Fibonacci extension towards our 1st support at 0.92767 in line with 23.6% Fibonacci retracement. RSI is at levels where dips previously occurred.
Areas of consideration:
- Watch 1st Support at 0.90961
- Watch 1st Resistance at 0.91967
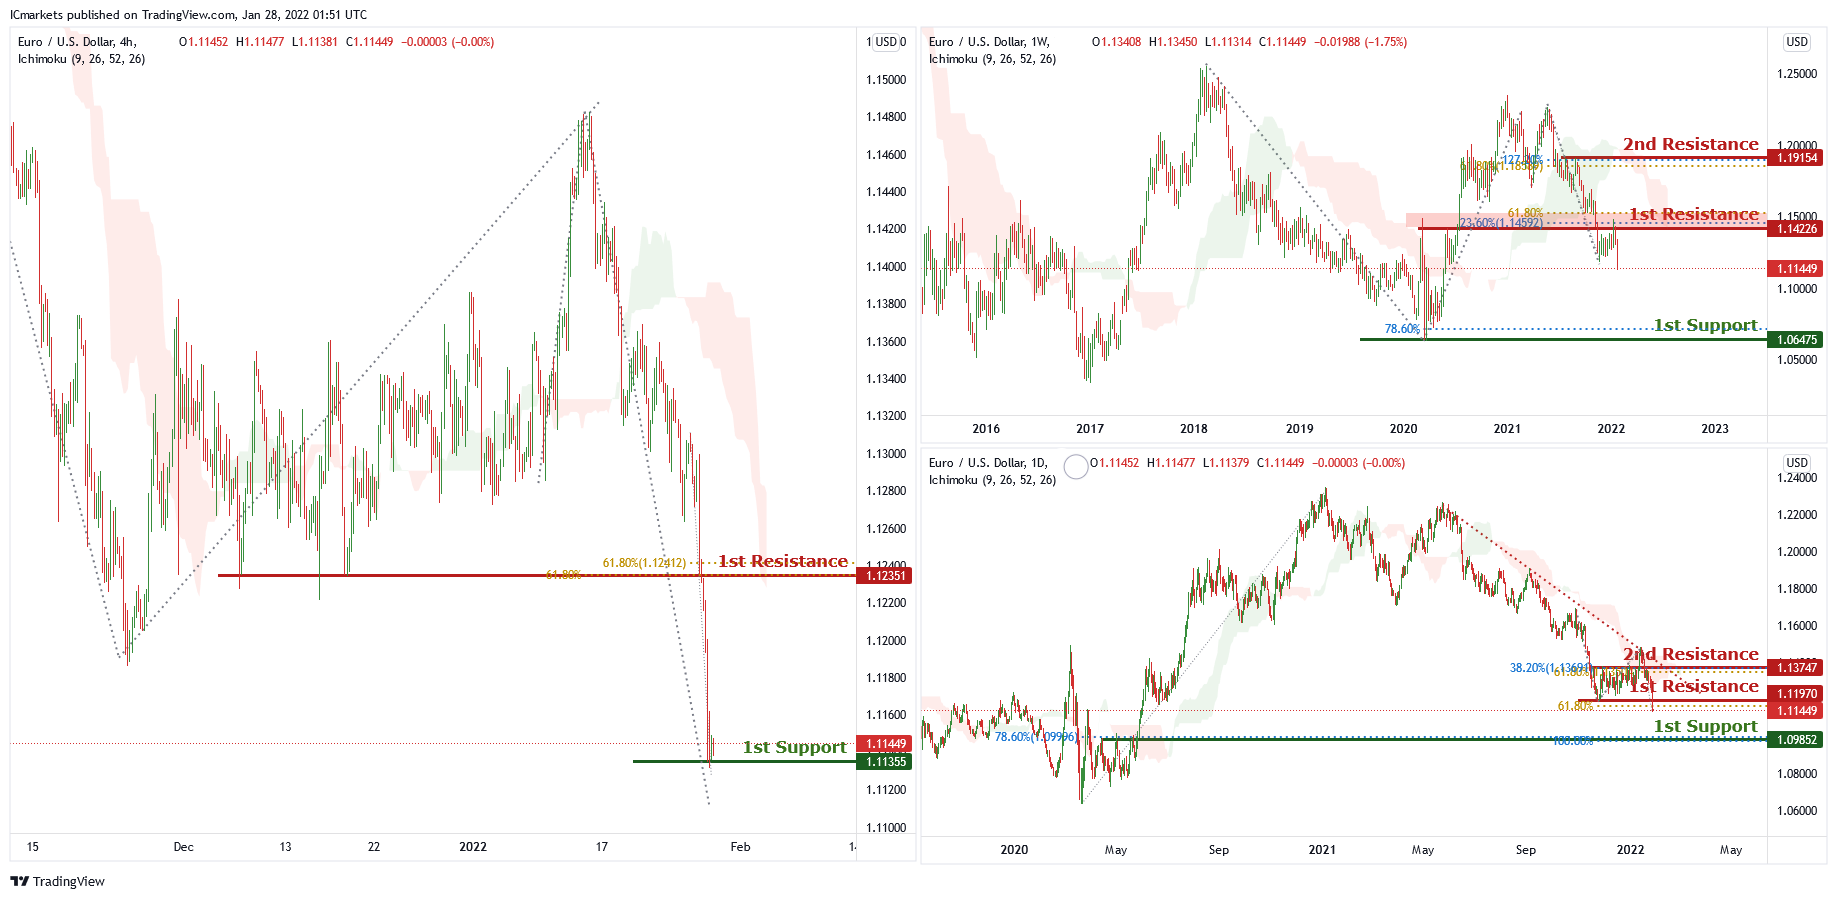
EUR/USD :
On the weekly chart , price is near 1st resistance level of 1.14226 which is also 23.6% Fibonacci retracement and 61.8% Fibonacci projection. Price can potentially dip to the 1st support level of 1.06475 which is also 78.6% Fibonacci projection and graphical swing low. Our bearish bias is supported by the ichimoku cloud indicator as price is trading below it.
On the daily chart, price is near 1st resistance level of 1.11970 which is also 61.8% Fibonacci projection. Price can potentially dip to the 1st support level of 1.09852 which is also 100% Fibonacci projection and 78.6% Fibonacci retracement. Our bearish bias is supported by the ichimoku cloud indicator as price is trading below it.
On the H4 chart price is near 1st support level of 1.11355 which is the graphical swing low. Price can potentially bounce to the 1st resistance level of 1.12351 which is also 61.8% Fibonacci projection and 61.8% Fibonacci retracement. Our bullish bias is supported by technical indicators.
Areas of consideration :
- H4 1st resistance at 1.12351
- H4 1st support at 1.11355
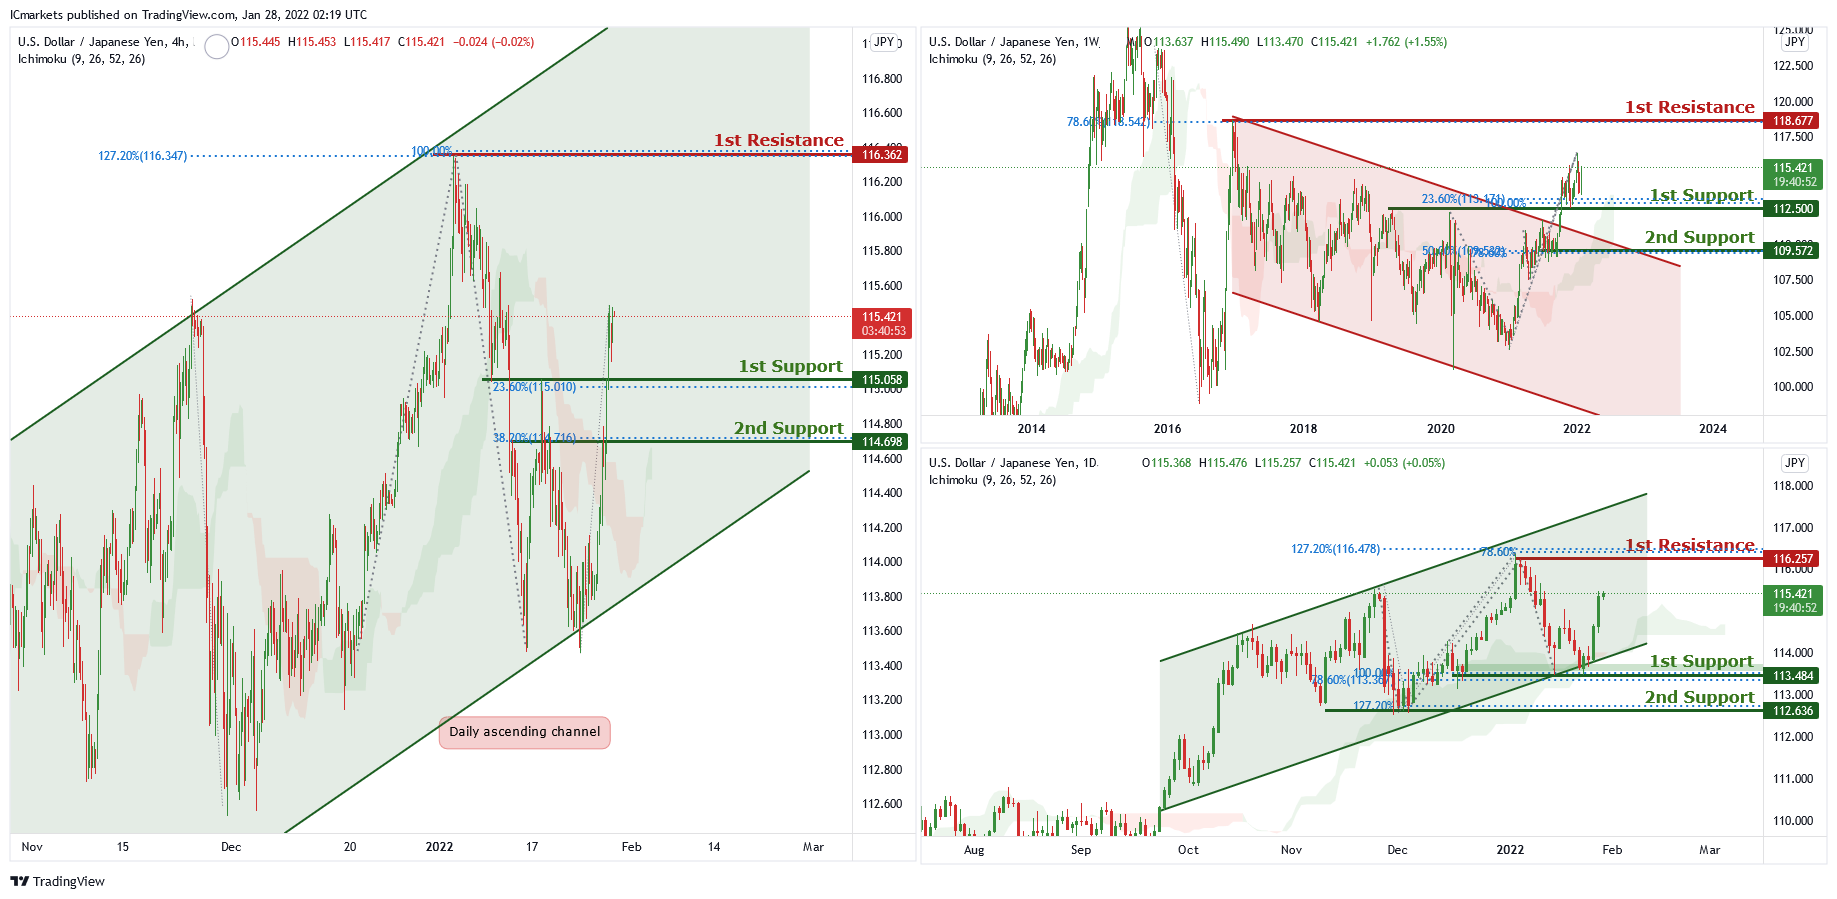
USD/JPY
On the weekly chart, price has broken out of the descending channel and near support level of 112.500 which is also 23.6% Fibonacci retracement and 100% Fibonacci projection. Price can potentially go to the 1st resistance level of 118.677 which is also 78.6% Fibonacci retracement. Our bullish bias is supported by the ichimoku cloud indicator as price is trading above it.
On the daily chart price is trading in an ascending channel and is between 1st resistance of 116.257 which is also 127.2% Fibonacci retracement , 78.6% Fibonacci projection and 1st support of 113.484 which is also 100% Fibonacci projection and 78.6% Fibonacci retracement. Our bullish bias is supported by the ichimoku cloud indicator as price is trading above it.
On the H4 chart, price is trading in an ascending channel and is near 1st support level of 115.058 which is also 23.6% Fibonacci retracement. Price can potentially go to the 1st resistance level of 116.362 which is also 100% Fibonacci projection and 127.2% Fibonacci retracement. Our bullish bias is supported by the ichimoku cloud indicator as price is trading above it.
Areas of consideration:
- H4 1st support at 115.058
- H4 1st resistance at 116.362
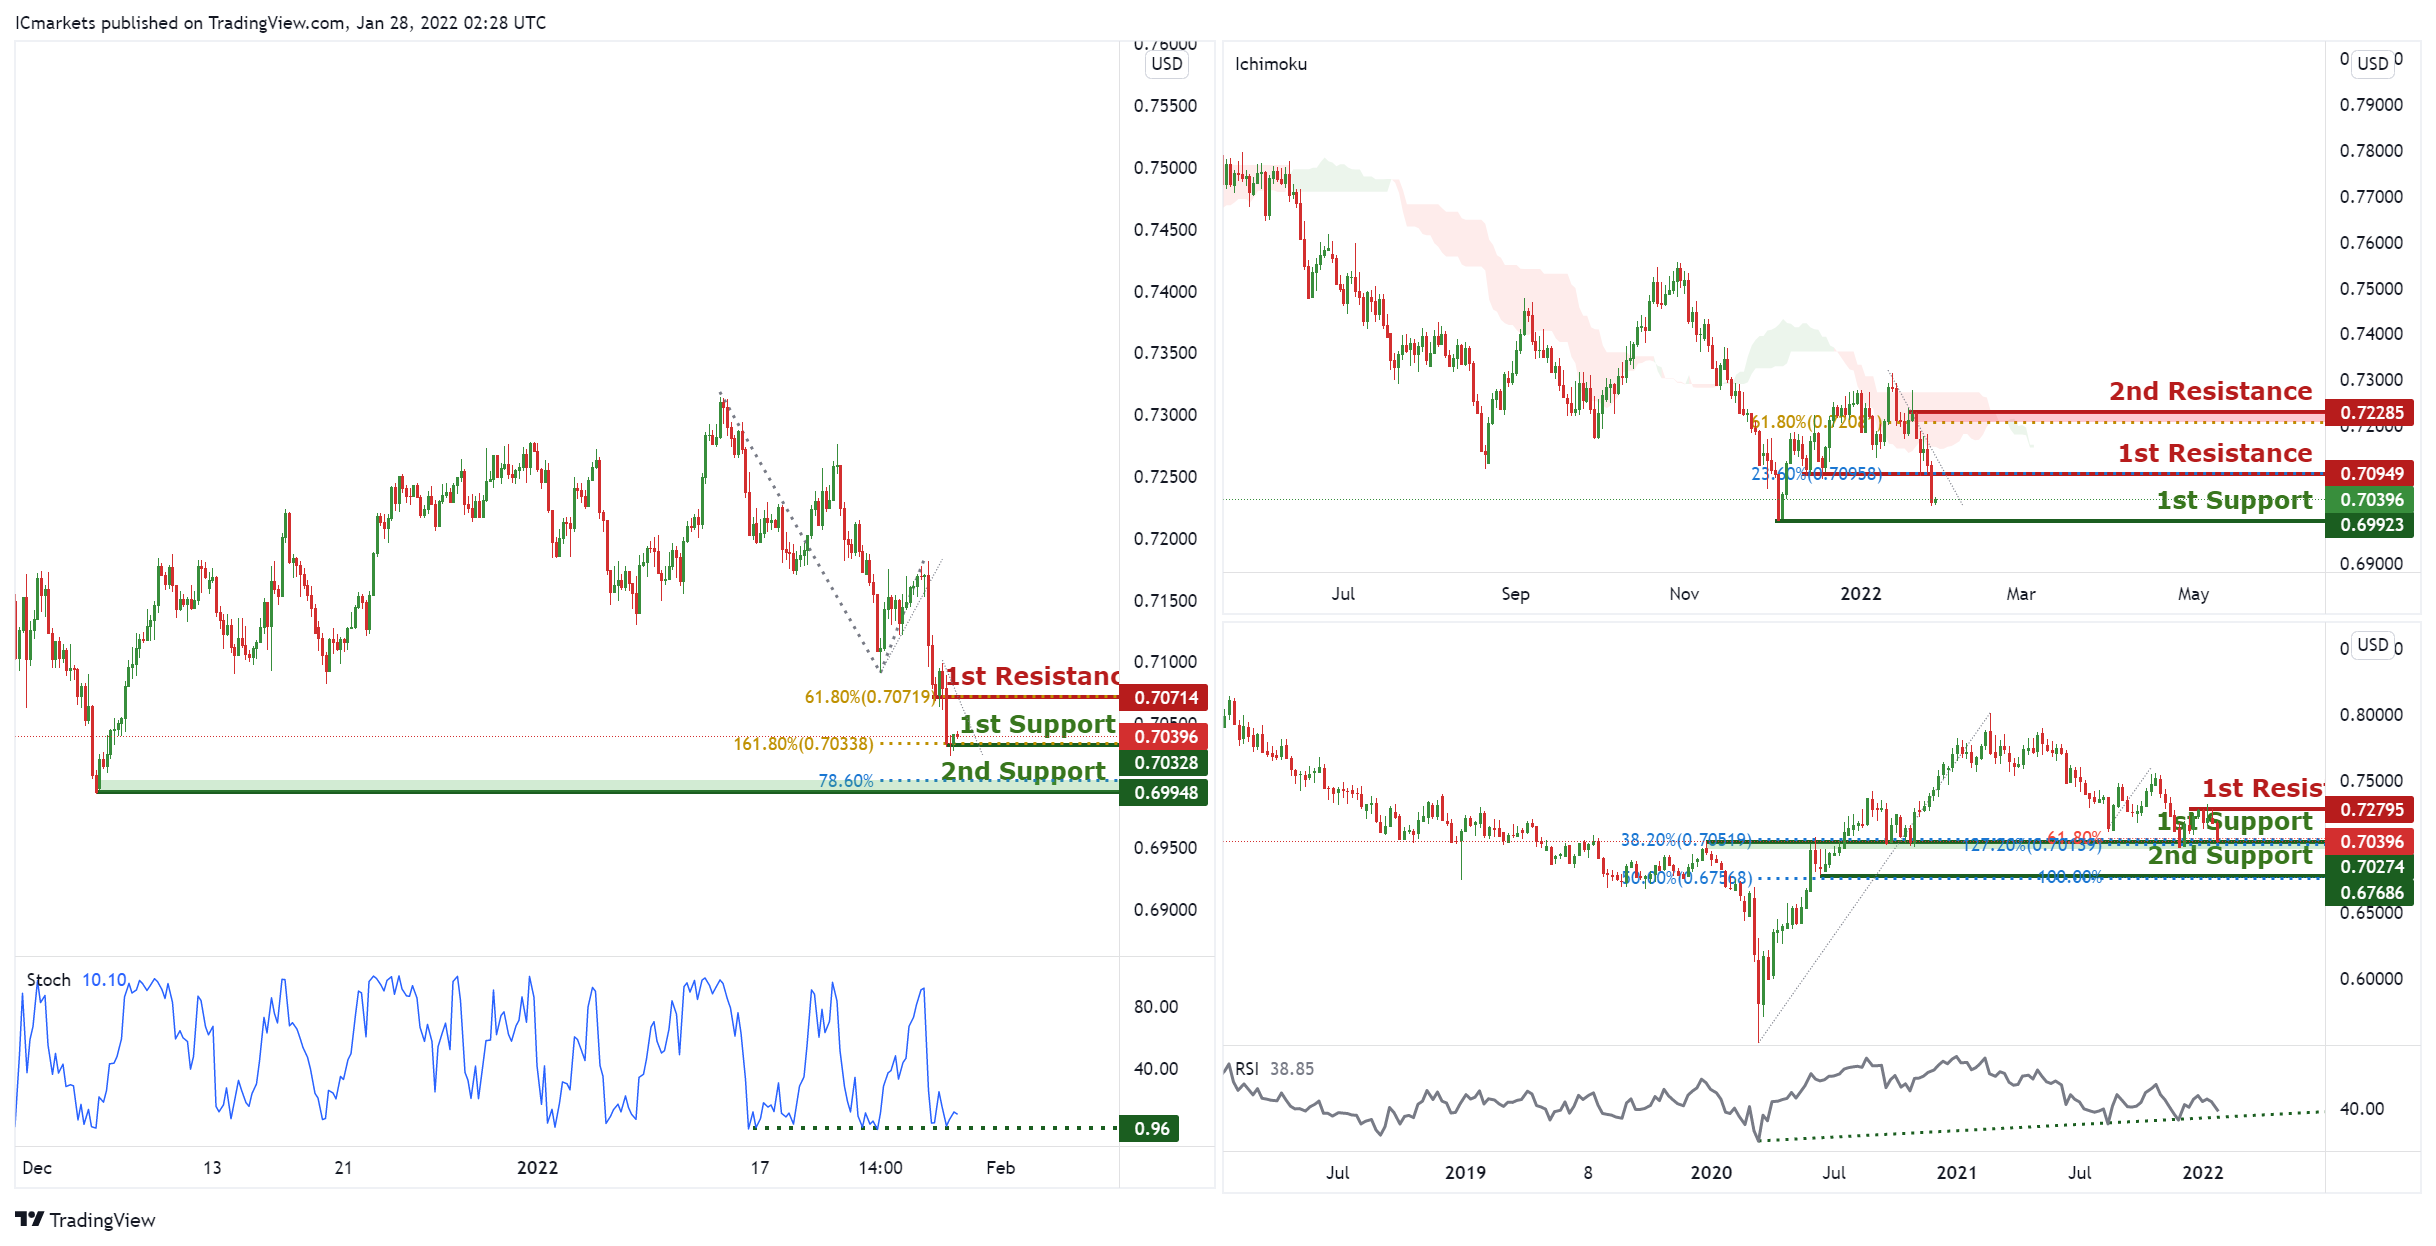
AUD/USD:
On the Weekly, with price moving below the ichimoku cloud, signifying an overall bearish momentum. We can expect price to drop from our 1st resistance at 0.70949 in line horizontal graphical overlap and 23.6% Fibonacci retracement towards 1st support in line with horizontal swing low support at 0.69923. Alternatively, price may break 1st resistance structure and head for 2nd resistance, which coincides with 61.8% Fibonacci retracement at 0.72285.
On the Daily, we expect a potential bounce from our 1st support at 0.70274 where there is a confluence of the 38.2% Fibonacci retracement, 61.8% Fibonacci retracement and 127.2% Fibonacci extension towards our 1st resistance at 0.72795 in line with the swing high resistance. Alternatively, price may break 1st support structure and head for 2nd support at 0.67686 in line with the 100% Fibonacci projection and 50% Fibonacci retracement. Our bullish bias is further supported by how price is expected to bounce off the stochastics support level.
On the Weekly, we expect a potential bounce from our 1st support at 0.70328 which is in line with the 161.8% Fibonacci extension towards our 1st resistance at 0.70714 in line with the horizontal overlap resistance and 61.8% Fibonacci retracement. Alternatively, price may break 1st support structure and head for 2nd support at 0.69948 in line with the 78.6% Fibonacci retracement. Our bullish bias is further supported by how price is expected to bounce off the stochastics support level.
Areas of consideration:
- H4 1st Support level 0.70328
- H4 1st resistance level 0.70714
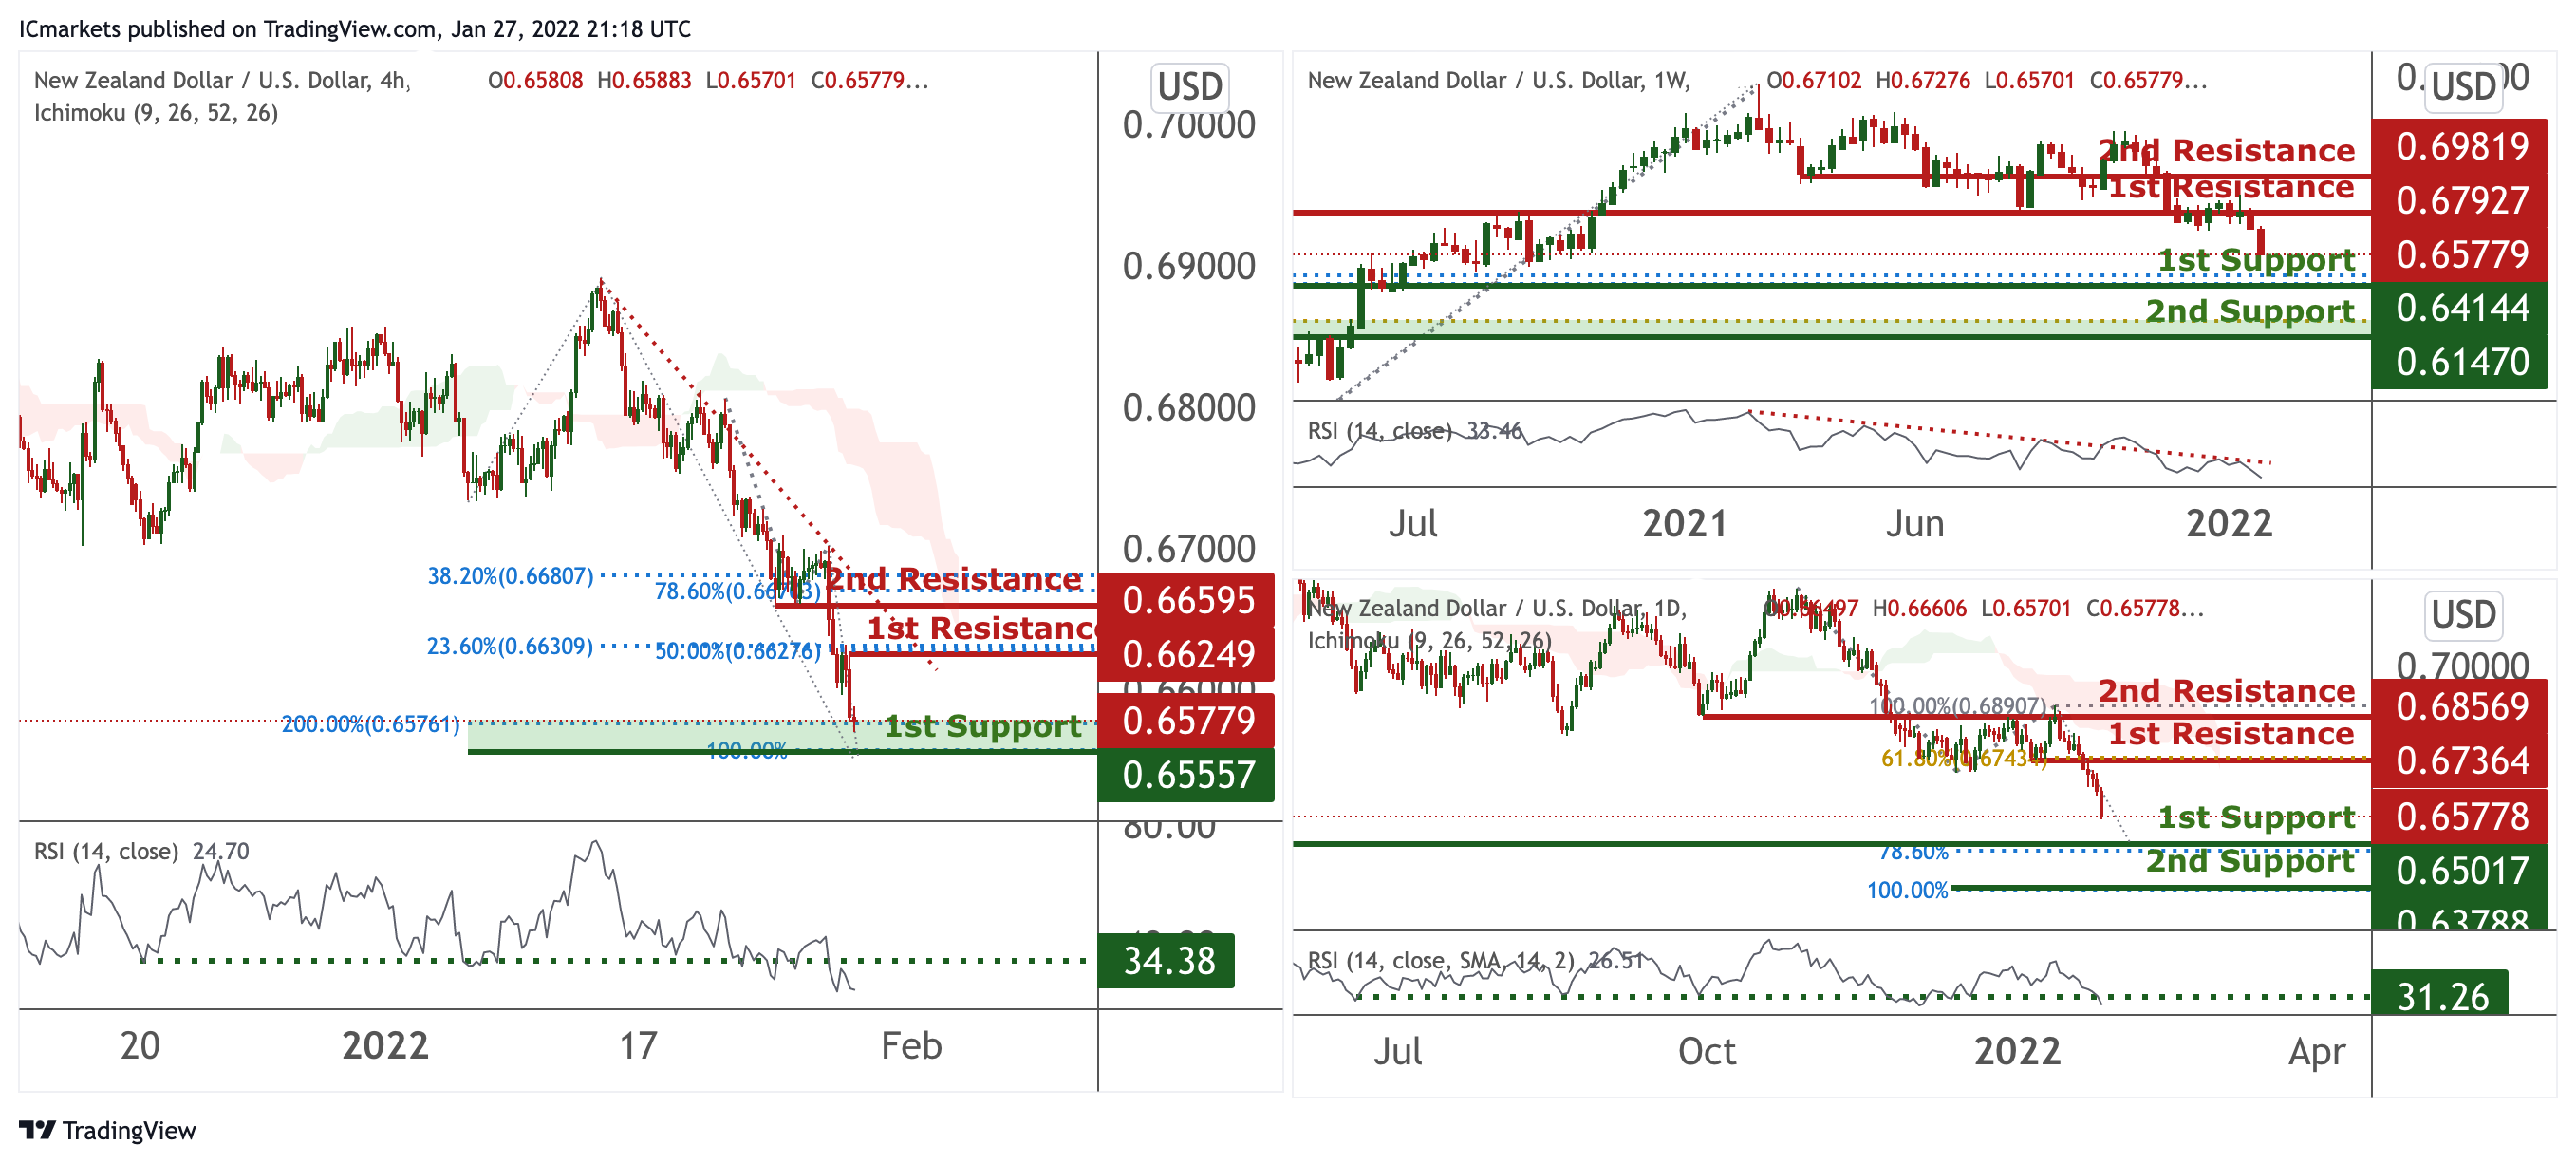
NZD/USD:
On the weekly timeframe, prices on downtrend. We see the potential for a reaction from 1st support at 0.64144 in line with 38.2% Fibonacci retracement towards our 1st resistance at 0.67927 which is a graphical overlap. RSI are at levels where bounces previously occurred.
On the daily, prices are on bearish momentum. We see the potential for further bearish continuation from our 1st resistance at 0.67364 in line with 61.8% Fibonacci retracement towards our 1st support at 0.65778 in line with 78.6% Fibonacci extension. RSI are at levels where bounces previously occurred.
On the H4, prices are on bearish momentum and abiding to our bearish trendline. We see the potential for a short bounce from our 1st support at 0.65557 in line with 200% Fibonacci projection and 100% Fibonacci extension towards our 1st resistance at 0.66249 in line with 23.6% Fibonacci retracement and 50% Fibonacci retracement. RSI is at a level where bounces occurred previously.
Areas of consideration:
- H4 time frame, 1st resistance at 0.66249
- H4 time frame, 1st support at 0.65557
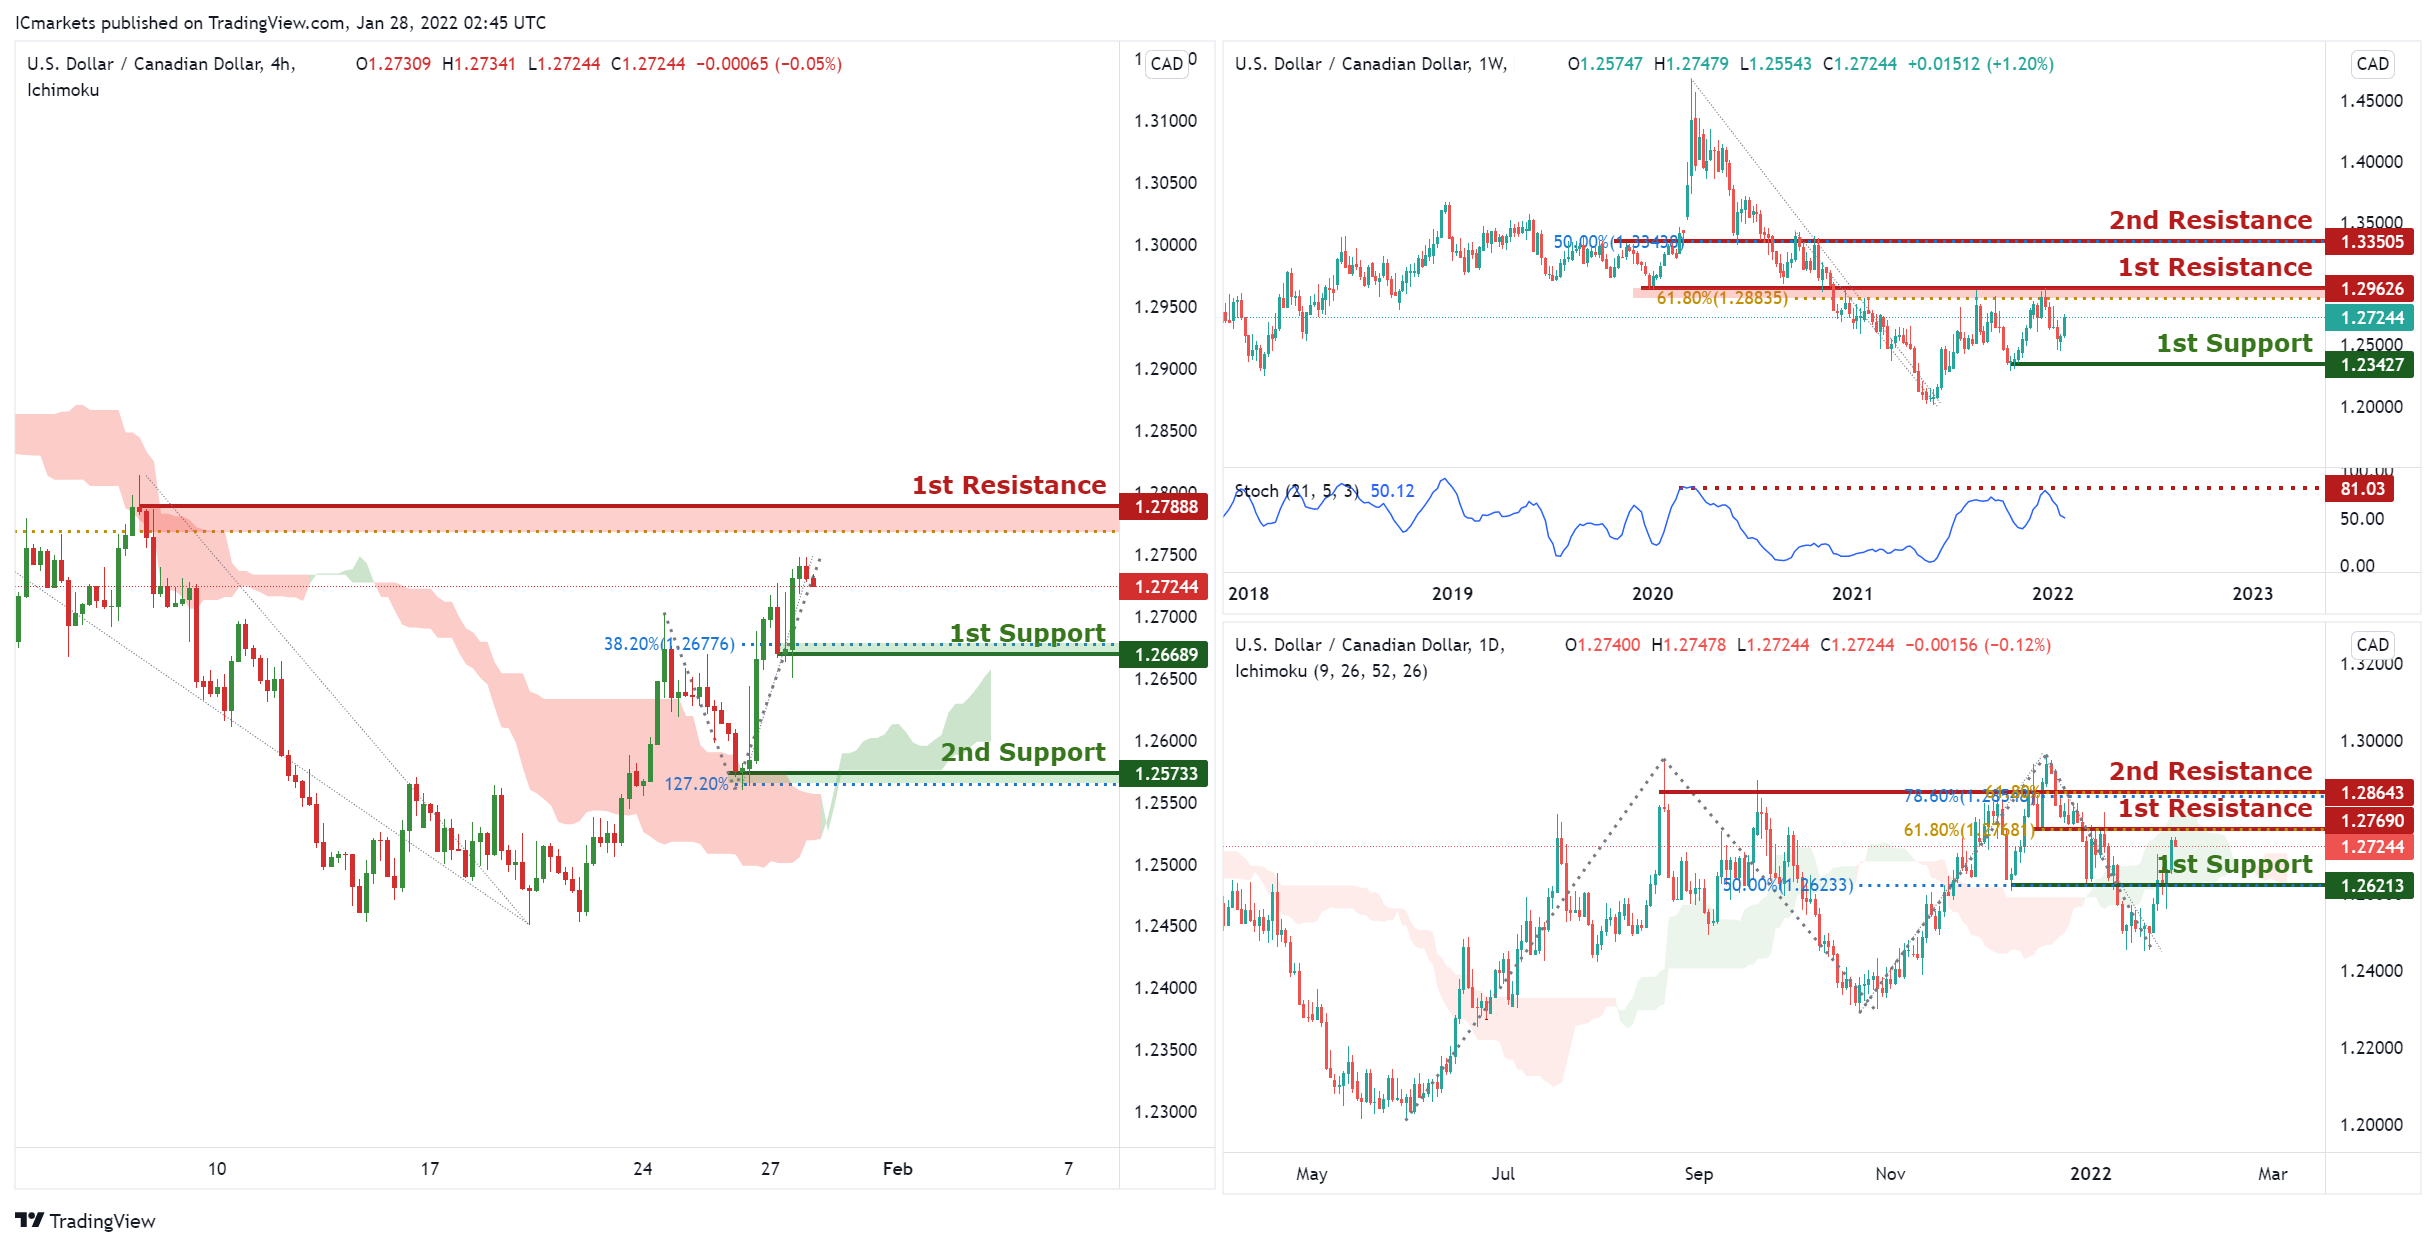
USD/CAD:
On the Weekly, with price respecting our resistance on the stochastics, signifying an bearish momentum. We can expect price to drop from our 1st resistance at 1.29626 in line horizontal graphical overlap and 61.8% Fibonacci retracement towards 1st support in line with horizontal swing low support at 1.23427. Alternatively, price may break 1st resistance structure and head for 2nd resistance, which coincides with 50% Fibonacci retracement at 1.33505. Traders should wait for price to swing higher or lower before entering.
On the Daily, with price approaching the resistance of the ichimoku cloud, we are expecting a bearish momentum from our 1st resistance at 1.27690 in line horizontal graphical overlap, the resistance of the ichimoku and 61.8% Fibonacci retracement towards 1st support in line with horizontal overlap support ,50% Fibonacci retracement level at 1.26213. Alternatively, price may break 1st resistance structure and head for 2nd resistance, which coincides with 78.6% Fibonacci retracement at 1.26643. On the H4, with prices moving above the ichimoku cloud, we see the potential for a bounce from our 1st support at 1.26689 in line with Horizontal swing low support and 38.2% Fibonacci retracement towards our 1st resistance at 1.27888 in line with horizontal swing high resistance and 61.8% Fibonacci retracement. Alternatively, price may break 1st support structure and head for 2nd support at 1.25733, in line with 127.2% Fibonacci extension and horizontal swing low support.
Areas of consideration:
- H4 time frame, 1st support at 1.26689
- H4 time frame, 1st resistance at 1.27888
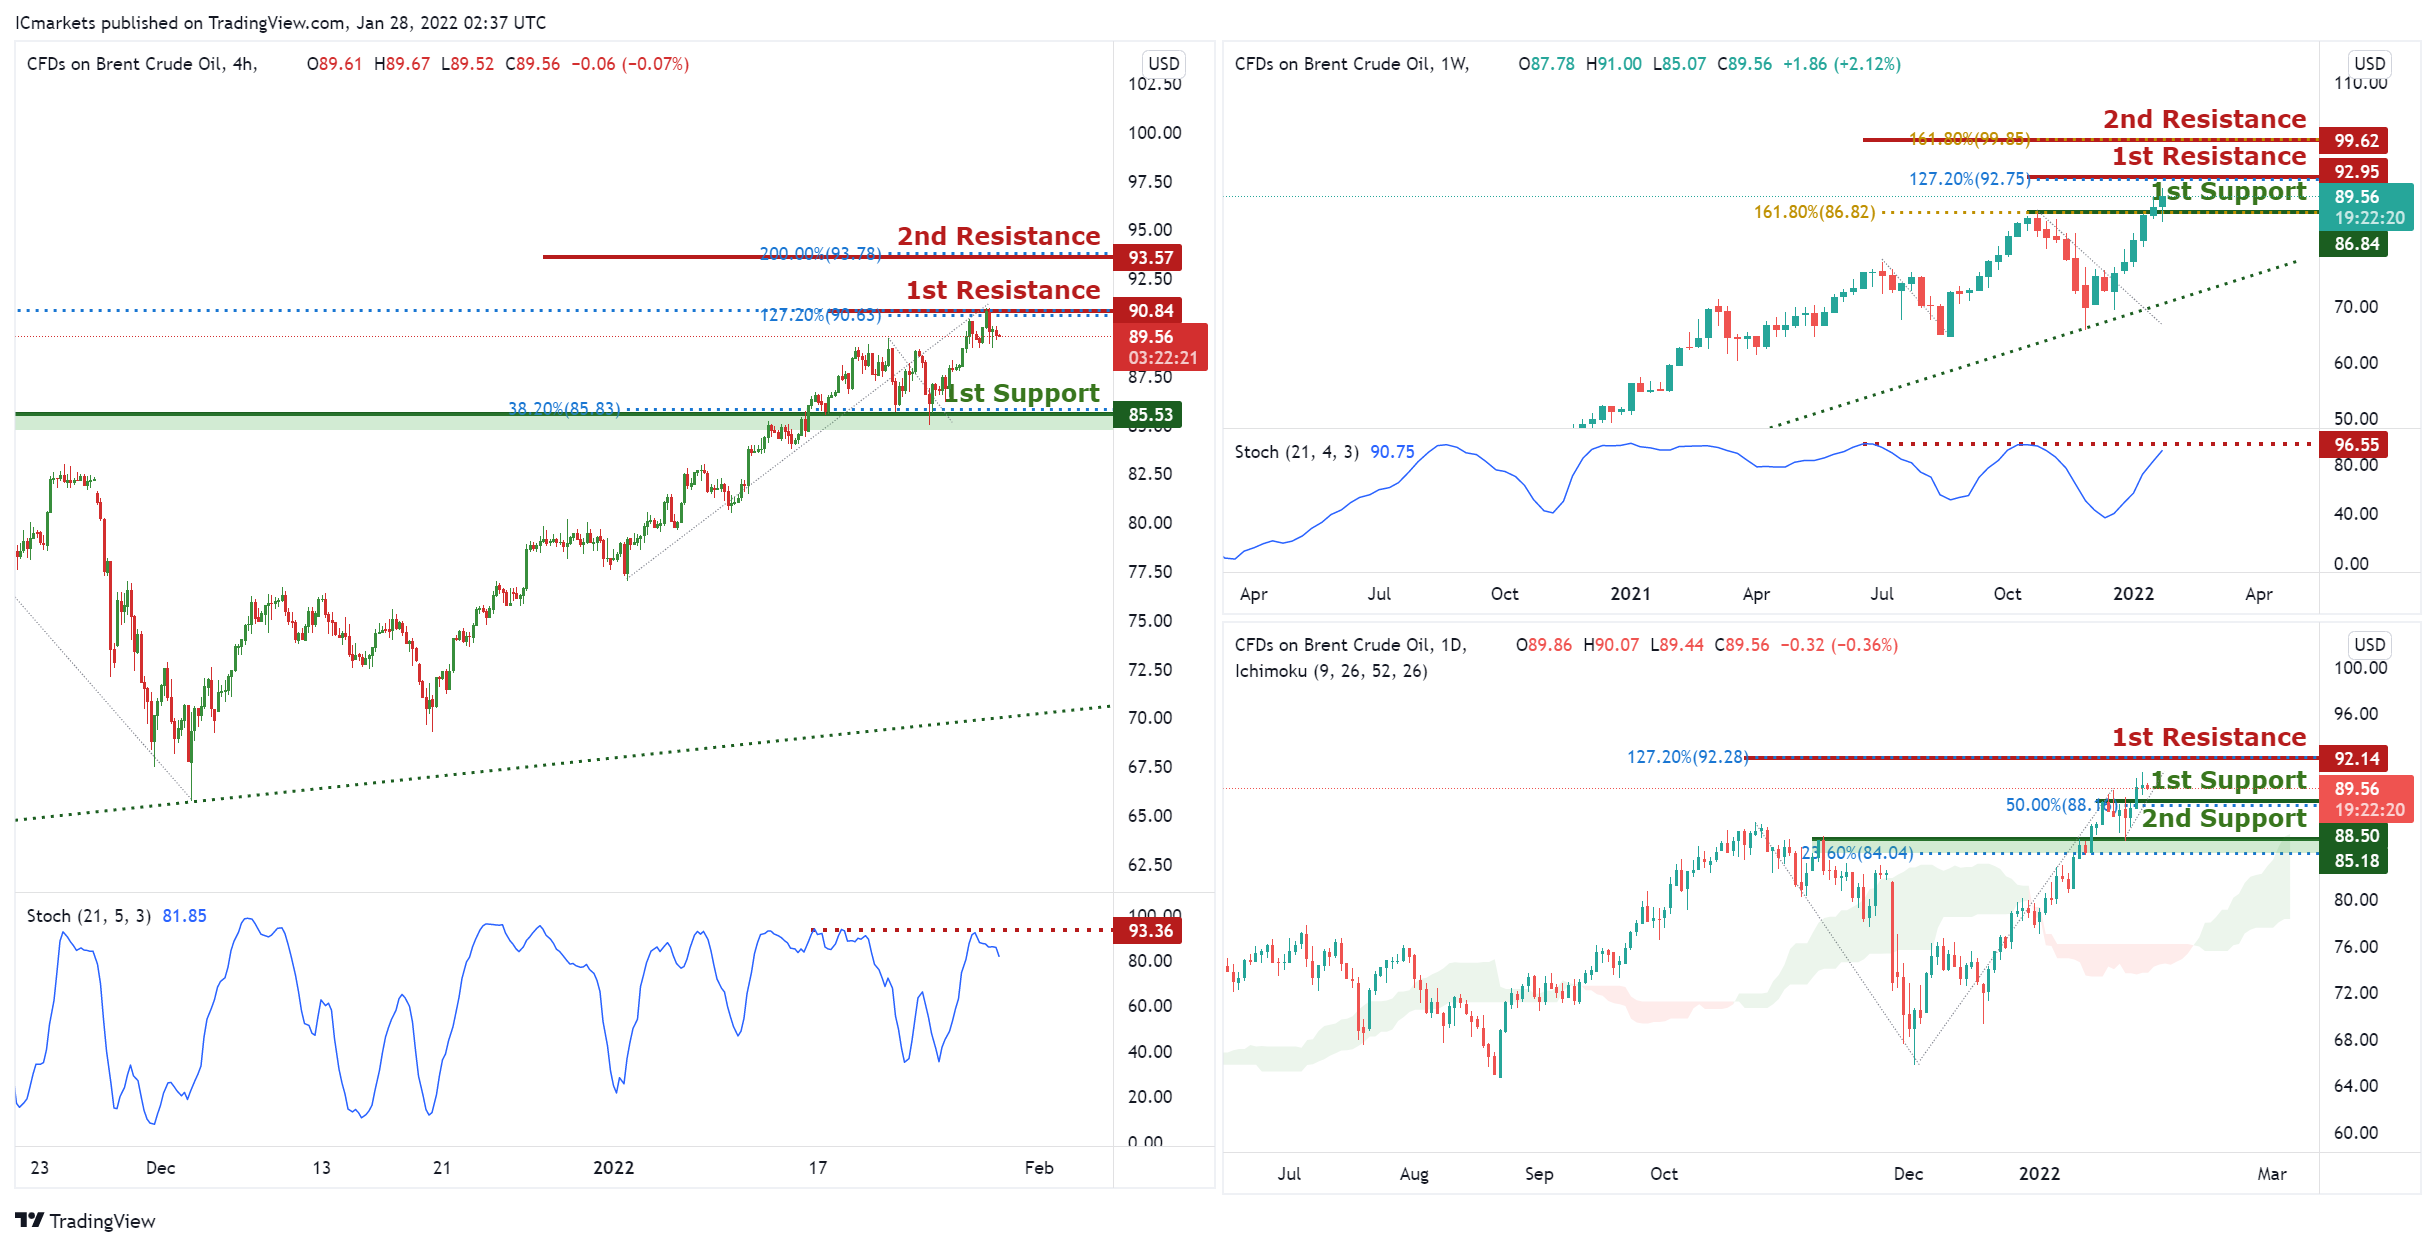
OIL:
On the Weekly, with price approaching the resistance of the stochastics indicator, signifying an upcoming bearish momentum. We can expect price to drop from our 1st resistance at 92.95 in line horizontal graphical overlap and 127.2% Fibonacci extension towards 1st support in line with horizontal overlap support ,161.8% Fibonacci extension level at 86.84. Alternatively, price may break 1st resistance structure and head for 2nd resistance, which coincides with 161.8% Fibonacci extension at 99.62.
On the Daily, we expect a potential bounce from our 1st support at 88.50 in line with 50% Fibonacci retracement towards our 1st resistance at 92.14 in line with 127.2% Fibonacci projection. Alternatively, price may break 1st support structure and head for 2nd support at 85.18 in line with the 23.6% Fibonacci retracement level. Prices are trading above our ichimoku clouds, further supporting our bullish bias.
On the H4, with price reversing off the resistance on the stochastics indicator, signifying an overall bearish momentum. We can expect price to drop from our 1st resistance at 90.84 in line horizontal graphical swing high resistance and 127.2% Fibonacci extension towards 1st support in line with horizontal overlap support ,38.2% Fibonacci retracement level at 85.53. Alternatively, price may break 1st resistance structure and head for 2nd resistance, which coincides with 200% Fibonacci extension level at 93.57.
Areas of consideration:
- H4 time frame, 1st resistance of 90.84
- H4 time frame, 1st support of 85.53
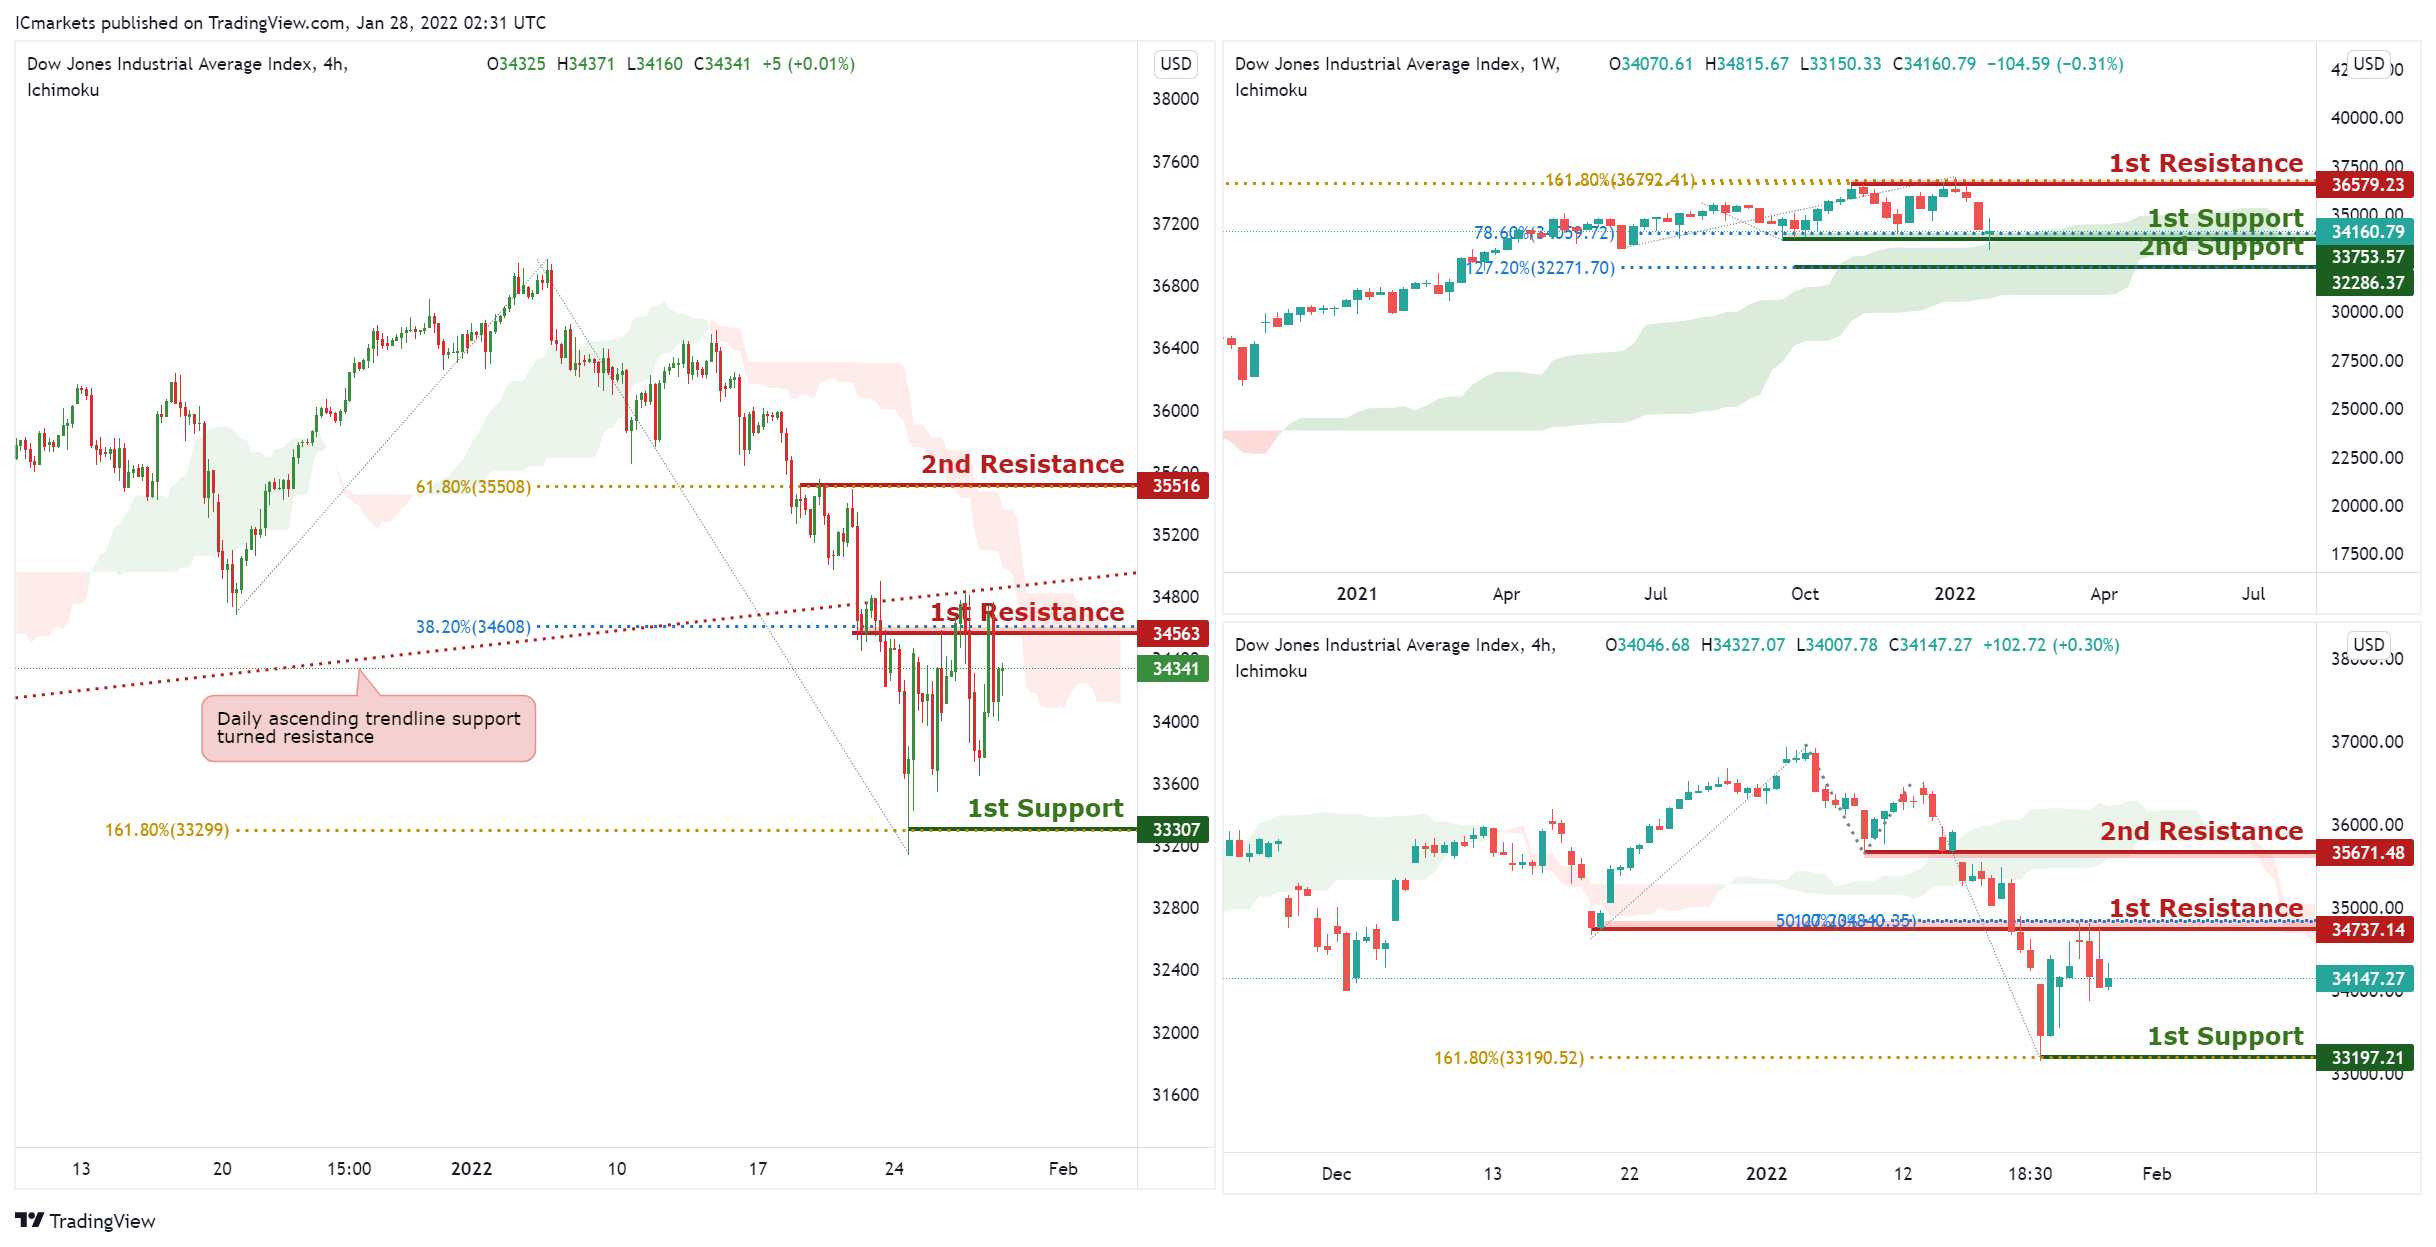
Dow Jones Industrial Average:
On the Weekly, are on bullish momentum and abiding to our ascending trendline support. We expect a potential bounce from our 1st support at 33753 in line with 78.6% Fibonacci retracement towards our 1st resistance at 36579 in line with 161.8% Fibonacci projection. Prices are trading above our ichimoku clouds, further supporting our bullish bias. Traders should wait for price to swing higher or lower before entering.
On the Daily, with price moving below the ichimoku cloud, signifying an overall bearish momentum. We can expect price to drop from our 1st resistance at 34737 in line horizontal graphical overlap and 50% Fibonacci retracement towards 1st support in line with horizontal overlap support ,161.8% Fibonacci extension level at 33197. Alternatively, price may break 1st resistance structure and head for 2nd resistance, which coincides with horizontal overlap resistance at 35671.
On the H4, with price moving below the ichimoku cloud, signifying an overall bearish momentum. We can expect price to drop from our 1st resistance at 34563 in line horizontal graphical overlap and 38.2% Fibonacci retracement towards 1st support in line with horizontal overlap support ,161.8% Fibonacci extension level at 33307. Alternatively, price may break 1st resistance structure and head for 2nd resistance, which coincides with 61.8% Fibonacci retracement at 35516. Traders should wait for price to swing higher or lower before entering.
Areas of consideration:
- H4 time frame, 1st resistance of 34563
- H4 time frame, 1st support of 33307
The accuracy, completeness and timeliness of the information contained on this site cannot be guaranteed. IC Markets does not warranty, guarantee or make any representations, or assume any liability regarding financial results based on the use of the information in the site.
News, views, opinions, recommendations and other information obtained from sources outside of www.icmarkets.com.au, used in this site are believed to be reliable, but we cannot guarantee their accuracy or completeness. All such information is subject to change at any time without notice. IC Markets assumes no responsibility for the content of any linked site.
The fact that such links may exist does not indicate approval or endorsement of any material contained on any linked site. IC Markets is not liable for any harm caused by the transmission, through accessing the services or information on this site, of a computer virus, or other computer code or programming device that might be used to access, delete, damage, disable, disrupt or otherwise impede in any manner, the operation of the site or of any user’s software, hardware, data or property.


