
DXY:
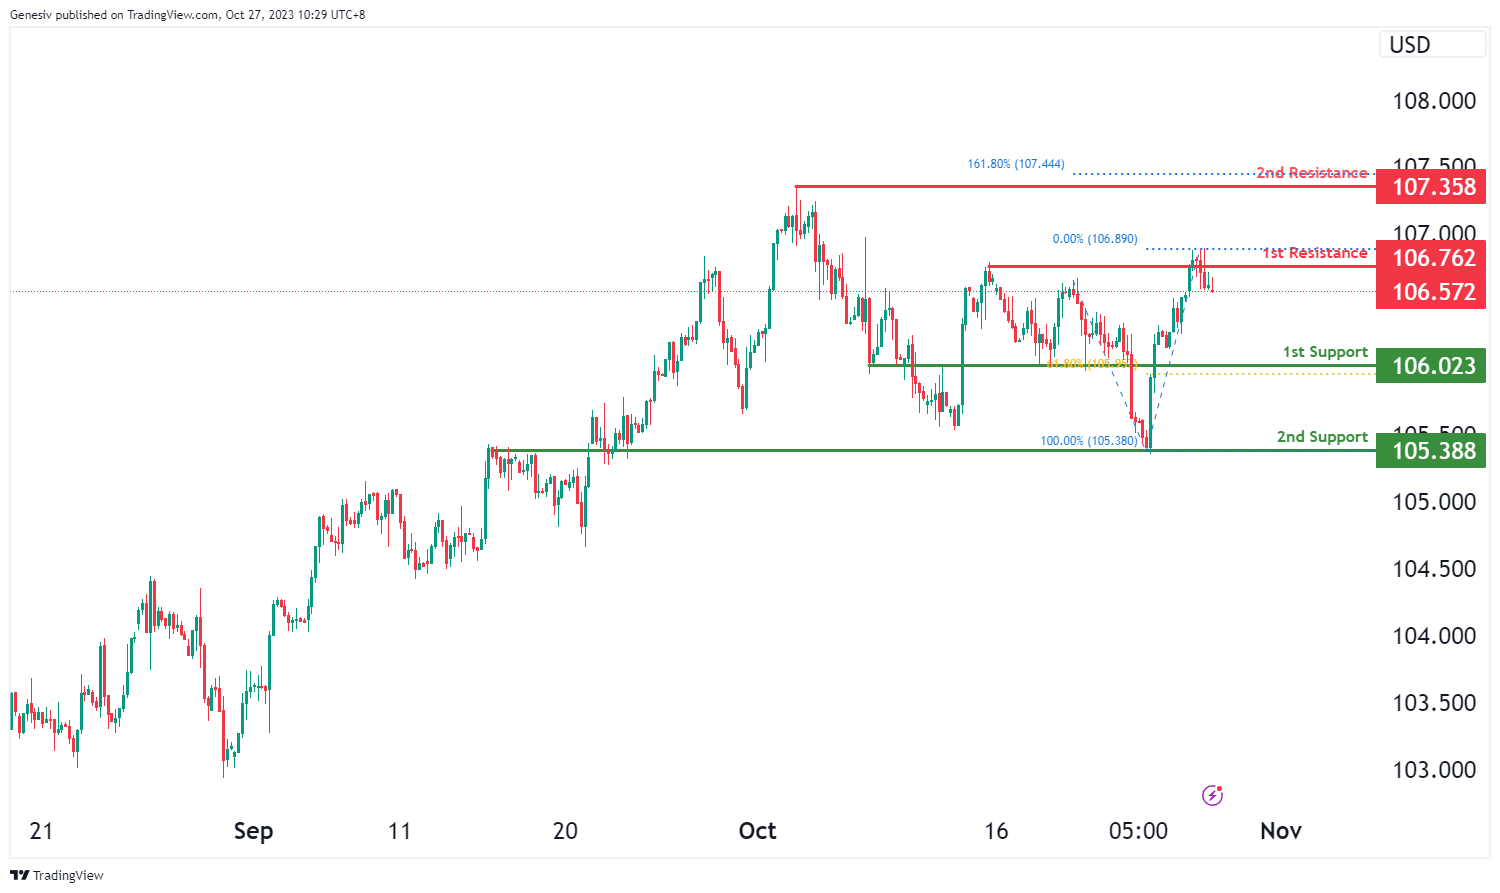
The chart for DXY (US Dollar Index) currently shows a bearish momentum, suggesting the potential for a bearish continuation towards the 1st support level at 106.02. This support level is considered significant as it aligns with a pullback support and coincides with the 61.80% Fibonacci Retracement level, making it a strong potential support zone.
Additionally, there is a 2nd support level at 105.38, which is identified as an overlap support, further reinforcing its potential as a support area.
On the resistance side, the 1st resistance at 106.72 is characterized as a multi-swing high resistance, indicating it could be a substantial barrier to upward price movement.
Furthermore, the 2nd resistance at 107.37 is marked as a swing high resistance and aligns with the 161.80% Fibonacci Extension level, adding to its significance as a potential resistance zone.
EUR/USD:
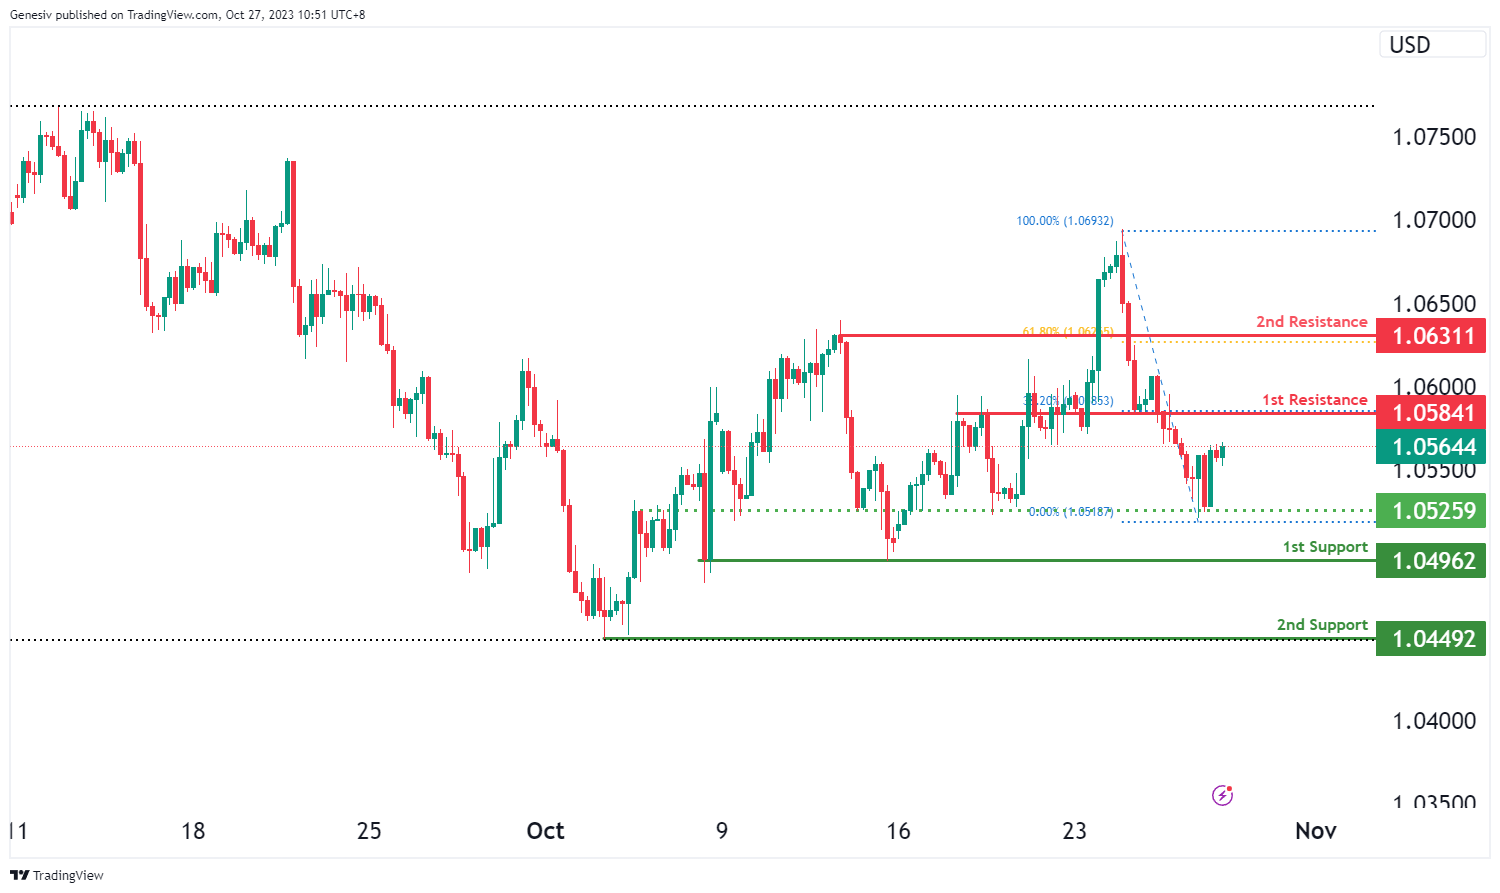
The chart for EUR/USD currently indicates a bullish momentum, suggesting the potential for a bullish continuation towards the 1st resistance level at 1.0584. This resistance level is considered significant as it aligns with a pullback resistance and coincides with the 38.20% Fibonacci Retracement level, making it a strong potential resistance zone.
Additionally, there is a 2nd resistance level at 1.0631, which is also identified as a pullback resistance and aligns with the 61.80% Fibonacci Retracement level, further reinforcing its potential as a barrier to upward price movement.
On the support side, the 1st support at 1.0496 is characterized as a multi-swing low support, indicating it could serve as a substantial area of price support. Similarly, the 2nd support at 1.0449 is identified as a swing low support, adding to the potential support levels.
An intermediate support level at 1.0525 is also noted as an overlap support, providing an additional layer of potential support for price movements.
EUR/JPY:
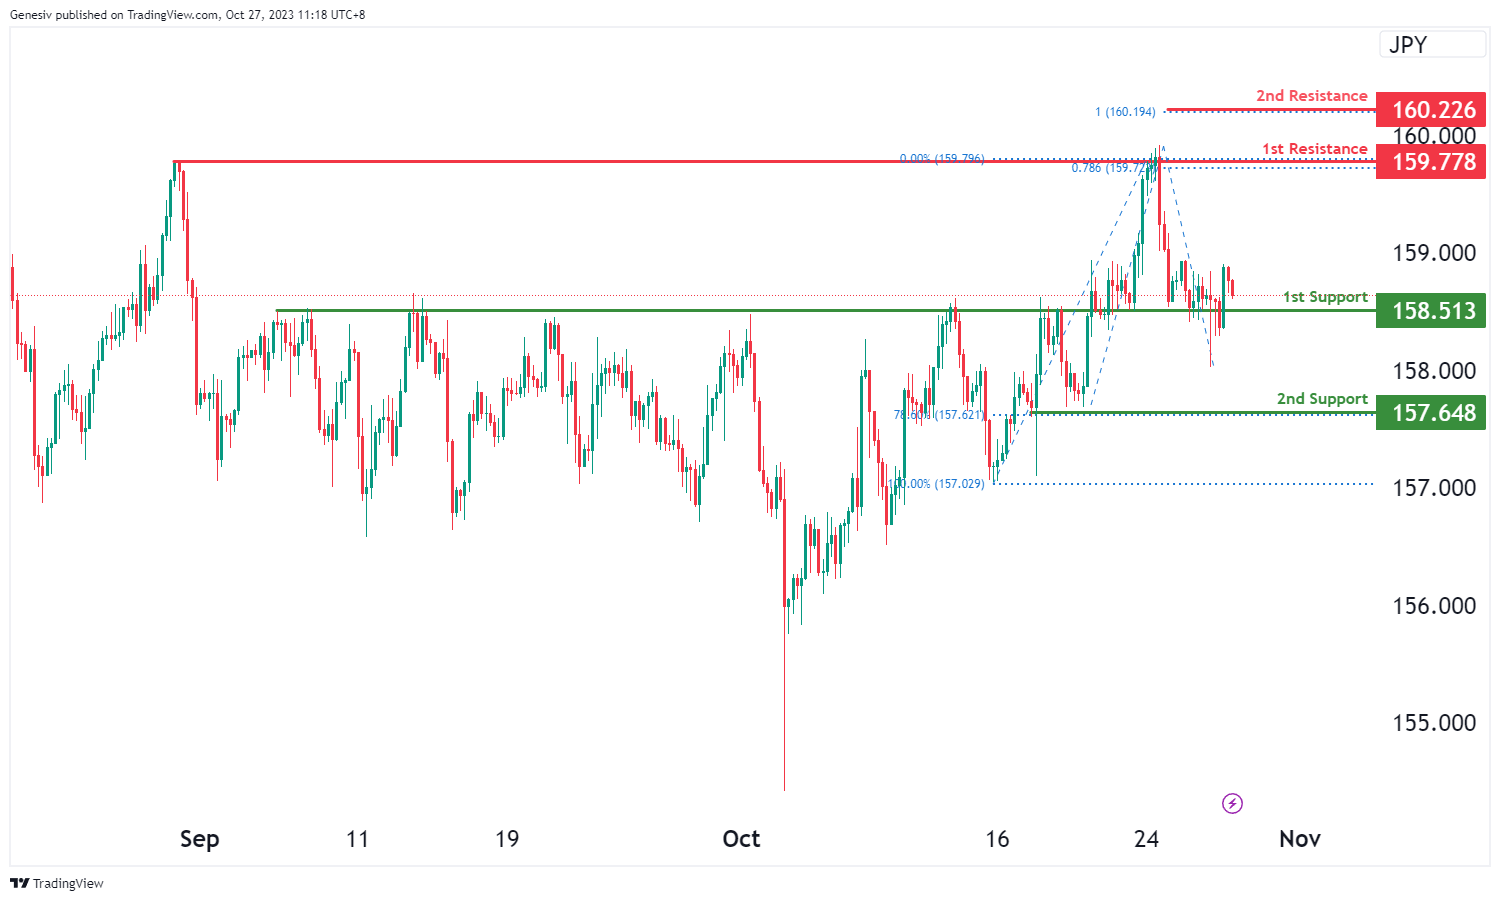
For EUR/JPY, the chart currently indicates a bullish overall momentum, suggesting that the price may potentially experience a bullish bounce off the first support at 158.51 and head towards the first resistance at 159.77.
The first support at 158.51 is considered significant due to its overlap support characteristics.
The second support at 157.64 is also noteworthy, as it features multi-swing low support and is associated with the 78.60% Fibonacci Retracement, making it a strong level of potential support.
On the resistance side, the first resistance at 159.77 is marked by multi-swing high resistance characteristics and is also associated with the 78.60% Fibonacci Projection, making it a substantial level of resistance. The second resistance at 160.22 is significant, as it involves the 100% Fibonacci Projection, indicating another important level of resistance.
EUR/GBP:
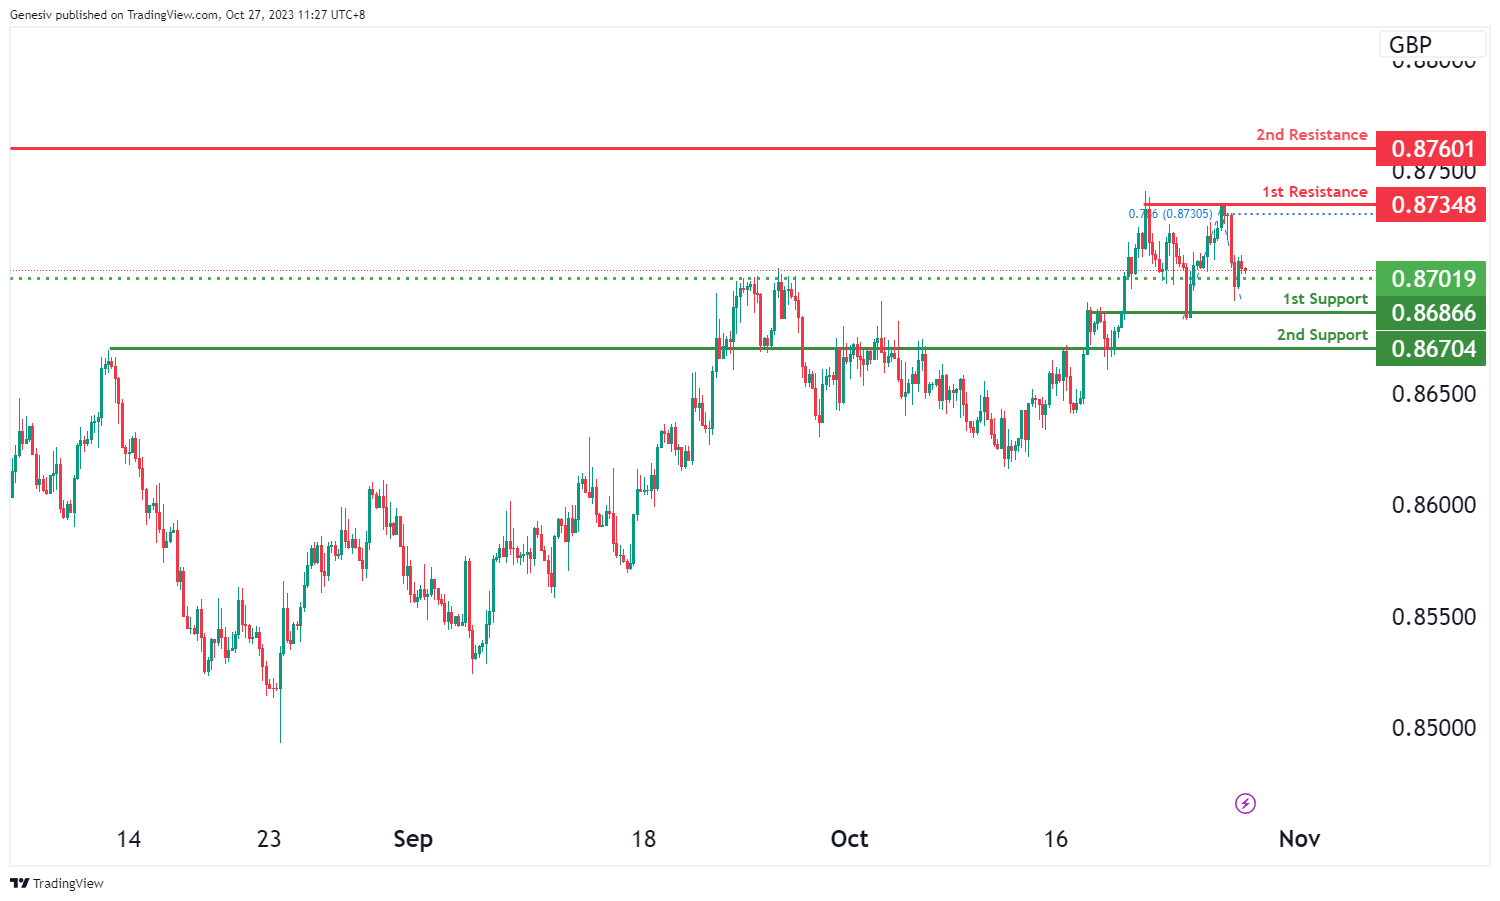
For EUR/GBP, the chart currently reflects a bearish overall momentum, indicating that the price could potentially continue in a bearish direction towards the first support at 0.8686.
The first support at 0.8686 is considered a strong level due to its overlap support characteristics and the presence of the 78.60% Fibonacci Projection, making it a significant potential support level.
The second support at 0.8670 is also noteworthy, as it features overlap support.
On the resistance side, the first resistance at 0.8729 is marked by multi-swing high resistance characteristics and is associated with the 78.60% Fibonacci Projection, indicating a substantial level of resistance. The second resistance at 0.8760 is significant due to its overlap resistance features.
Additionally, there is an intermediate support level at 0.8701, which is supported by its overlap support characteristics.
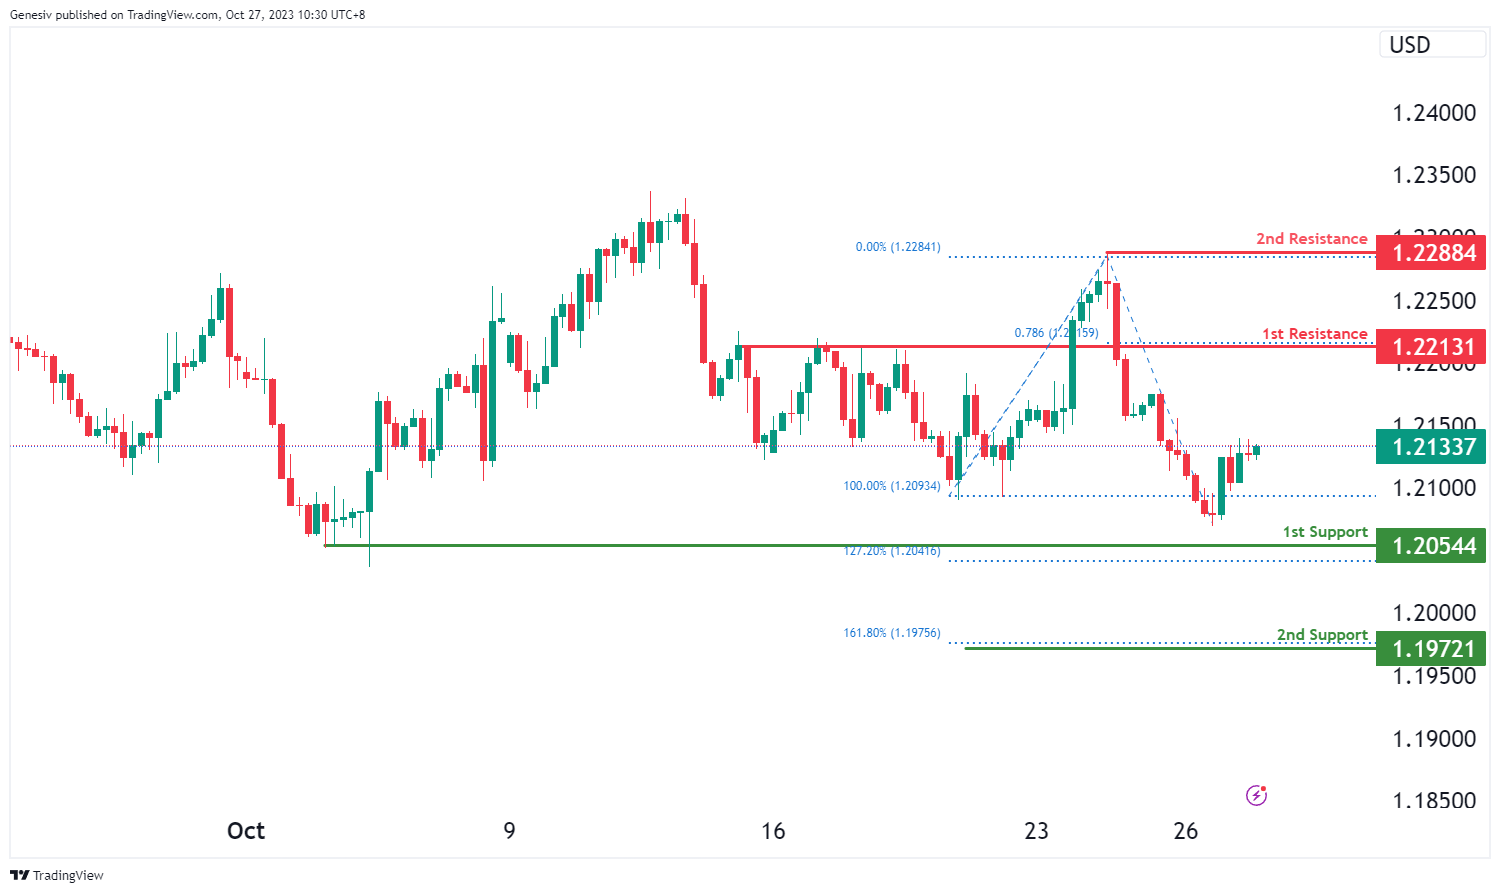
GBP/USD:
The GBP/USD chart currently demonstrates a bullish momentum, suggesting the potential for a bullish continuation towards the 1st resistance level at 1.2213. This resistance level is considered significant as it aligns with a pullback resistance and coincides with the 78.60% Fibonacci Projection, making it a strong potential resistance zone.
Additionally, there is a 2nd resistance level at 1.2288, which is identified as a swing high resistance, further reinforcing its potential as a barrier to upward price movement.
On the support side, the 1st support at 1.2054 is characterized as a multi-swing low support, indicating it could serve as a substantial area of price support. The 2nd support at 1.197 is associated with the 161.80% Fibonacci Extension, adding to its significance as a potential support level.
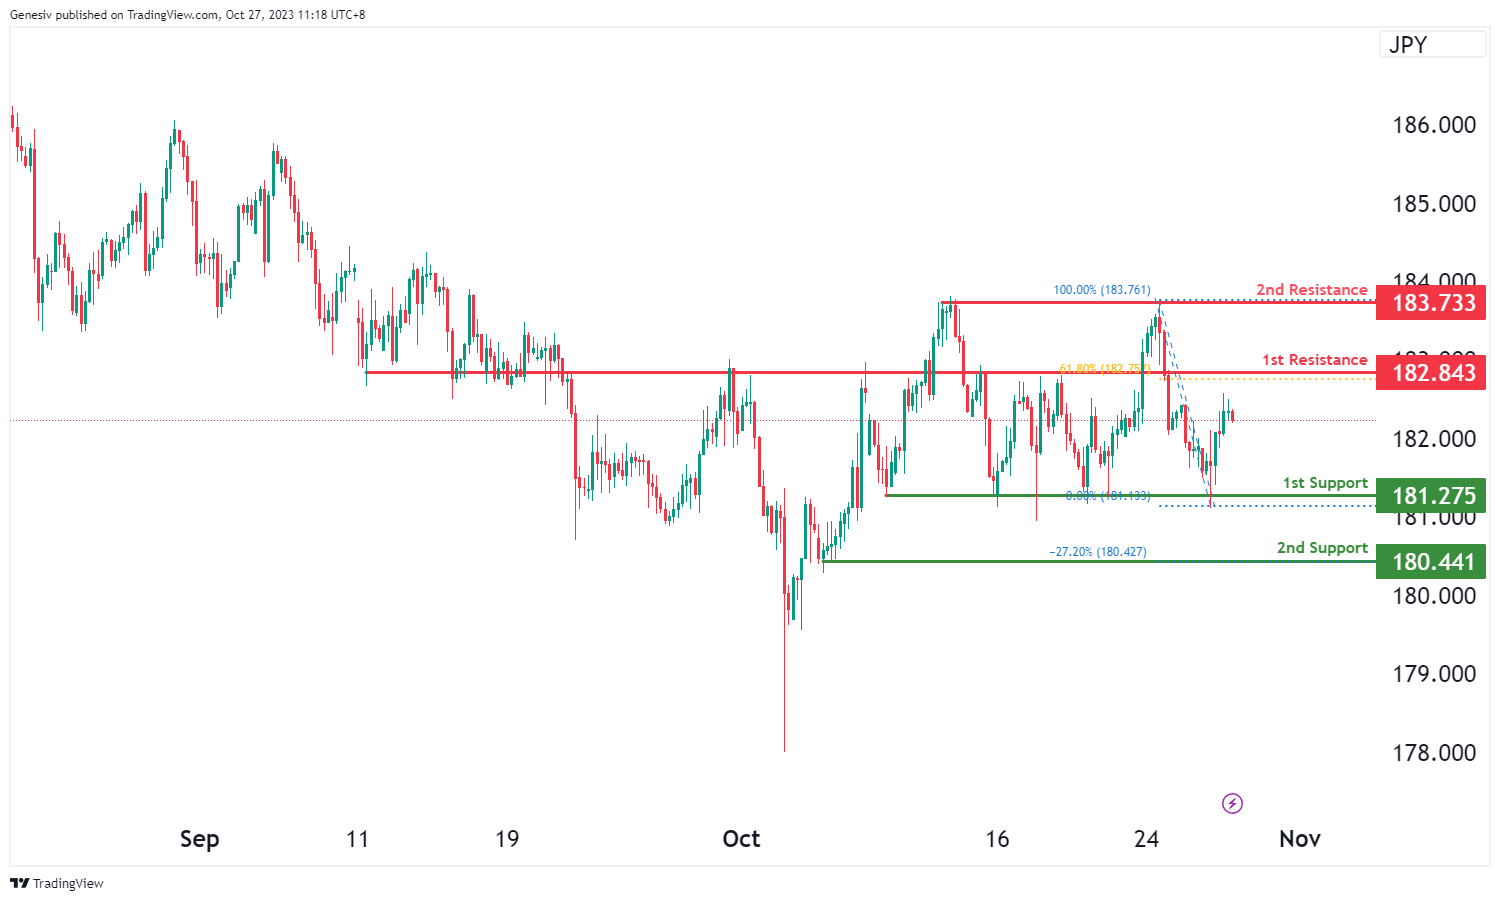
GBP/JPY:
For GBP/JPY, the chart currently indicates a bearish overall momentum, suggesting that the price could potentially continue in a bearish direction towards the first support at 181.27.
The first support at 181.27 is considered strong due to its multi-swing low support characteristics.
The second support at 180.44 is also significant as it features swing low support and is associated with the -27% Fibonacci Expansion, making it another level of potential support.
On the resistance side, the first resistance at 182.84 is marked by pullback resistance and is associated with the 61.80% Fibonacci Retracement, indicating a substantial level of resistance. The second resistance at 183.73 is noteworthy for its multi-swing high resistance characteristics.
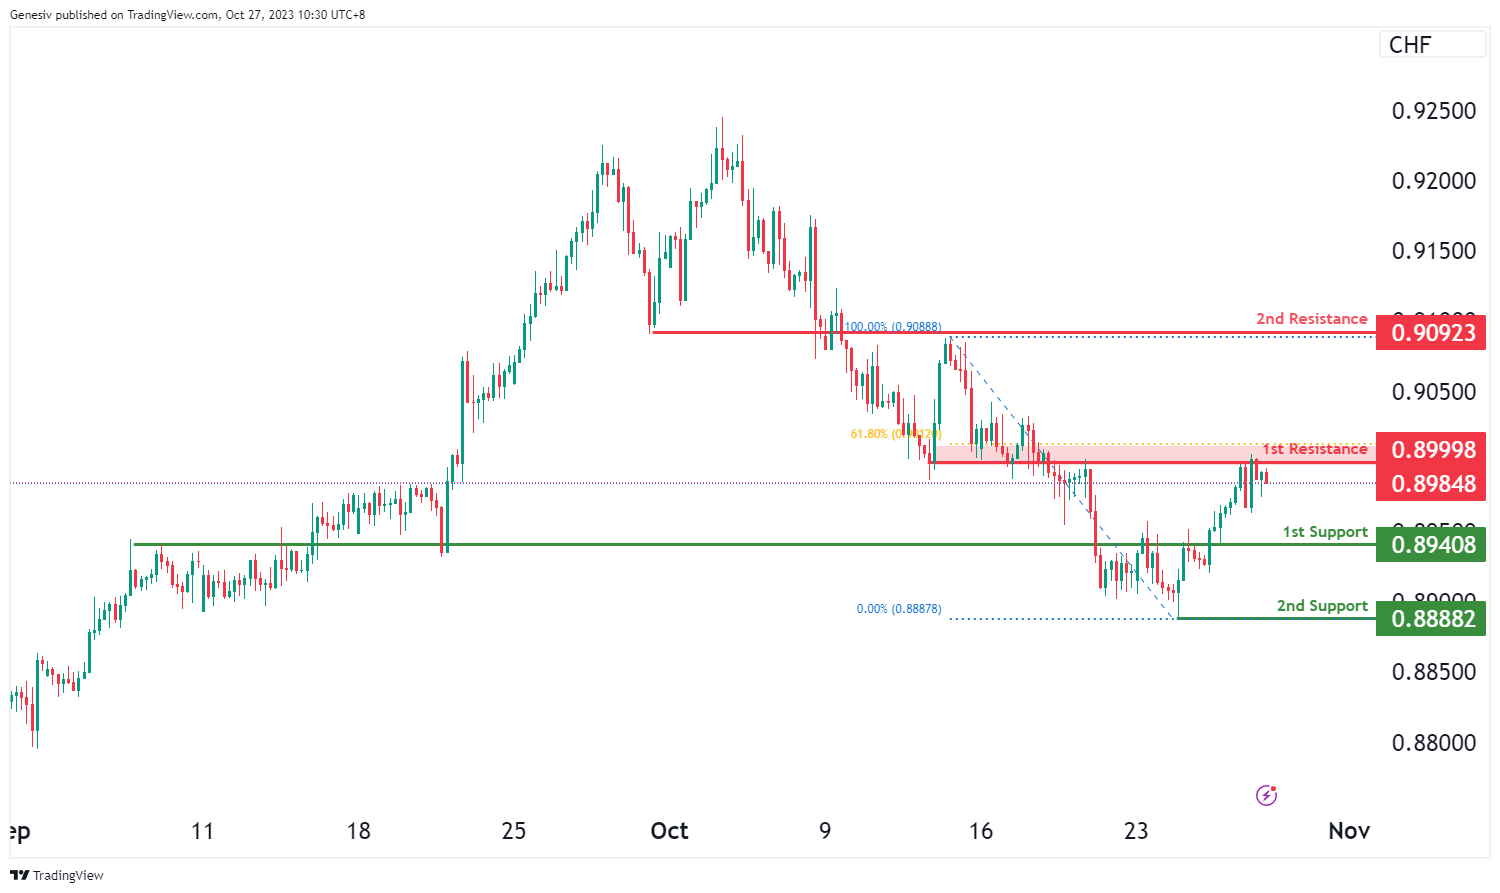
USD/CHF:
The USD/CHF chart currently indicates a bearish momentum, suggesting the potential for a bearish continuation towards the 1st support level at 0.8940. This support level is considered significant as it aligns with an overlap support.
Additionally, there is a 2nd support level at 0.8888, which is identified as a swing low support, reinforcing its potential as a support zone.
On the resistance side, the 1st resistance at 0.8999 is characterized as an overlap resistance and coincides with the 61.80% Fibonacci Retracement level, making it a strong potential barrier to upward price movement. The 2nd resistance at 0.9092 is also noted as an overlap resistance, adding to its significance as a potential area where selling pressure may emerge.
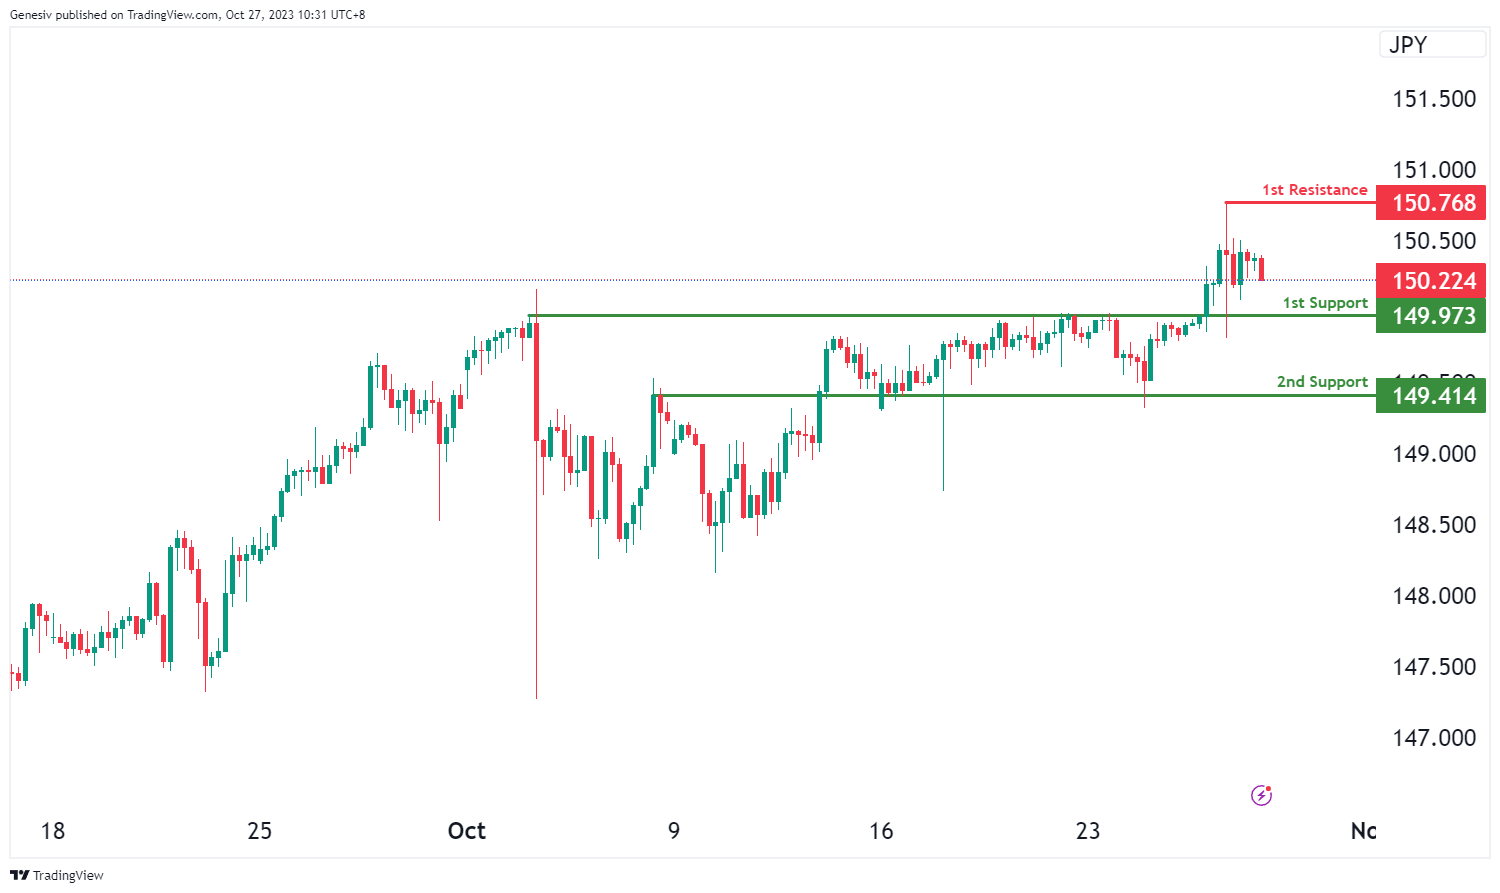
USD/JPY:
The USD/JPY chart currently exhibits bullish momentum, with the potential scenario of a bullish bounce off the 1st support level at 149.97 and a move towards the 1st resistance level at 150.76.
The 1st support at 149.97 is considered significant as it aligns with an overlap support, indicating its potential to act as a strong support level. Additionally, there is a 2nd support level at 149.41, which is also identified as an overlap support, further reinforcing the potential support zone.
On the resistance side, the 1st resistance at 150.76 is characterized as a swing high resistance, suggesting it could serve as a significant barrier to further upward price movement in the bullish direction.
USD/CAD:
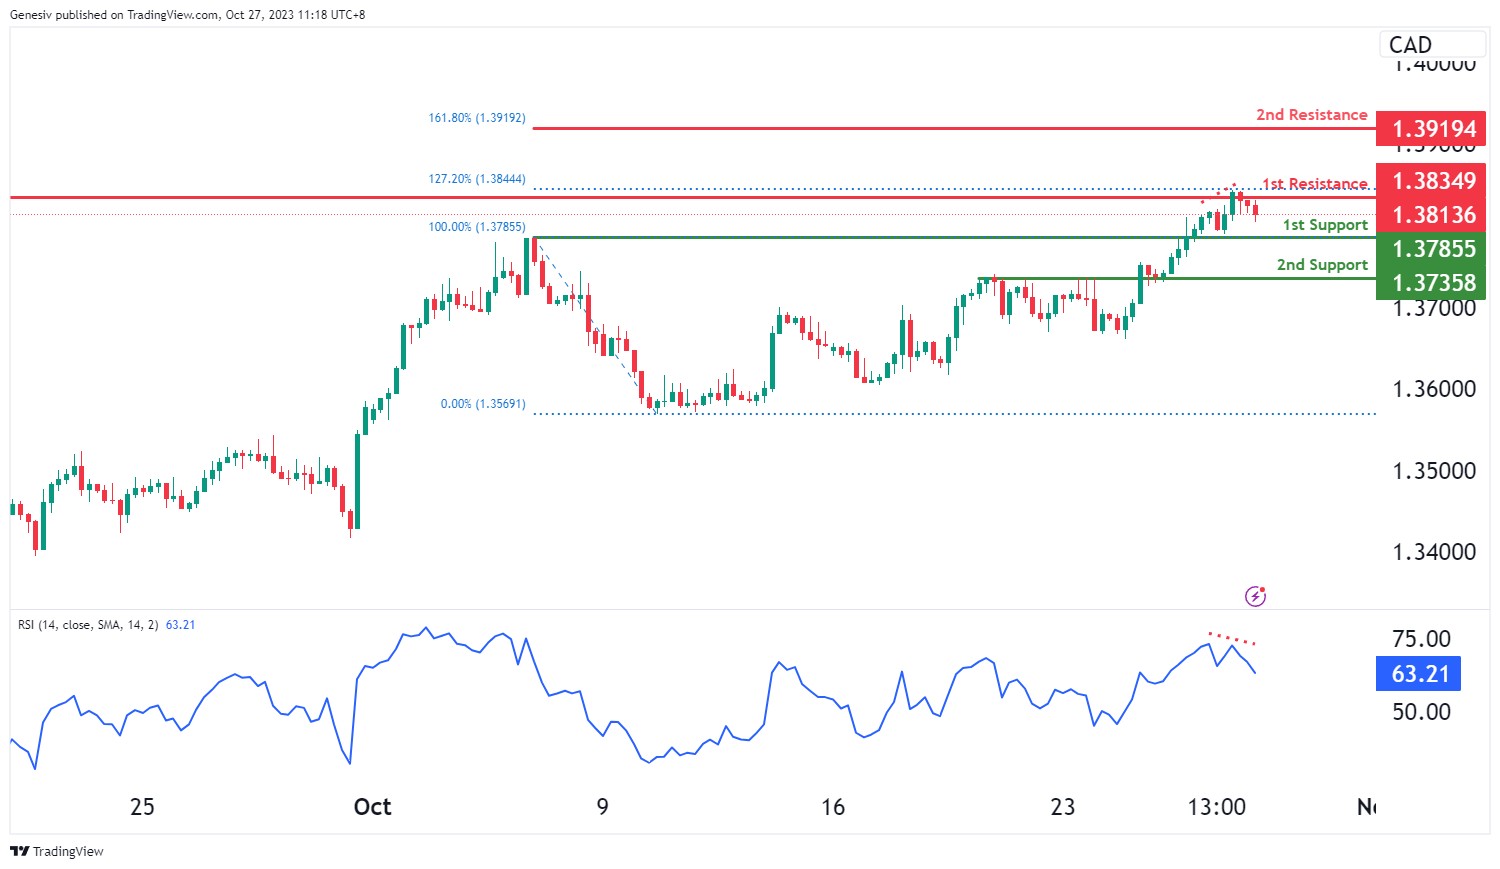
The USD/CAD chart currently exhibits an overall bullish momentum. However, the Relative Strength Index (RSI) is displaying bearish divergence versus price, indicating the likelihood of a bearish move towards the 1st support level.
The 1st support level at 1.3786 is identified as a pullback support. Further below, the 2nd support level at 1.3736 is noted as an overlap support, potentially acting as a strong support zone.
To the upside, the 1st resistance level at 1.3835 is identified as a multi-swing-high resistance that aligns with the 127.20% Fibonacci extension level. Higher up, the 2nd resistance level at 1.3919 is marked as a resistance level that aligns with the 161.80% Fibonacci extension level, potentially acting as a barrier to further bullish advances.
AUD/USD:
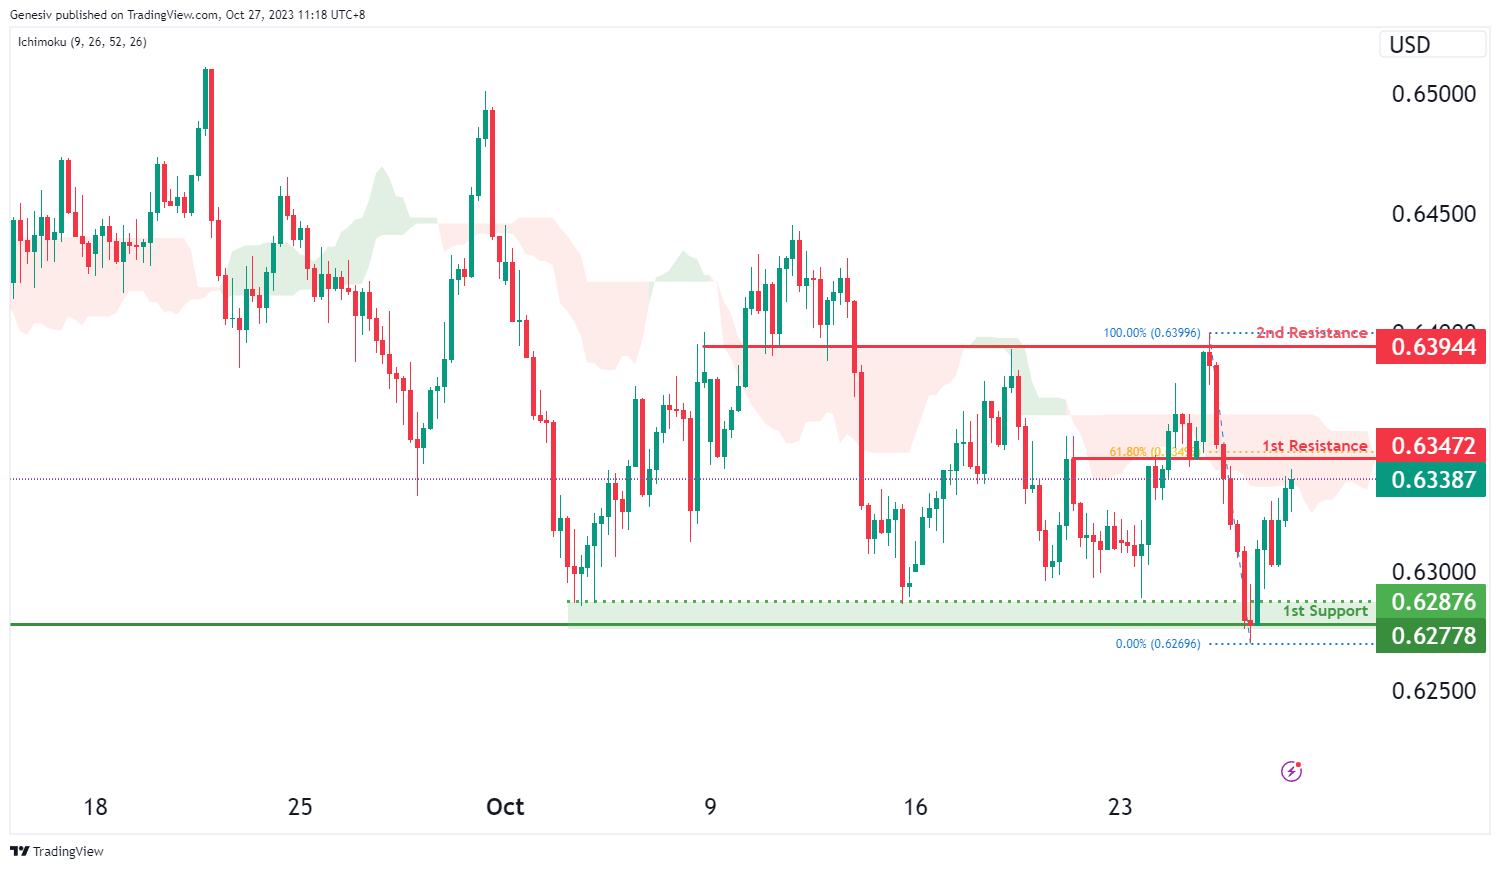
The AUD/USD chart currently exhibits an overall bearish momentum with a potential for price to make a bearish reaction off the 1st resistance level to drop lower towards the 1st support level. Price is also trading below the bearish Ichimoku cloud, adding to the overall bearish momentum.
The 1st resistance level at 0.6347 is identified as an overlap resistance that aligns with the 61.80% Fibonacci retracement level. Higher up, the 2nd resistance level at 0.6394 is also marked as an overlap resistance, making it a potentially strong resistance level.
To the downside the 1st support level at 0.6278 is identified as a multi-swing-low support, further reinforcing its importance as a potential support area.
NZD/USD
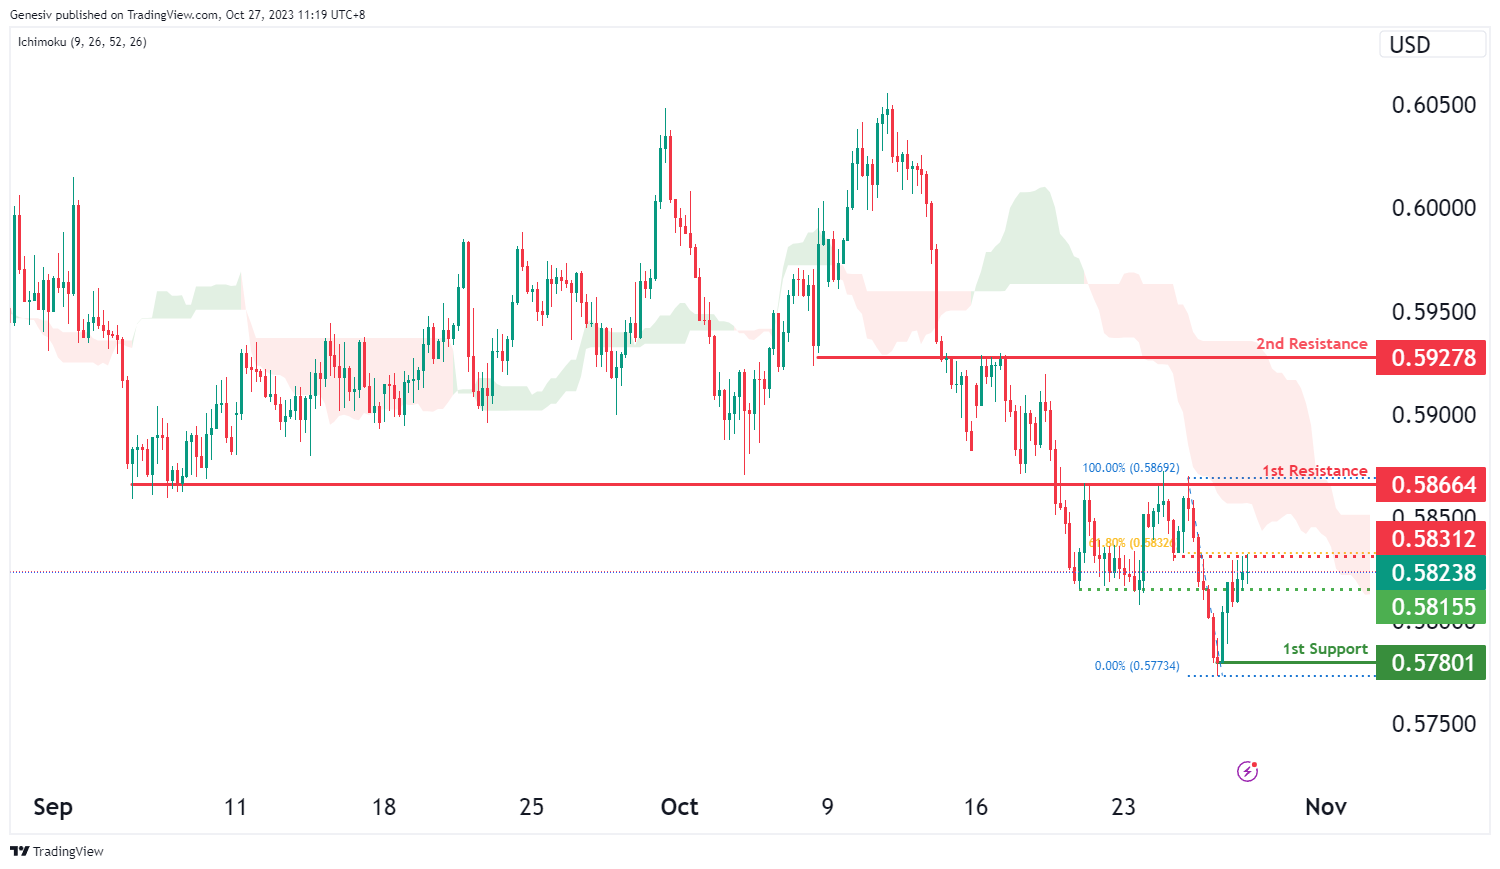
The NZD/USD chart currently exhibits an overall bearish momentum with price potentially making a bearish continuation towards the 1st support level, especially if price breaks below the intermediate support level. Price is also trading below the bearish Ichimoku cloud, adding to the overall bearish momentum.
The intermediate support at 0.5816 is identified as an overlap support while the 1st support level at 0.5780 is marked as a swing-low support, further reinforcing its importance as a potential support area.
To the upside, the intermediate resistance level at 0.5831 is identified as an overlap resistance that aligns with the 61.80% Fibonacci retracement level while the 1st resistance level at 0.5866 is also marked as an overlap resistance. Higher up, the 2nd resistance level at 0.5928 is also noted as an overlap resistance, making it a potentially strong resistance level.
DJ30:
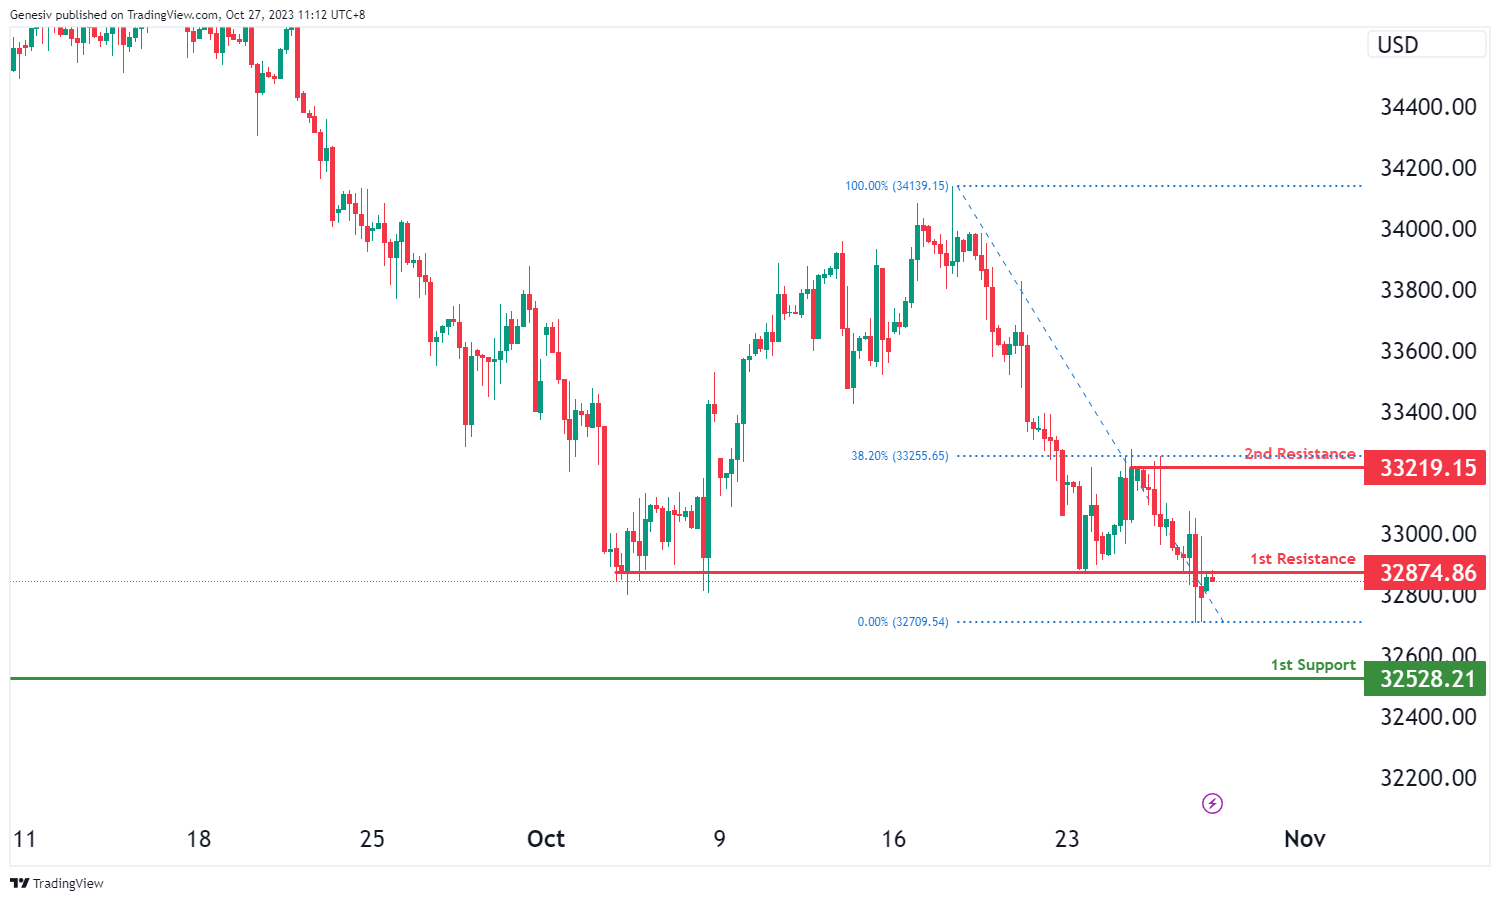
For DJ30, the chart currently indicates a bearish overall momentum, suggesting that the price may potentially experience a bearish reaction off the first resistance at 32874.86 and drop to the first support at 32528.21.
The first support at 32528.21 is considered strong due to its pullback support characteristics, making it a significant level of potential support.
On the resistance side, the first resistance at 32874.86 is noteworthy for its overlap resistance characteristics. The second resistance at 33219.15 is marked by multi-swing high resistance, making it another important level of resistance.
GER40:
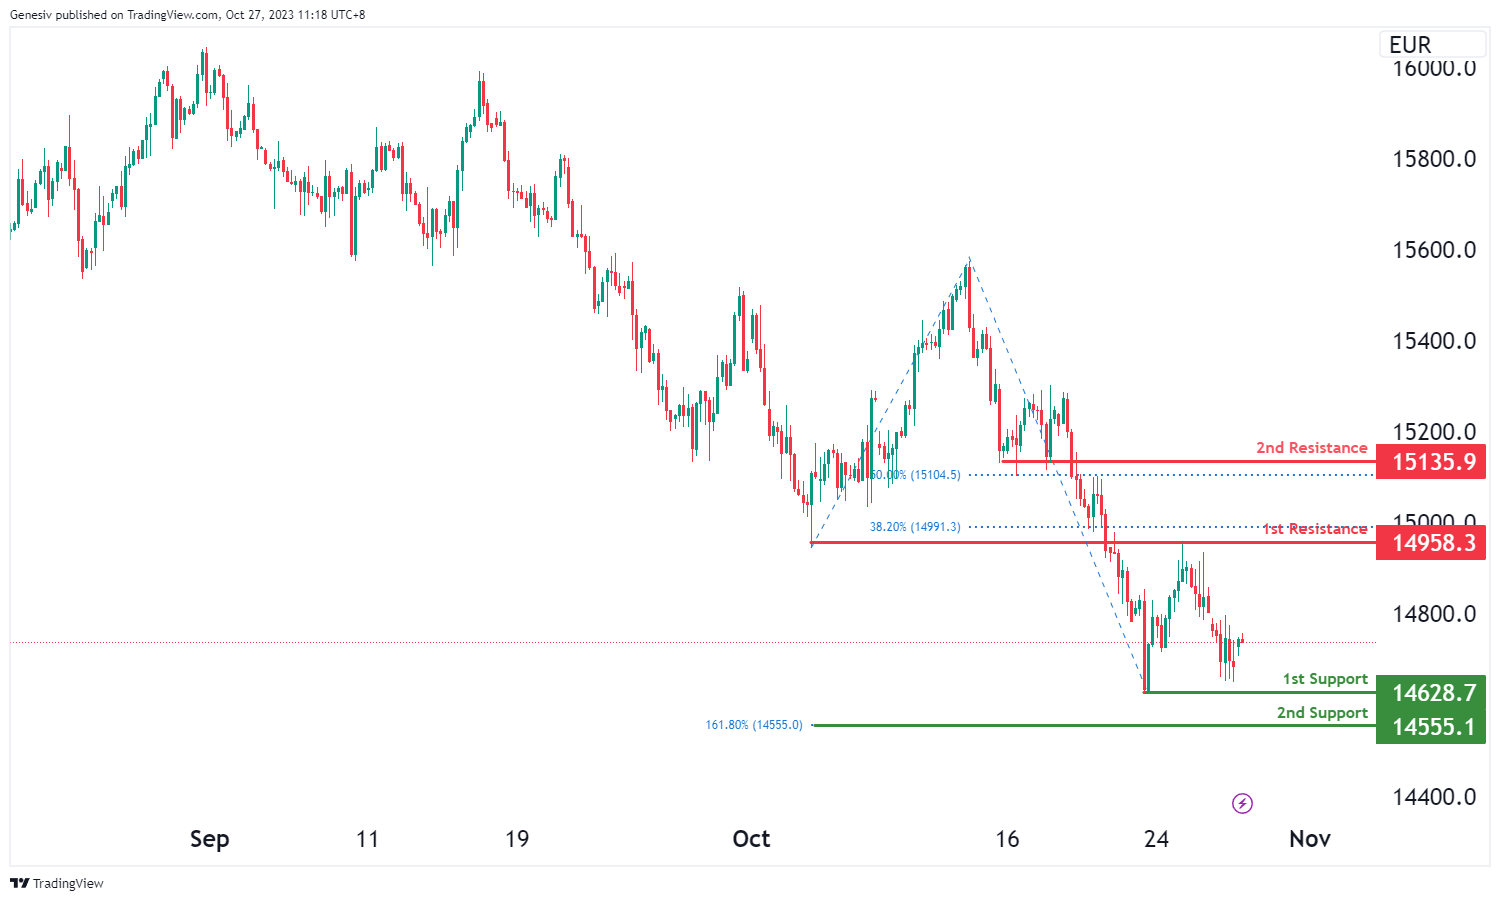
For GER40, the chart currently reflects a neutral overall momentum, indicating that the price could potentially fluctuate between the first resistance at 14958.30 and the first support at 14628.70.
The first support at 14628.70 is considered strong due to its swing low support characteristics, while the second support at 14555.10 is significant due to the presence of the 161.80% Fibonacci Extension.
On the resistance side, the first resistance at 14958.30 is noteworthy for its overlap resistance characteristics and the presence of the 38.20% Fibonacci Retracement, making it a notable level of resistance. The second resistance at 15135.90 is marked by pullback resistance and the presence of the 50% Fibonacci Retracement, making it another important level of resistance.
`US500
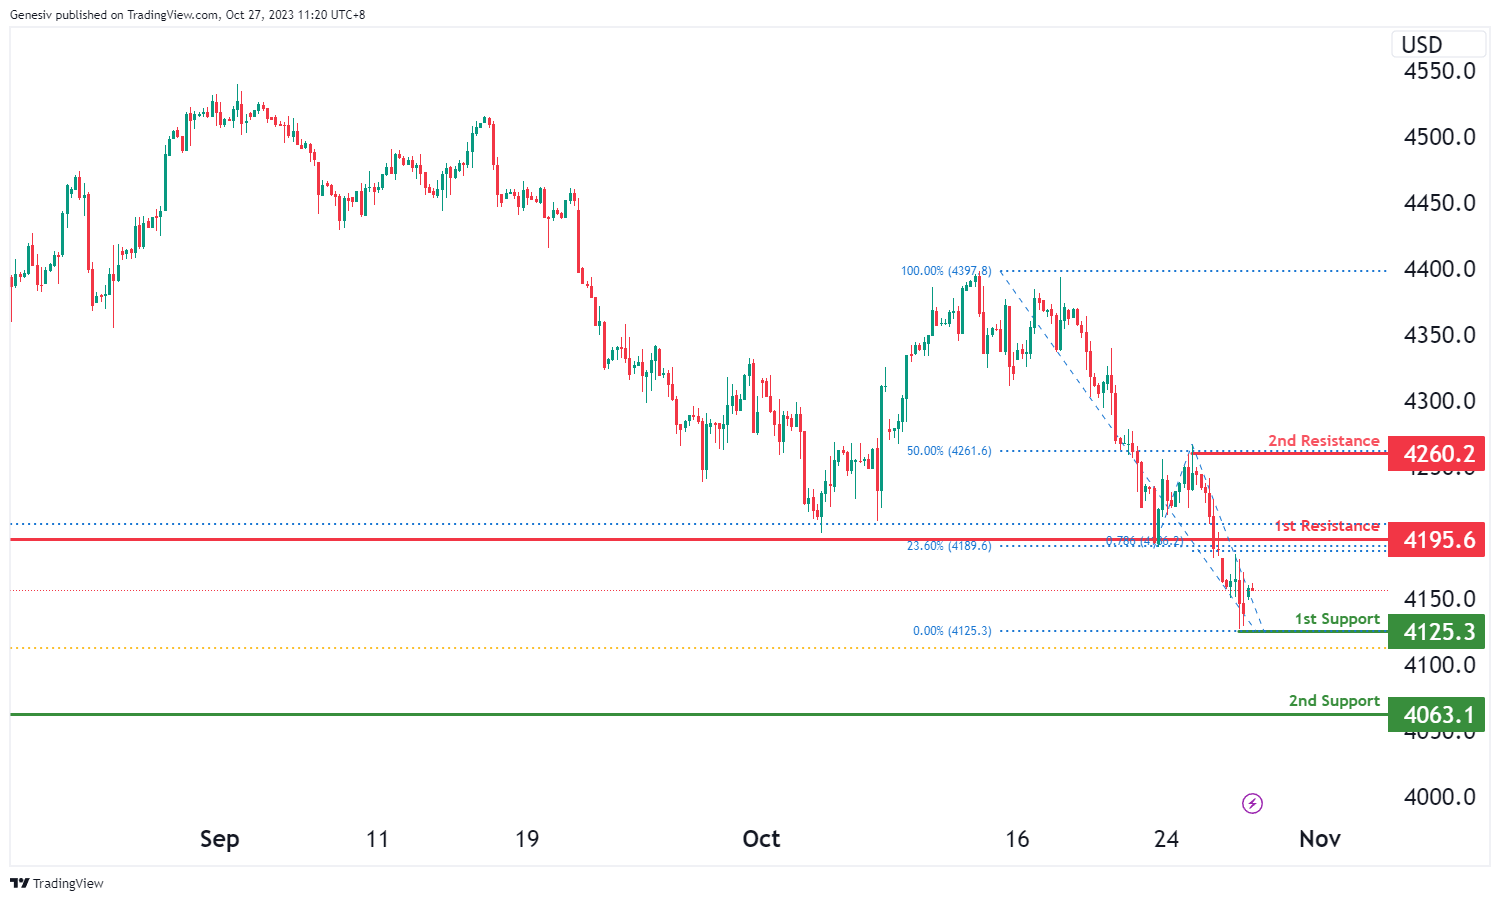
For US500, the chart currently exhibits a bearish overall momentum, suggesting that the price could potentially continue in a bearish direction towards the first support at 4125.3.
The first support at 4125.3 is considered strong due to its swing low support characteristics and the presence of the 61.80% Fibonacci Retracement, making it a significant level of potential support.
The second support at 4063.1 is also significant as it features overlap support.
On the resistance side, the first resistance at 4195.6 is noteworthy for its pullback resistance characteristics, and it also involves the 23.60% Fibonacci Retracement and the 78.60% Fibonacci Projection, indicating Fibonacci confluence and making it a substantial level of resistance.
The second resistance at 4260.2 is marked by swing high resistance and is associated with the 50% Fibonacci Retracement, making it another important level of resistance.
BTC/USD:
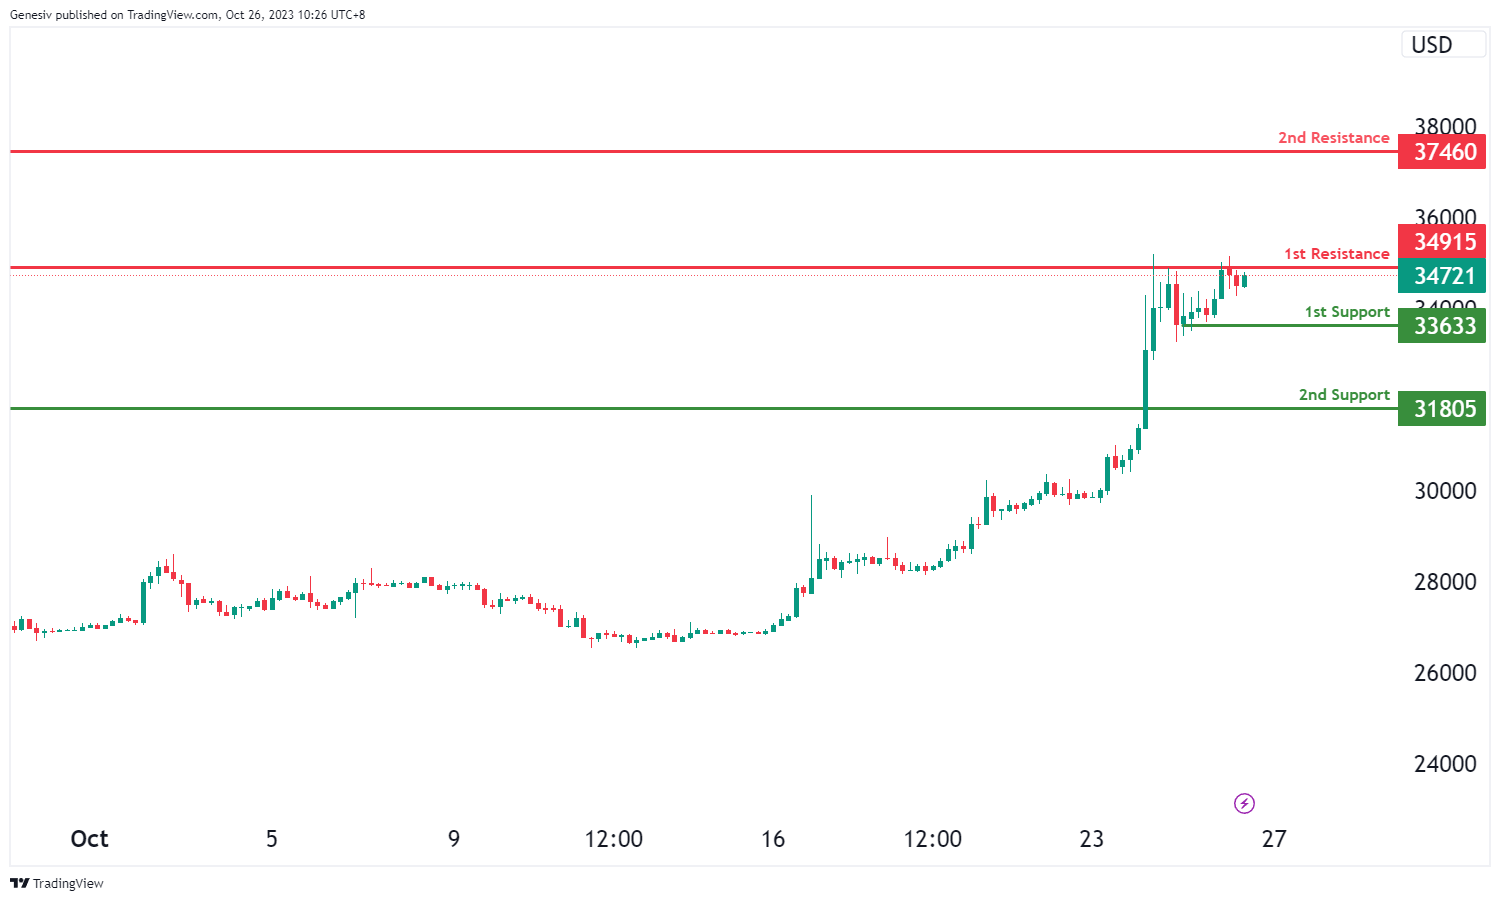
For BTC/USD, the chart currently indicates a bullish overall momentum, suggesting that the price may potentially experience a bullish bounce off the first support at 33633 and head towards the first resistance at 34915.
The first support at 33633 is considered strong due to its swing low support characteristics. The second support at 31805 is also significant, as it provides pullback support.
On the resistance side, the first resistance at 34915 is noteworthy for its overlap resistance characteristics, indicating a substantial level of resistance. The second resistance at 37460 is marked by pullback resistance, making it another important level of resistance.
ETH/USD:
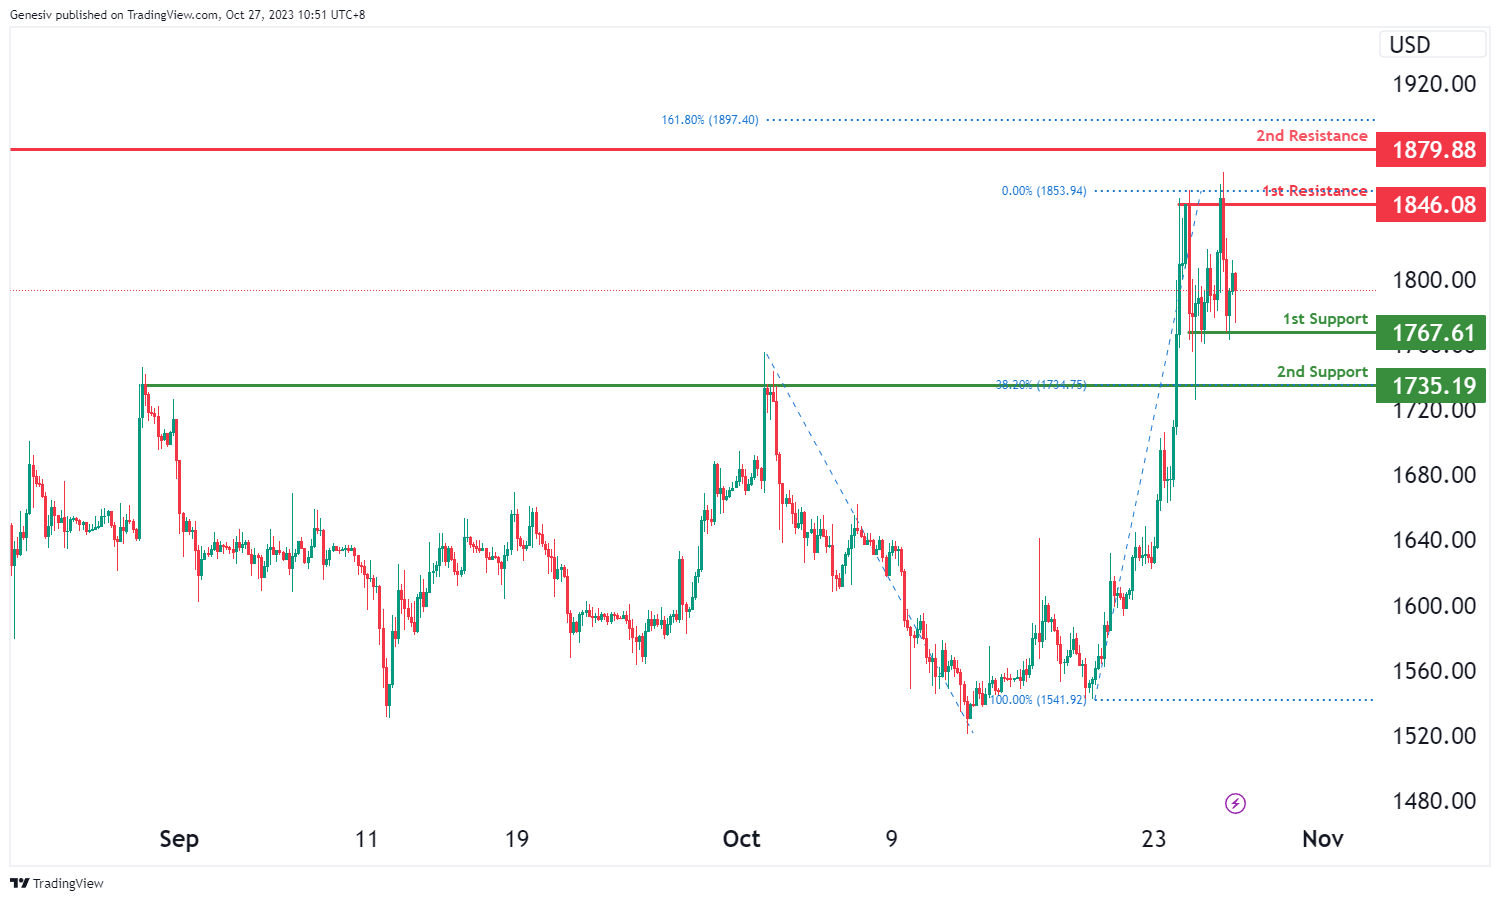
For ETH/USD, the chart currently indicates a bullish overall momentum, suggesting that the price may potentially experience a bullish bounce off the first support at 1767.61 and head towards the first resistance at 1846.08.
The first support at 1767.61 is considered strong due to its multi-swing low support characteristics. The second support at 1735.19 is also significant, as it provides pullback support and is associated with the 38.20% Fibonacci Retracement.
On the resistance side, the first resistance at 1846.08 is noteworthy for its multi-swing high resistance characteristics, indicating a substantial level of resistance. The second resistance at 1879.88 is marked by multi-swing high resistance and is associated with the 161.80% Fibonacci Extension, making it another important level of resistance.
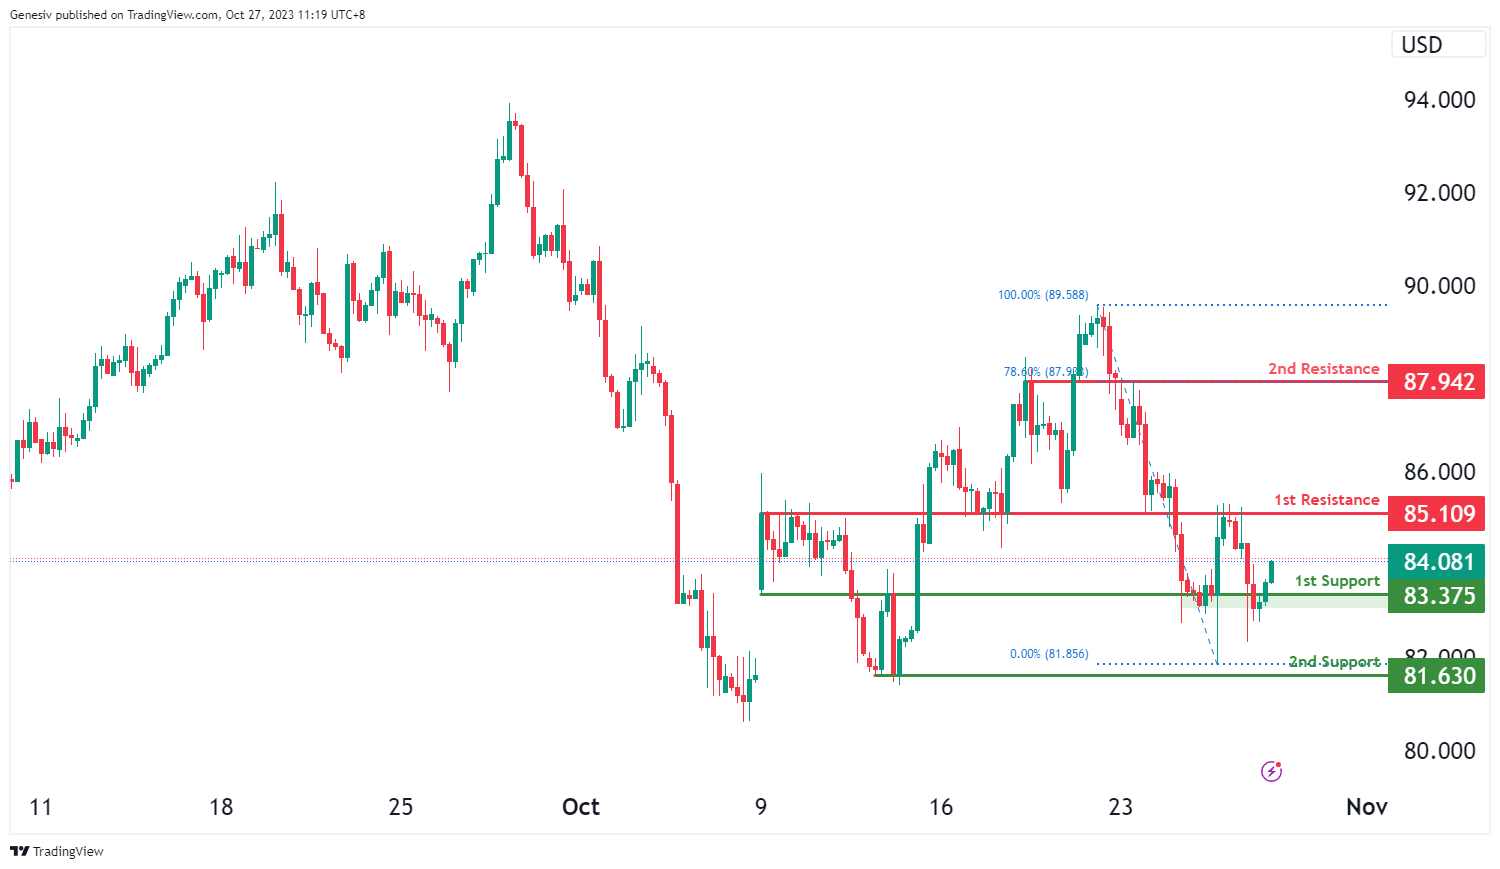
WTI/USD:
The WTI chart currently exhibits an overall bullish momentum, indicating a potential scenario for price to make a bullish continuation towards the 1st resistance level.
The 1st resistance level at 85.11 is identified as an overlap resistance. Beyond this, the 2nd resistance level at 87.94 is also noted as an overlap resistance that aligns with the 78.60% Fibonacci retracement level, making it a potentially strong resistance level.
To the downside, the 1st support level at 83.38 is identified as an overlap support. Further below, the 2nd support level at 81.63 is also marked as a swing-low support, indicating a potential support zone.
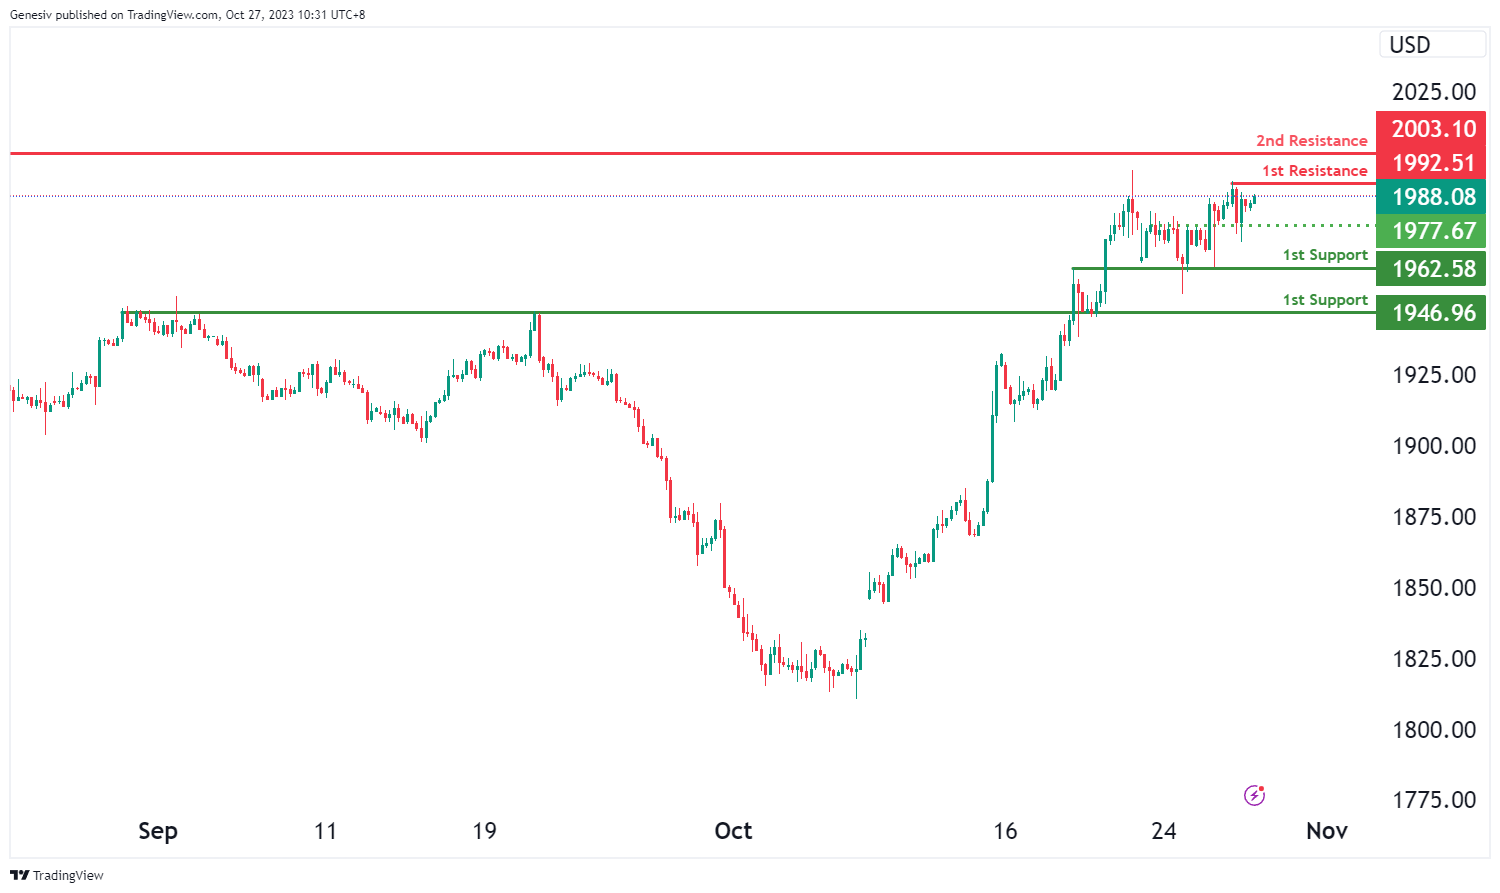
XAU/USD (GOLD):
The XAU/USD (Gold/US Dollar) chart currently demonstrates bullish momentum, suggesting the potential for a bullish continuation towards the 1st resistance level at 1992.51.
The 1st support at 1962.58 is considered significant as it aligns with an overlap support, indicating its potential to act as a strong support level. Additionally, the 2nd support level at 1946.96 is also identified as an overlap support, reinforcing the potential support zone.
On the resistance side, the 1st resistance at 1992.51 is characterized as a multi-swing high resistance, implying that it could pose a significant obstacle to any notable upward price movement in the bullish direction. Furthermore, the 2nd resistance at 2003.10 is identified as a swing high resistance, indicating another potential level where the price may face resistance.
An intermediate support level is also observed at 1977.67, labeled as a pullback support. This level may serve as a temporary resting point for the price during its bullish trajectory.
The accuracy, completeness and timeliness of the information contained on this site cannot be guaranteed. IC Markets does not warranty, guarantee or make any representations, or assume any liability regarding financial results based on the use of the information in the site.
News, views, opinions, recommendations and other information obtained from sources outside of www.icmarkets.com, used in this site are believed to be reliable, but we cannot guarantee their accuracy or completeness. All such information is subject to change at any time without notice. IC Markets assumes no responsibility for the content of any linked site.
The fact that such links may exist does not indicate approval or endorsement of any material contained on any linked site. IC Markets is not liable for any harm caused by the transmission, through accessing the services or information on this site, of a computer virus, or other computer code or programming device that might be used to access, delete, damage, disable, disrupt or otherwise impede in any manner, the operation of the site or of any user’s software, hardware, data or property.


