
EUR/USD:
In recent sessions, we saw the single currency peak at 1.2537 after ECB’s President Mario Draghi appeared upbeat regarding the economy during the latest press conference. Going into the last hours of the US session on Thursday, however, H4 price plunged below the 1.24 handle following comments from President Trump, saying that his administration ultimately wants to see a stronger US dollar.
From a technical standpoint, weekly action is seen pulling back within the walls of a weekly supply zone coming in at 1.2569-1.2287. Also worthy of note is the US dollar index monthly support at 88.50 which was brought into the mix yesterday, and aligns beautifully with a monthly 61.8% Fib support at 88.48.
Daily price, on the other hand, connected with a daily Quasimodo resistance plotted at 1.2495 yesterday, and chalked up a strong-looking selling wick. Nearby daily support is seen at 1.2359.
With buyers likely being cleared from 1.24 as we write, we see little support structure on the H4 timeframe stopping price from shaking hands with the 1.23 line (see converging H4 trendline support taken from the low 1.2165).
Market direction:
On account of the current technical picture, further downside could be upon us. Daily support mentioned above at 1.2359 will likely be the first port of call, followed then by the 1.23 barrier.
To take advantage of this move, watch for H4 price to retest the underside of 1.24, and look to trade any retest thereafter. To trade within a respectable risk/reward range, nevertheless, drilling down to the lower timeframes to pin down an entry may be required, as you will want at least a 1:1 ratio before hitting daily support.
Data points to consider: EUR M3 money supply y/y at 9am; US advance GDP q/q, US core durable goods orders m/m at 1.30pm GMT.

Areas worthy of attention:
Supports: 1.23 handle; 1.2359.
Resistances: 1.2569-1.2287; 1.2495; 1.25 handle.
GBP/USD:
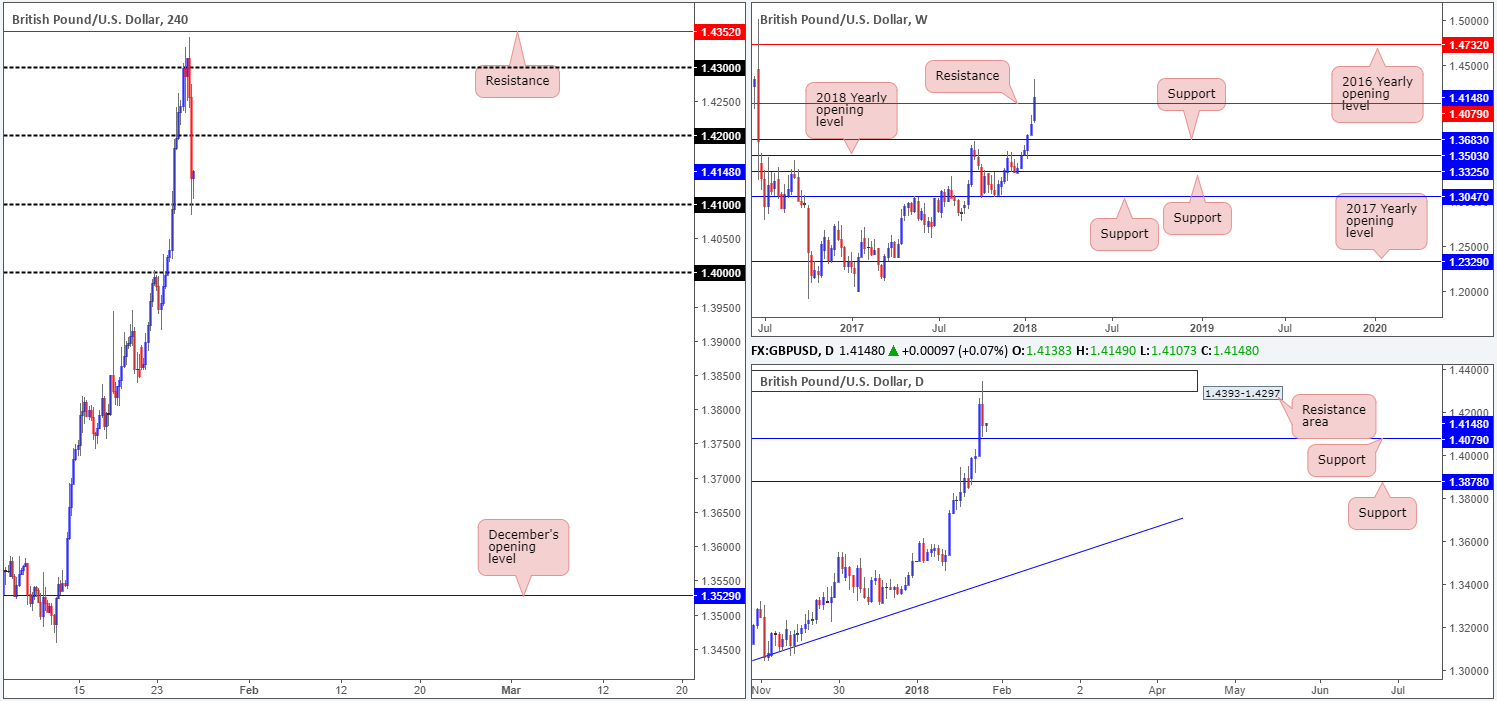
Leaving the H4 resistance at 1.4352 unchallenged, the British pound changed course as we entered into Thursday’s US segment. The selloff intensified a few hours later, following comments from US President Trump saying that his administration wants a stronger dollar. This came at a time when the US dollar index was trading from a solid monthly support at 88.50. The day ended with the GBP mildly paring losses from the 1.41 handle.
The other key areas to note are the daily resistance area at 1.4393-1.4297, which houses the H4 resistance level mentioned above at 1.4352, and weekly resistance at 1.4079.
Market direction:
To confirm a bearish bias, a decisive push below daily support at 1.4079 is required. This will show the weekly resistance level also at 1.4079 is back in play, and possibly promote selling back down to the large psychological band 1.40 on the H4 timeframe, and perhaps down as far as the daily support coming in at 1.3878.
Data points to consider: UK prelim GDP q/q at 9.30am; BoE Gov. Carney speaks at 2pm; US advance GDP q/q, US core durable goods orders m/m at 1.30pm GMT.
Areas worthy of attention:
Supports: 1.41 handle; 1.4079.
Resistances: 1.4352; 1.4393-1.4297; 1.42 handle.
AUD/USD:
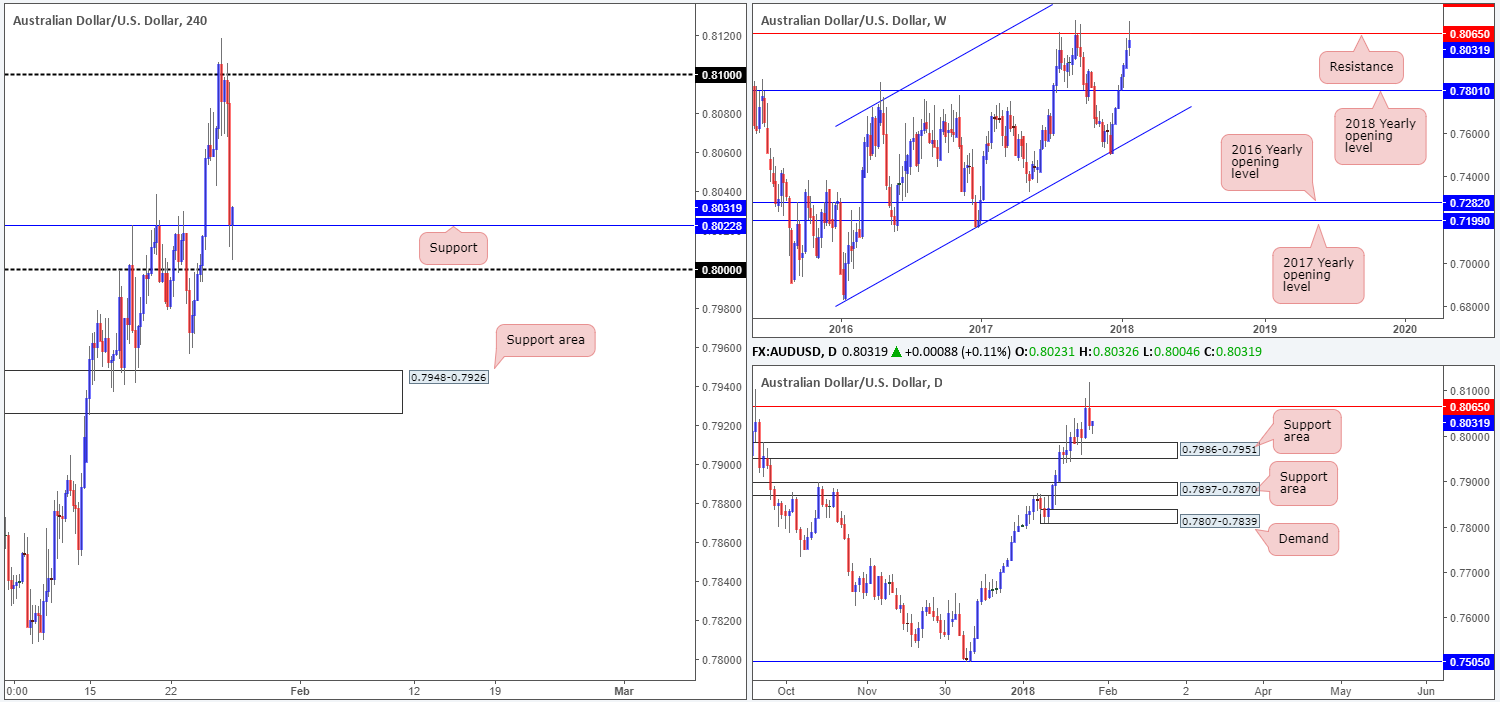
The commodity-linked currency came under pressure amid US trading on Thursday, following comments from US President Trump saying that his administration ultimately wants to see a stronger US dollar.
After failing to generate much follow through beyond the 0.81 handle on the H4 timeframe, the pair exploded to the downside and concluded the day connecting with a H4 support at 0.8022. While there was a clear driver to yesterday’s move, let’s keep in mind that weekly price is seen trading from a formidable weekly resistance marked at 0.8065, along with the US dollar index recently connecting with a major monthly support at 88.50. Also notable is the nearby daily support area drawn from 0.7986-0.7951, which could hinder downside should the unit decide to print additional losses.
Market direction:
H4 support at 0.8022 is holding for the time being. With the large psychological number 0.80 seen 20 pips below, though, price is likely to drop to challenge buyers here. 0.80, coupled with the top edge of the noted daily support area at 0.7986, will likely prove difficult to overcome today, despite weekly price generating momentum from weekly resistance.
Although we do not expect 0.80/0.7986 to be an easy support to consume, we do feel that the Aussie is ultimately heading lower in the weeks to come. The market is seriously overbought and has ‘pullback’ written all over it – even more so now we’re trading from weekly resistance!
Data points to consider: Aussie banks closed in observance of Australia Day; US advance GDP q/q, US core durable goods orders m/m at 1.30pm GMT.
Areas worthy of attention:
Supports: 0.80 handle; 0.8022; 0.7986-0.7951.
Resistances: 0.8065; 0.81 handle.
USD/JPY:
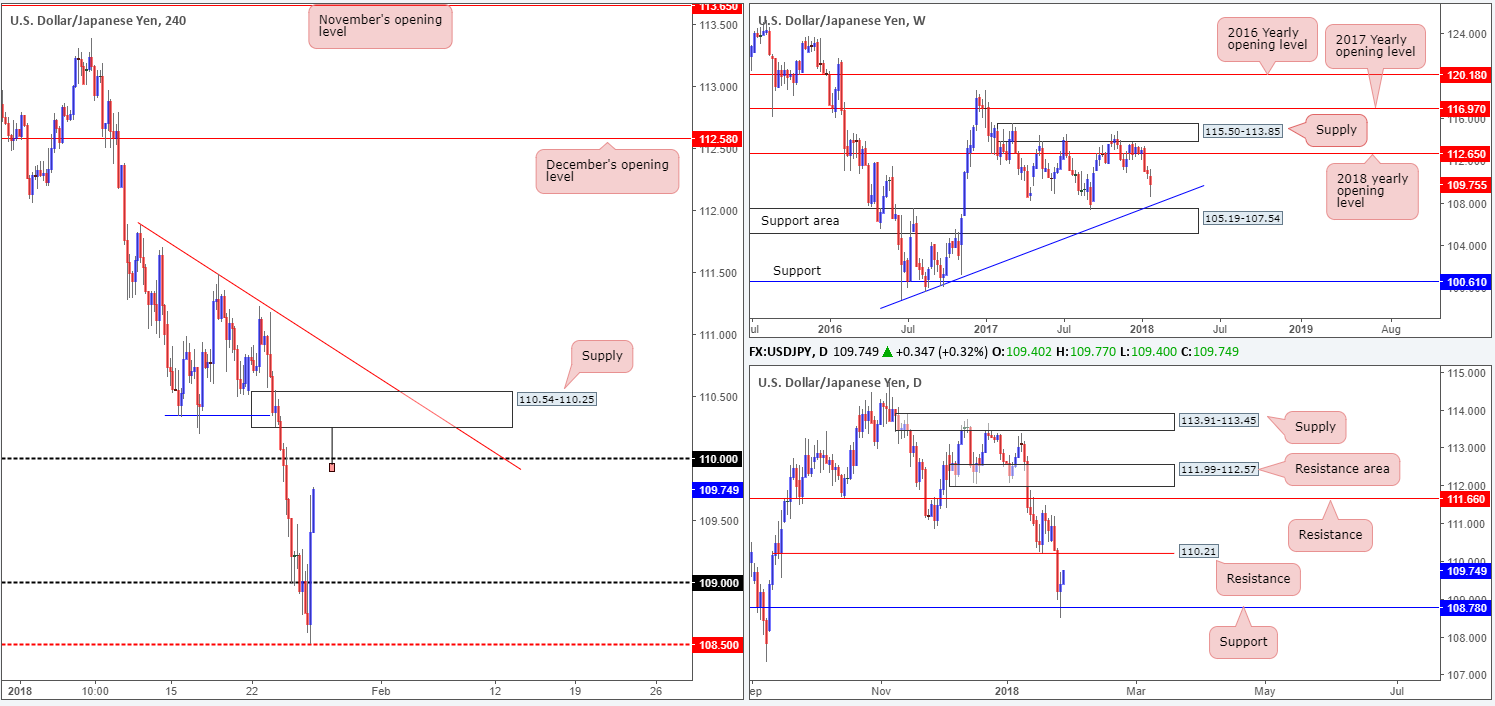
In the later hours of US trading on Thursday, the USD/JPY pair printed a sharp recovery from the H4 mid-level support at 108.50, erasing daily losses and reaching a high of 109.70. The main driver behind yesterday’s buying, other than daily price trading from support at 108.78 and the US dollar index connecting with a monthly support at 88.50, was comments from US President trump regarding strength of the US dollar.
As you can see from the H4 timeframe, price is currently trading in the direction of the 110 handle. This number, alongside oncoming daily resistance at 110.21, will likely hinder upside. In addition to these two levels, we also see a H4 supply area formed at 110.54-110.25. We like this zone because it formed on the BREAK of a H4 Quasimodo support at 110.32 (blue line).
Market direction:
From current price, further buying is likely to be seen, at least until we reach the 110 handle. Between 110.54 and 110 is an area we believe active sellers will likely make an appearance.
An ideal sell signal, in our view, would be a H4 selling wick that penetrates through 110 and connects with the underside of the above noted H4 supply (see H4 chart). That way stop-loss orders above 110 would be filled and therefore provide liquidity to those wishing to sell from the H4 supply. One could look jump aboard following the close of the candle, with stops either placed above the candle’s wick or above the H4 supply itself. The first target objective from here can be set at 109.
Data points to consider: US advance GDP q/q, US core durable goods orders m/m at 1.30pm; BoJ Gov. Kuroda speaks at 2pm GMT.
Areas worthy of attention:
Supports: 108.50; 109 handle; 108.78.
Resistances: 110.54-110.25; 110 handle; 110.21.
USD/CAD:
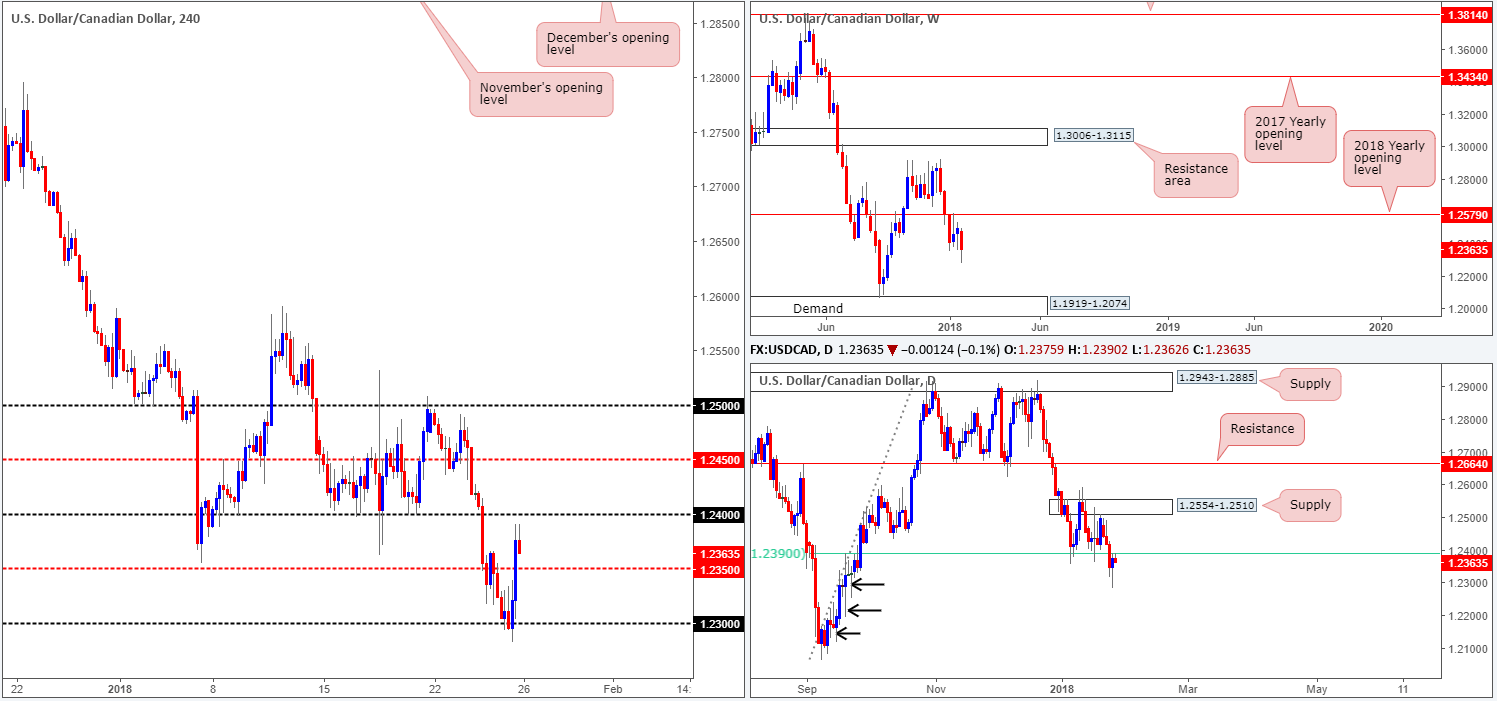
Amid US trading on Thursday, we saw a healthy correction from the 1.23 handle on the back of US President Trump’s comments regarding the US dollar. The move broke through the H4 mid-level resistance at 1.2350 and reached a high of 1.2390.
1.2390, as you can see on the daily timeframe, represents a daily 61.8% Fib support-turned resistance. In the short term, a continued bout of selling from this angle will likely drag the unit back down to the 1.2350 region.
Looking at this market from the weekly timeframe, it is clear to see that downside is reasonably free of support. We know there’s a lot of ground to cover, but the unit could potentially stretch as far south as the weekly demand base coming in at 1.1919-1.2074.
Zooming in for a closer look at the daily timeframe, below 1.2390 there’s little support in view. Note the clear daily buying tails marked with black arrows at 1.2253, 1.2194 and 1.2118. These, to us, resemble consumption of unfilled buy orders.
Market direction:
Despite the US dollar index showing strong support from 88.50, both weekly and daily structure on the USD/CAD indicate further selling could be on the cards.
We expect 1.2350 to come into the fray shortly. However, this is not a level we would label a high-probability buy zone, due to higher-timeframe structure.
Right now, we see little on the table as far as trading setups go.
Data points to consider: US advance GDP q/q, US core durable goods orders m/m at 1.30pm; CAD inflation figures at 1.30pm GMT.
Areas worthy of attention:
Supports: 1.23 handle; 1.2350; 1.1919-1.2074.
Resistances: 1.24 handle; 1.2390.
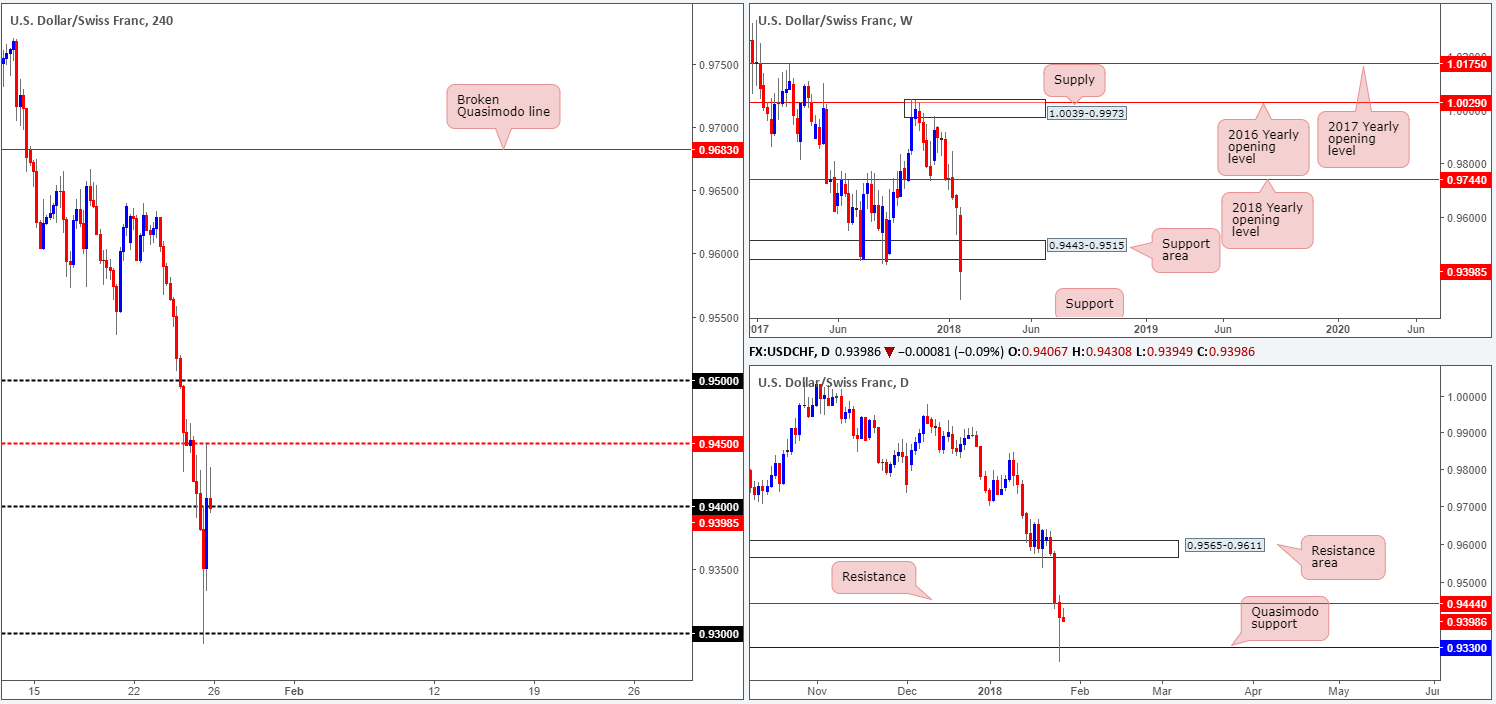
USD/CHF:
The USD/CHF, as you can see, aggressively rotated from the 0.93 handle (H4 timeframe) during the later hours of US trading on Thursday. As highlighted above, this was largely due to comments made by US President Trump concerning the strength of the US dollar. The move pressured through the 0.94 handle and touched gloves with the H4 mid-level resistance at 0.9450. In recent hours, the unit revisited the 0.94 handle and is attempting to break lower. This downside pressure is helping the EUR/USD remain buoyant above 1.24.
Higher-timeframe action saw weekly price burst through a weekly support area coming in at 0.9443-0.9515 yesterday, potentially setting the stage for further selling down to weekly support at 0.9163 (not seen on the screen). On the daily timeframe, we can see that yesterday’s movement checked in with a daily Quasimodo support at 0.9330, and is now seen trading within touching distance of a recently breached daily support-turned resistance at 0.9444.
Market direction:
The reaction from the aforementioned daily Quasimodo support is notable. But is it enough to encourage buyers to bid this market higher? It could be considering that the US dollar index shows strong monthly support coming in from 88.50. For us to register a bullish bias, though, a close above the nearby daily resistance would need to be seen (basically, we’re looking for 0.94 to hold firm and close above 0.9450 on a H4 basis).
Data points to consider: US advance GDP q/q, US core durable goods orders m/m at 1.30pm GMT.
Areas worthy of attention:
Supports: 0.93/4 handle; 0.9330; 0.9163.
Resistances: 0.9450; 0.9444.
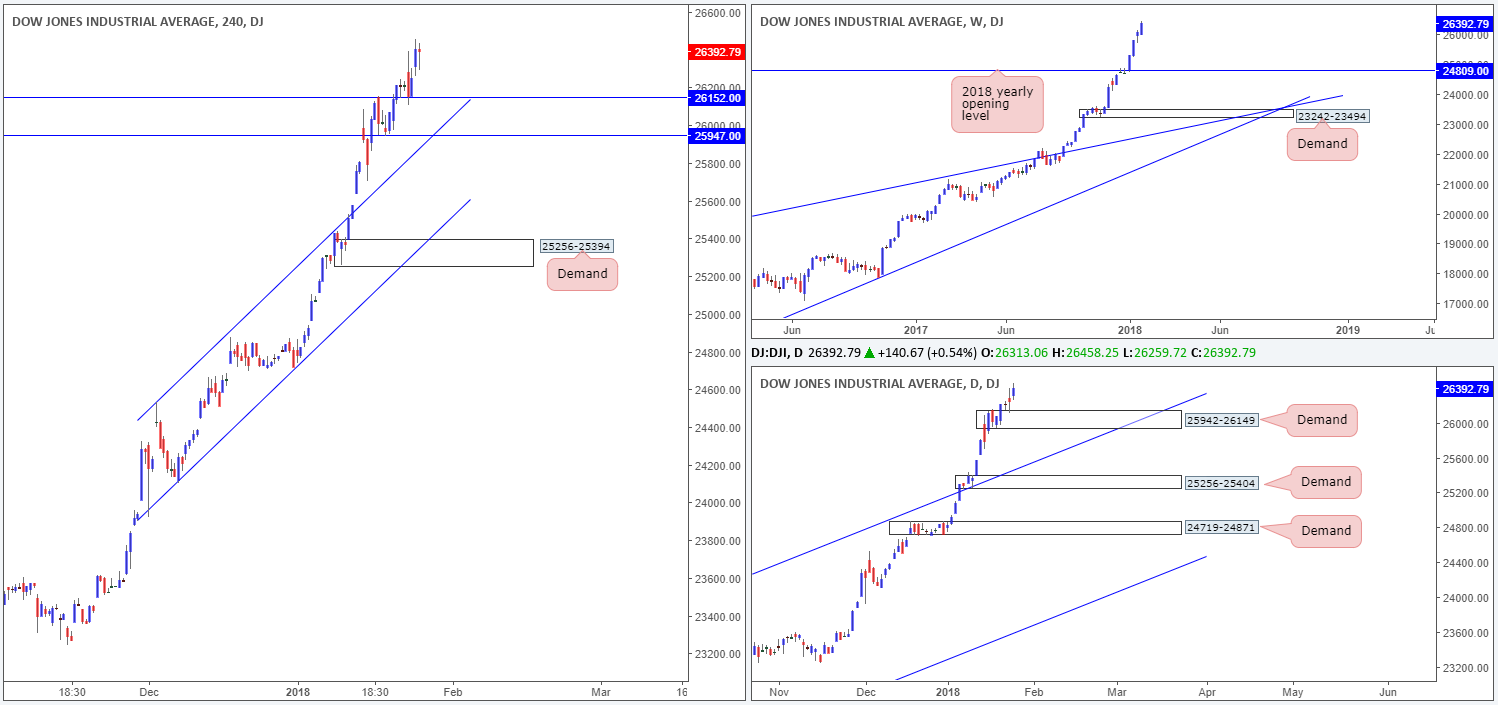
DOW 30:
Following Wednesday’s retest of H4 support at 26152 (in the shape of a near-full-bodied H4 bull candle), US stocks extended higher on Thursday, registering a fresh record high of 26458. Well done to any of our readers who took advantage of this move!
A pullback on the weekly timeframe could see the index dip as low as the 2018 yearly opening level at 24809. The next port of support on the daily timeframe, however, can be seen in the form of a daily demand area at 25942-26149. A violation of this line would open the floor to a potential test of the daily channel support extended from the high 21169.
Market direction:
Further upside remains the favored position.
Near term, the following levels remain of interest:
- The current H4 support at 26152. A second retest of this level, followed up with a H4 full or near-full-bodied bull candle, would, in our view, be enough to warrant a buy.
- The broken H4 channel resistance-turned support taken from the high 24535 and H4 support at 25947.
Data points to consider: US advance GDP q/q, US core durable goods orders m/m at 1.30pm GMT.
Areas worthy of attention:
Supports: 26152; 25947; H4 channel support; 24809; 25942-26149; Daily channel support.
Resistances: …
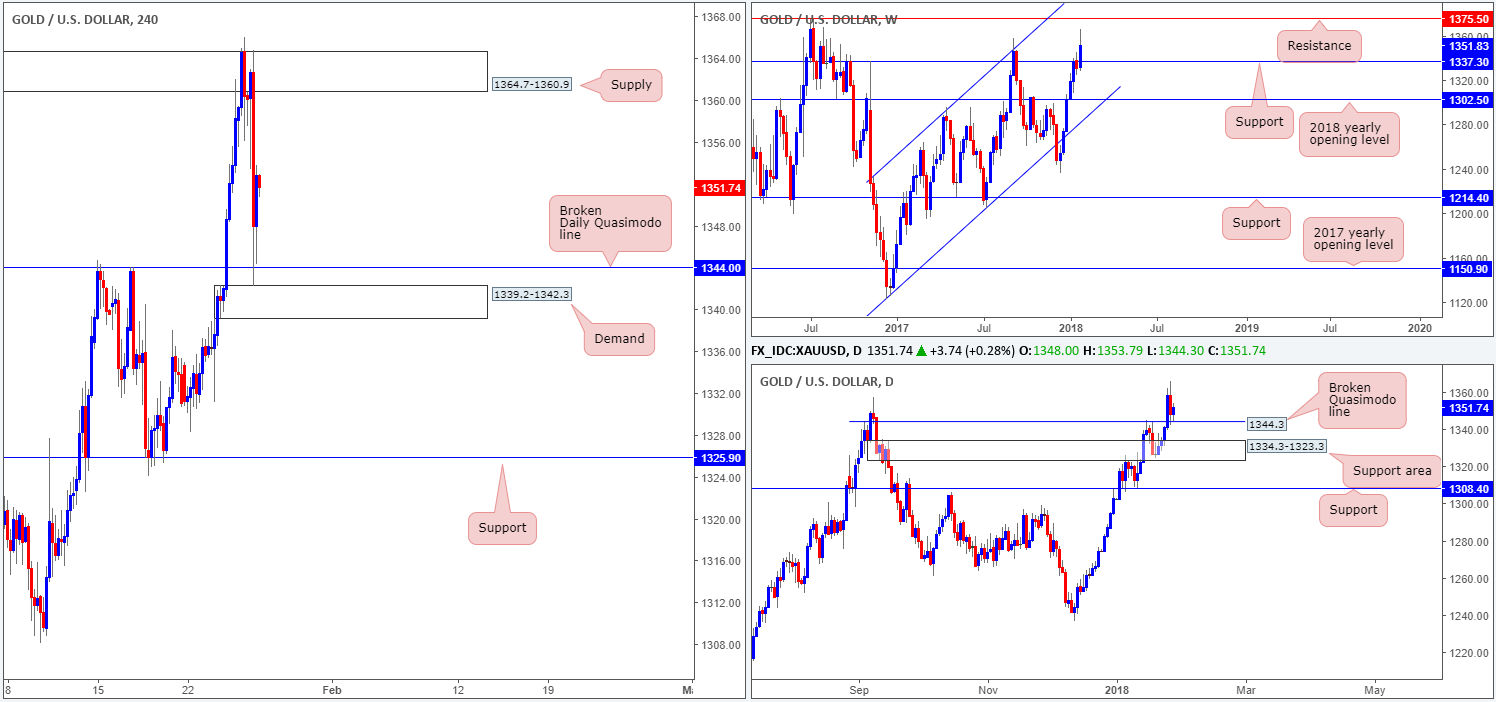
GOLD:
During the course of yesterday’s segment, the price of gold was met with strong selling from H4 supply at 1364.7-1360.9. Following comments from US President Trump regarding the strength of the US dollar, the currency rallied and thereby forced the yellow metal lower. As you can see on the H4 timeframe, the move saw price marginally whipsaw through a daily broken Quasimodo line at 1344.0 and touch the top edge of a H4 demand base at 1339.2-1342.3.
Despite this recent bout of selling, we do not see much active supply to the left of current price (check it out for yourself – note the wicks stabbing into supply before dropping lower) on the daily timeframe until price hits weekly resistance at 1375.5. The only grumble here, however, is the fact that there is a monthly support seen in play on the US dollar index at 88.50.
Market direction:
Taking into account how close weekly price came to connecting with weekly resistance at 1375.5, along with possible dollar buying from the USDX monthly support at 88.50, sellers could enter the fray. On the other hand, the price of gold remains in a strong uptrend at the moment and is currently testing a daily broken Quasimodo line at 1344.0, which are notoriously high-probability levels!
As is evident from the above, neither a long nor short seems attractive at the moment. Irrespective of the direction one selects, oncoming higher-timeframe structure is a clear problem!
Areas worthy of attention:
Supports: 1339.2-1342.3; 1344.0.
Resistances: 1364.7-1360.9; 1375.5.
This site has been designed for informational and educational purposes only and does not constitute an offer to sell nor a solicitation of an offer to buy any products which may be referenced upon the site. The services and information provided through this site are for personal, non-commercial, educational use and display. IC Markets does not provide personal trading advice through this site and does not represent that the products or services discussed are suitable for any trader. Traders are advised not to rely on any information contained in the site in the process of making a fully informed decision.
This site may include market analysis. All ideas, opinions, and/or forecasts, expressed or implied herein, information, charts or examples contained in the lessons, are for informational and educational purposes only and should not be construed as a recommendation to invest, trade, and/or speculate in the markets. Any trades, and/or speculations made in light of the ideas, opinions, and/or forecasts, expressed or implied herein, are committed at your own risk, financial or otherwise.
The use of the site is agreement that the site is for informational and educational purposes only and does not constitute advice in any form in the furtherance of any trade or trading decisions.
The accuracy, completeness and timeliness of the information contained on this site cannot be guaranteed. IC Markets does not warranty, guarantee or make any representations, or assume any liability with regard to financial results based on the use of the information in the site.
News, views, opinions, recommendations and other information obtained from sources outside of www.icmarkets.com.au, used in this site are believed to be reliable, but we cannot guarantee their accuracy or completeness. All such information is subject to change at any time without notice. IC Markets assumes no responsibility for the content of any linked site. The fact that such links may exist does not indicate approval or endorsement of any material contained on any linked site.
IC Markets is not liable for any harm caused by the transmission, through accessing the services or information on this site, of a computer virus, or other computer code or programming device that might be used to access, delete, damage, disable, disrupt or otherwise impede in any manner, the operation of the site or of any user’s software, hardware, data or property.


