
A note on lower timeframe confirming price action…
Waiting for lower timeframe confirmation is our main tool to confirm strength within higher timeframe zones, and has really been the key to our trading success. It takes a little time to understand the subtle nuances, however, as each trade is never the same, but once you master the rhythm so to speak, you will be saved from countless unnecessary losing trades. The following is a list of what we look for:
- A break/retest of supply or demand dependent on which way you’re trading.
- A trendline break/retest.
- Buying/selling tails/wicks – essentially we look for a cluster of very obvious spikes off of lower timeframe support and resistance levels within the higher timeframe zone.
- Candlestick patterns. We tend to only stick with pin bars and engulfing bars as these have proven to be the most effective.
We search for lower timeframe confirmation between the M15 and H1 timeframes, since most of our higher-timeframe areas begin with the H4. Stops are usually placed 5-10 pips beyond confirming structures.
EUR/USD:
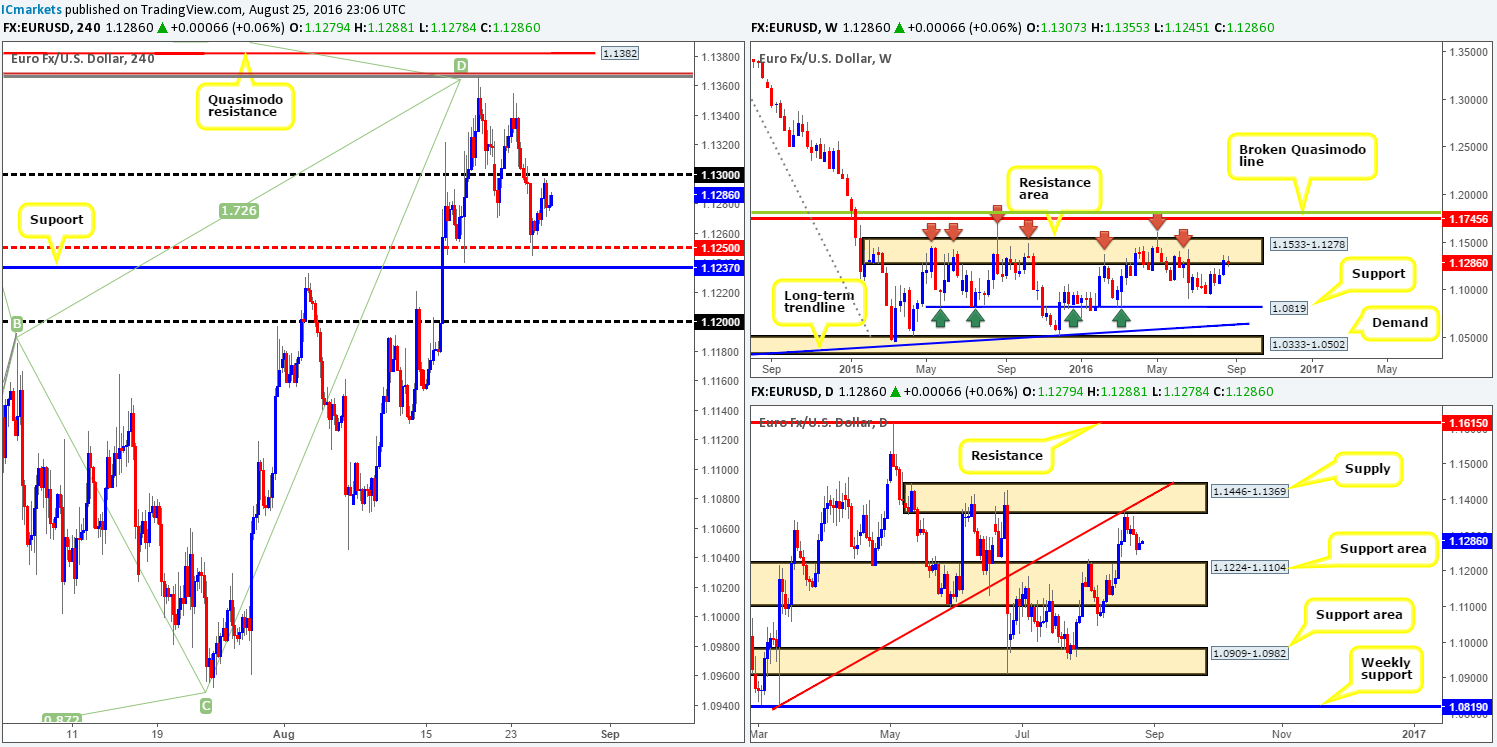
Recent action shows that the single currency extended its bounce from the H4 mid-way support at 1.1250, reaching highs of 1.1297, three pips shy of the psychological boundary 1.13. Despite this, we feel that this market remains overbought, owing to weekly action establishing itself around the lower edge of a resistance area drawn from 1.1533-1.1278. This zone, as you can see from the chart, has managed to cap upside in this market since May 2015 (see red arrows), and is therefore not a barrier to ignore! While this may be true that does not mean this pair is in a position to be sold. Along with the current H4 mid-way support mentioned above, the daily chart also shows that the EUR is seen hovering just ahead of a daily support area coming in at 1.1224-1.1104. Furthermore, today’s direction will likely be based on how investors receive Yellen’s speech later on in regard to the next US interest rate hike.
Our suggestions: In light of the above points one could look to short the 1.13 handle today, with an intraday target of 1.1250. However, we would advise caution given that the market will likely ‘play it safe’ ahead of Yellen’s speech today. This – coupled with the technical picture being what it is, our team has decided to take a back seat until the Fed Chair has had her turn in the spotlight.
Levels to watch/live orders:
- Buys: Flat (Stop loss: N/A).
- Sells: Flat (Stop loss: N/A).
GBP/USD:
The response seen from the underside of the H4 harmonic Gartley reversal zone at 1.3346/1.3263 (green zone) has so far been quite impressive. All of Wednesday’s gains have been erased along with price walloping its way through the 1.32 handle. In addition to this, over on the daily chart we can see that there is room for the pair to push down to at least support coming in at 1.3104. Therefore, from a technical standpoint, assuming that 1.32 holds as resistance this could be an interesting line to short from today, targeting 1.31.
However, from a fundamental standpoint investors will be watching the UK’s GDP release today at 9.30am GMT, and also Yellen’s speech at Jackson Hole in the afternoon.
Our suggestions: While the technical landscape looks relatively clear down to the 1.31 boundary today, we’re not expecting see much volatility ahead of the above noted GDP report. If, on the other hand, we do see price retest 1.32 and hold during Asia, we may, with the backing of a lower timeframe signal (see the top of this report), look to sell. Should this come to fruition, we’ll aim to have stops locked at breakeven prior to the release of above said fundamental reports.

Levels to watch/live orders:
- Buys: Flat (Stop loss: N/A).
- Sells: 1.32 region [Tentative – confirmation required] (Stop loss: dependent on where one confirms this area).
AUD/USD:
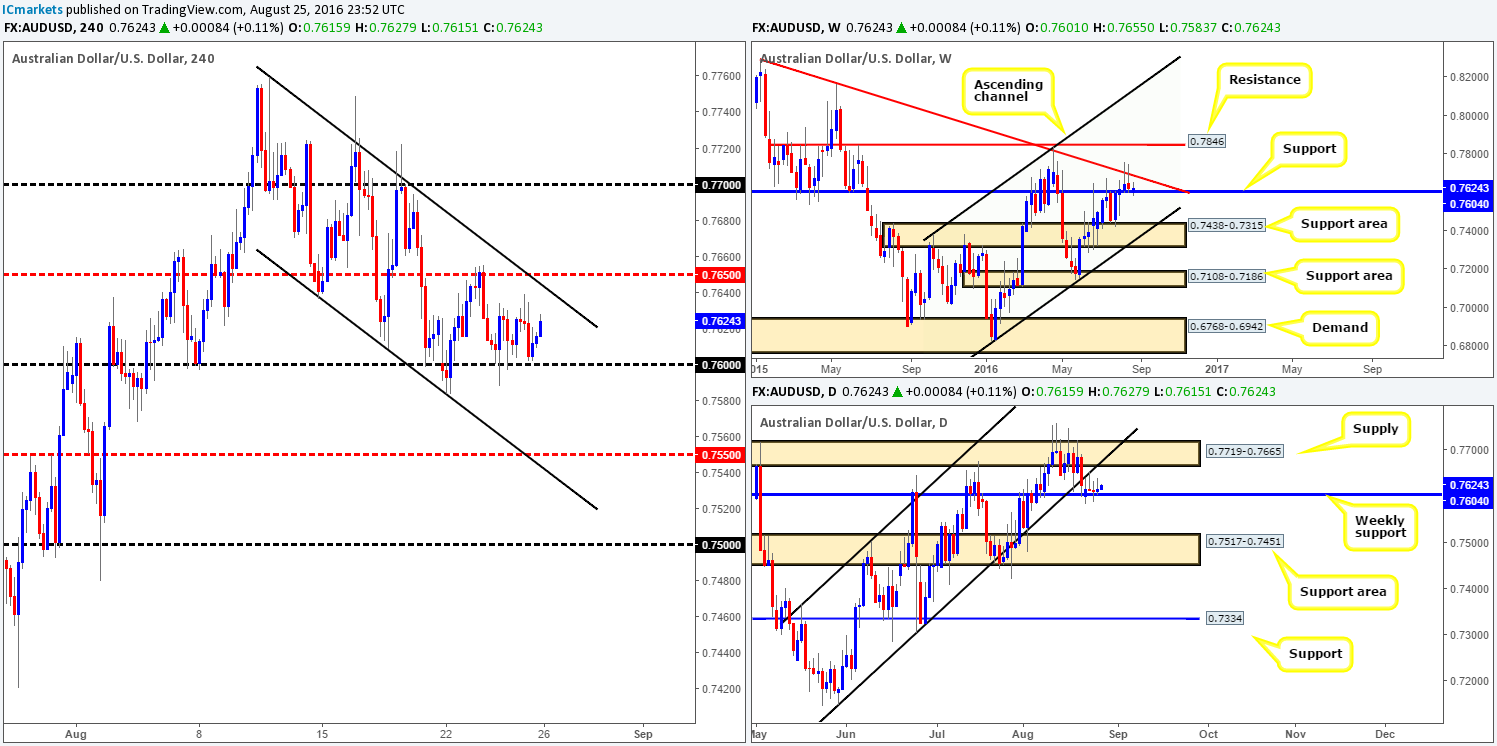
Since Wednesday the Aussie has been trading within a tight range fixed between 0.7627 and the 0.76 handle. Directly above this consolidation lurks the H4 mid-way resistance 0.7650 which unites with a H4 channel resistance extended from the high 0.7759. Meanwhile, below the current range price has the H4 mid-way support 0.7550 to target. With no Aussie data on the docket today, we may see price continue to range as investors will now likely be looking to Yellen’s speech for direction.
Higher-timeframe technicals show that the commodity currency remains indecisive around the current weekly support seen at 0.7604. A close below this barrier could prompt a downside move towards the daily support area at 0.7517-0.7451, which happens to sit on top of a weekly support area coming in at 0.7438-0.7315. A bullish move from here, however, does not have much space to move given a weekly trendline resistance is positioned just above taken from the high 0.8295, along with a daily supply area drawn from 0.7719-0.7665.
Our suggestions: Buying this pair, given the higher-timeframe’s response to the current weekly support is not something we’d stamp high probability. In regard to selling, however, with both the weekly support and the 0.76 handle in play, selling this market is also not something we’d feel comfortable participating in UNTIL we see at least a daily close beyond the weekly support barrier. Therefore, opting to stand on the sidelines until Yellen’s speech is done and dusted may very well be the best path to take today.
Levels to watch/live orders:
- Buys: Flat (Stop loss: N/A).
- Sells: Flat (Stop loss: N/A).
USD/JPY:
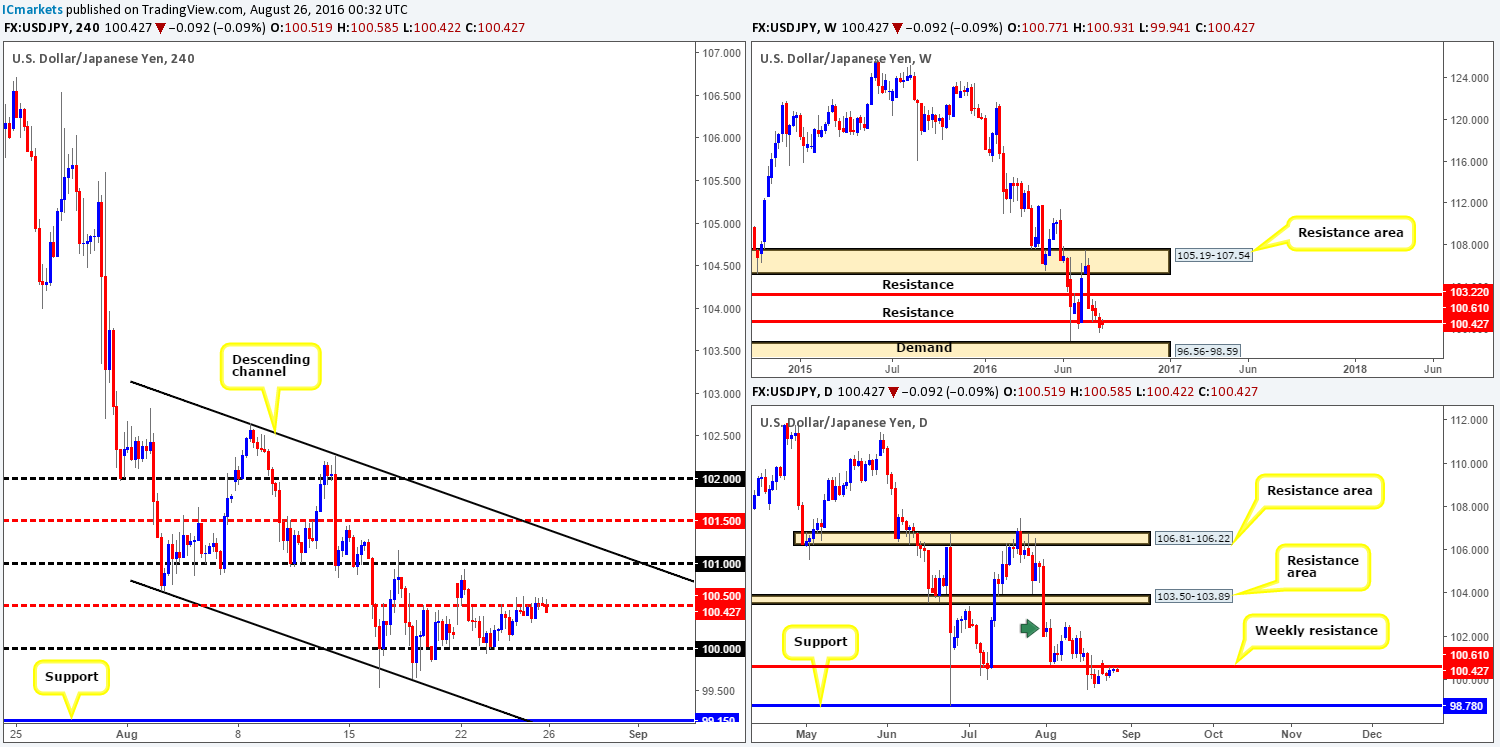
During the course of yesterday’s sessions, the USD/JPY ranged around thirty or so pips as price hugged the underside of the H4 mid-way resistance 100.50. Given that this psychological boundary is positioned within ten pips of the weekly resistance level seen at 100.61, along with the strong downtrend currently in play right now, technically a sell off is expected. Be that as it may, we do not see this pair gathering much momentum until later this afternoon GMT, where investors will look for clues during Yellen’s speech regarding US interest rates.
Our suggestions: As we mentioned above, technically this pair is in a good position to sell off. However, with the spotlight firmly shining on Yellen today, technicals are likely to take a back seat! Therefore, we would advise a cautious stance ahead of the Fed Chair’s speech today.
Levels to watch/live orders:
- Buys: Flat (Stop loss: N/A).
- Sells: Flat (Stop loss: N/A).
USD/CAD:
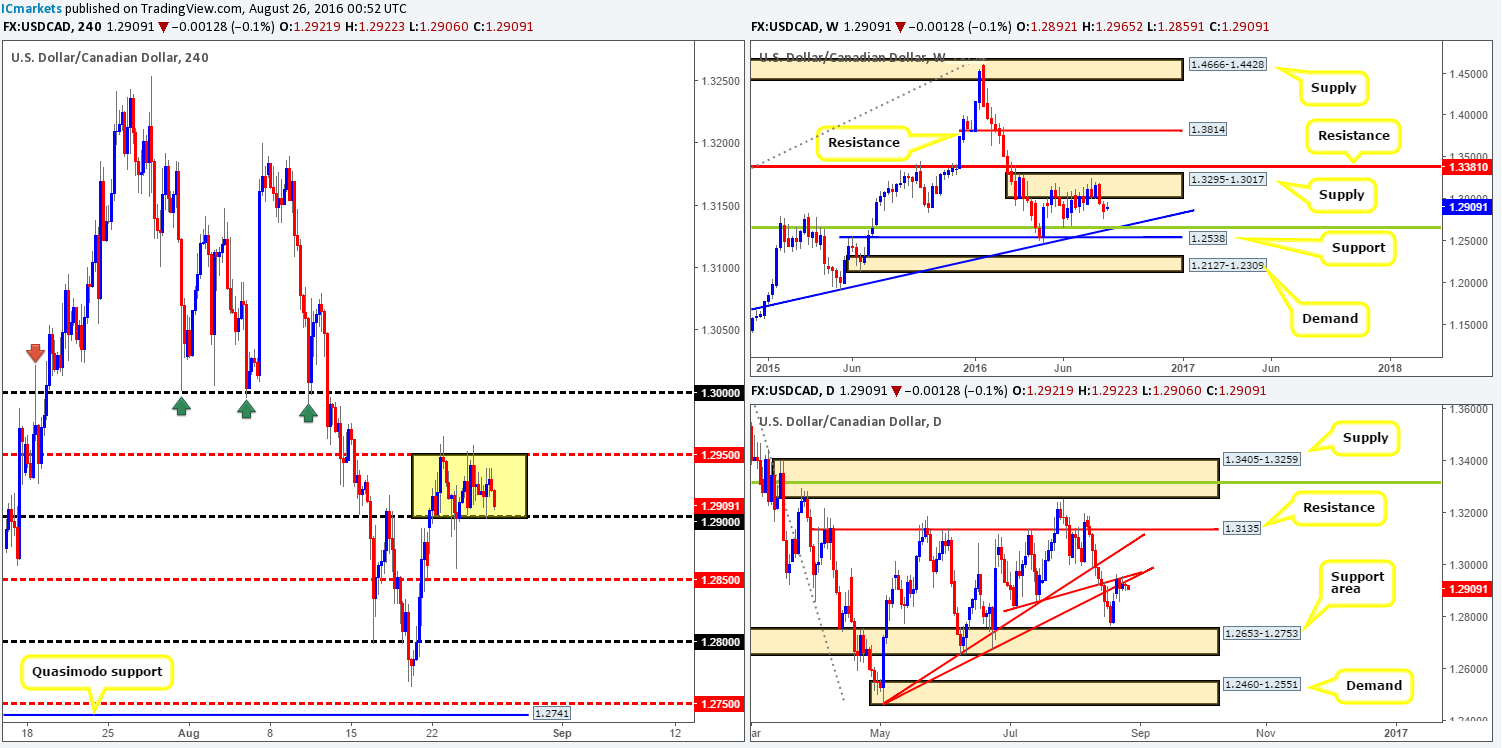
The USC/CAD pair remains on neutral ground this morning as price failed to break out of the current H4 consolidation seen fixed between the H4 mid-way resistance 1.2950 and the 1.29 handle (yellow box). Oil recently began to climb higher, however, which as you can see, has put pressure on the pair now seen trading just ahead of the 1.29 region.
As we mentioned in our previous report, our team has no interest in trading the edges of this newly-formed range. We’re more focused on trading the breakout/retest. In light of daily action currently seen flirting with two daily trendline resistances (1.2460/1.2831) at the moment, this could potentially push the pair down to a support area coming in at 1.2653-1.2753. On top of this, a weekly supply area seen at 1.3295-1.3017 continues to cap upside, with the next downside target seen around a 38.2% Fib support at 1.2658 (located within the lower edge of the above said daily support area and also merges with a weekly trendline support extended from the high 1.1278).
Our suggestions: In that the higher-timeframe technicals suggest lower prices may be on the cards, we’re going to be watching for a close beyond 1.29. To enter short below this number, however, we’d need to see price retest this level as resistance alongside a lower timeframe sell signal (see the top of this report). Assuming that we manage to pin down an entry here, we’d look to trail price using the 1.2850 and 1.28 numbers to hide stops, targeting the 1.2750ish range. Why 1.2750? Well, this is simply because this number represents the top edge of the daily support area at 1.2653-1.2753.
The above noted setup looks sound from a technical standpoint, but since investors are awaiting Yellen’s speech later on this afternoon GMT, technicals may take a back seat here, so remain cautious today guys!
Levels to watch/live orders
- Buys: Flat (Stop loss: N/A).
- Sells: Watch for price to close below the 1.29 handle and then look to trade any retest seen thereafter (lower timeframe confirmation required).
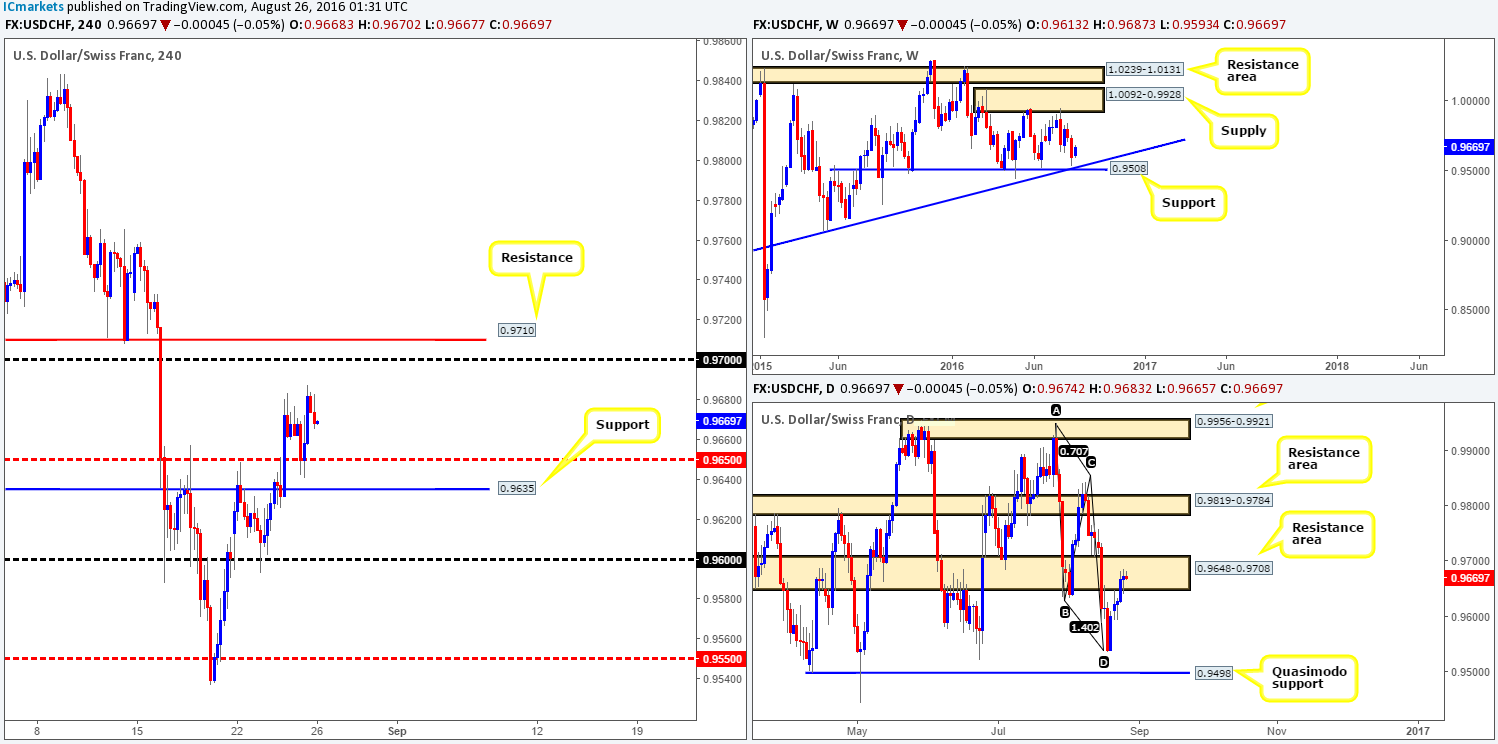
USD/CHF:
For those who read our last report on the Swissy you may recall us mentioning to watch for price to retest the 0.9635/0.9650 (H4 support/H4 mid-way support) region for a buy, targeting the 0.97 neighborhood. As can be seen from the chart, price did exactly that, but unfortunately we were unable to pin down a lower timeframe entry! Well done to any of our readers who managed to get long here. Although the take-profit target is set at 0.97, we can see that price began topping out around the 0.9680 mark going into yesterday’s US session, which could send prices back down to the 0.9650 area. Therefore, it may be a good time to think about reducing risk to breakeven if you have not done already.
With weekly action looking bullish from just above a support level at 0.9508 (fuses nicely with a trendline support extended from the low 0.8703), and daily price residing within a resistance area at 0.9648-0.9708, there is somewhat of a tug-of-war being seen between these two higher-timeframe structures.
Our suggestions: In light of Yellen’s speech scheduled for later on this afternoon, along with the opposing higher-timeframe areas (see above), opting to stand on the sidelines until the Fed Chair’s speech is over with may be the best route to take today.
Levels to watch/live orders:
- Buys: Flat (Stop loss: N/A).
- Sells: Flat (Stop loss: N/A).
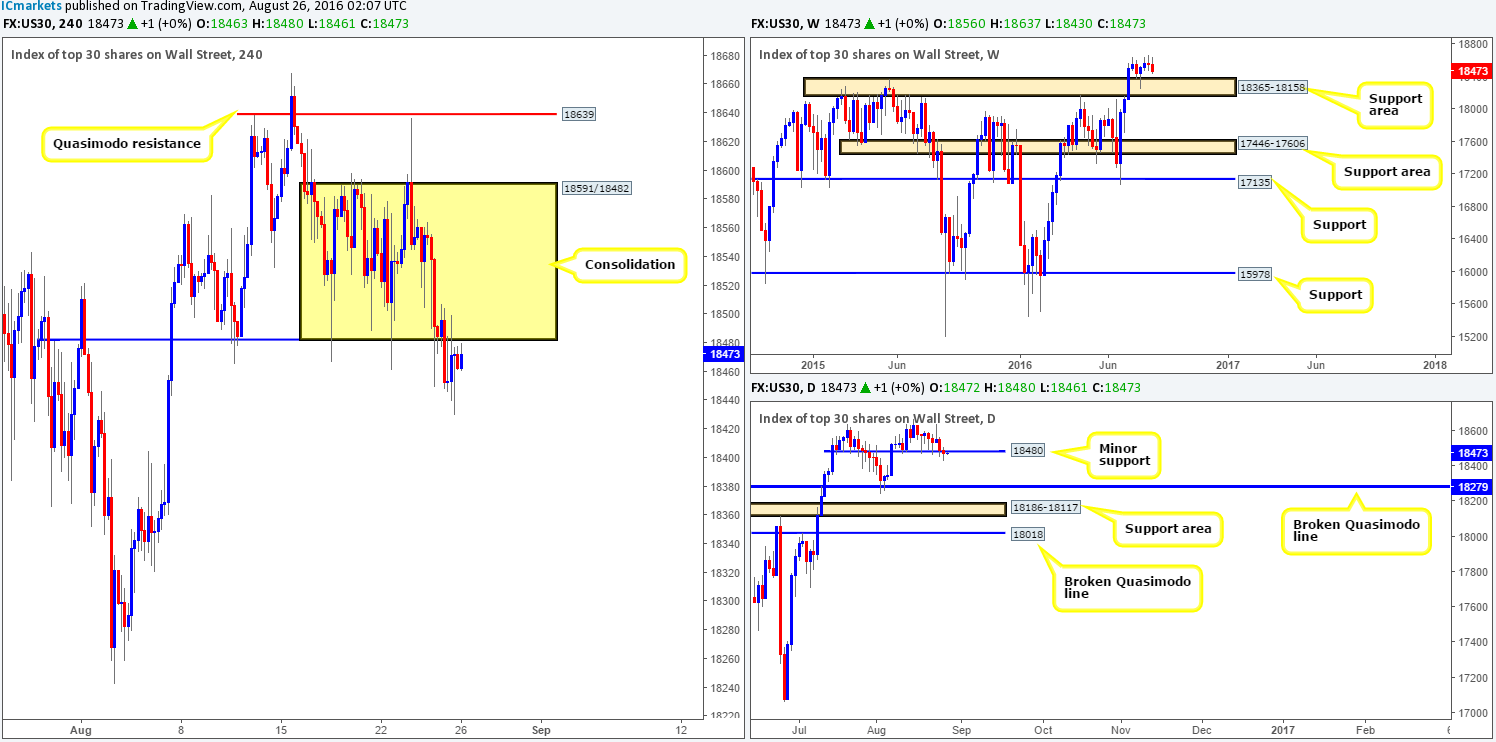
DOW 30:
Going into the early hours of yesterday’s London session, the DOW plunged lower, consequently closing below both the H4 range edge at 18482, as well as the minor daily support line coming in at 18480. We highlighted in our previous report that although the index is depreciating in value, we would not consider this bearish until a decisive daily close is seen beyond the above said minor daily support. With yesterday’s candle closing below this level, do we now believe that this unit is heading to the daily broken Quasimodo level at 18279? In short, we’re not sure. The reason for why is that the daily close was, in our book, NOT decisive enough since the close was accompanied by a rather clear buying tail!
Our suggestions: Should price retest the underside of the recently broken H4 range as resistance and hold firm, this could still eventually send equities to fresh lows. This is, despite the weak daily close, still a possibility given that weekly action shows room to move south to test the support area registered at 18365-18158. This begs the question, is this a tradable move? We believe so but only with the backing of a lower timeframe signal (see the top of this report).
Another important thing to consider here is Yellen’s speech is set to take the stage later on this afternoon GMT, which is likely to cause volatility. So do bear this in mind when considering trades today!
Levels to watch/live orders:
- Buys: Flat (Stop loss: N/A).
- Sells: 18482 region [Tentative – confirmation required] (Stop loss: dependent on where one confirms this area).
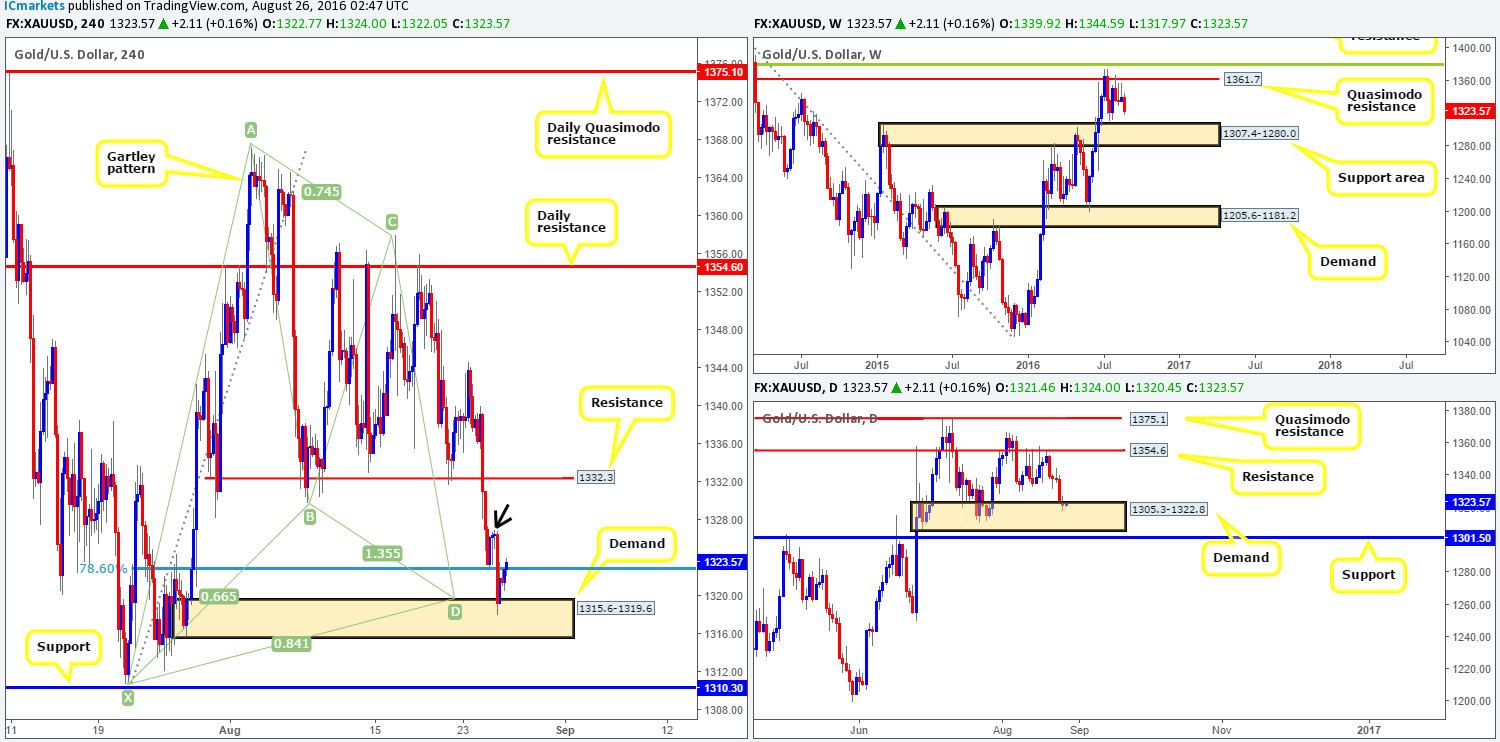
GOLD:
Yesterday we highlighted the H4 demand zone at 1315.6-1319.6 as being a considerable area to keep an eyeball on. So much so, our team set a pending buy order at 1319.8. As should be evident from the H4 chart, the order was filled mid-way through yesterday’s London trading and has since rallied to highs of 1324.0 at the time of writing. For those who missed our previous reports, we built a case for entry using the following criteria:
- A merging H4 harmonic Gartley reversal zone seen between the H4 78.6% Fib support at 1322.8 and the X point of the H4 harmonic pattern at 1310.7.
- A supporting daily demand base at 1305.3-1322.8, which sits on top of a weekly support area at 1307.4-1280.0.
With the US dollar index also recently reacting to a H4 supply seen at 94.96-94.84, this could push the dollar lower today, and by extension, the gold market higher. Ultimately, we’re now looking for price to tag the minor H4 supply area seen marked with a black arrow at 1326.9-1324.9 to take profits and reduce the stop to breakeven. However, with traders likely taking on a cautious stance ahead of Yellen’s speech today, we are going to be watching our position carefully! Should price show signs of topping out before our take-profit area, we will likely move our stop to breakeven and let the market do its thing from the safety net of a breakeven stop. Well done to any of our readers who bought this unit alongside us!
Levels to watch/live orders:
- Buys: 1319.8 [LIVE] (Stop loss: below the X point of the H4 harmonic formation: 1309.1, which is, as you can see, set just beyond the H4 support at 1310.3).
- Sells: Flat (Stop loss: N/A).


