
EUR/USD:
The euro yielded additional ground to its US peer Thursday, down 0.20% on the day and drafting its third consecutive daily loss. The dollar sustained its upward momentum, though stalled at fresh 2019 highs of 98.32 despite hotter-than-expected US durable goods orders.
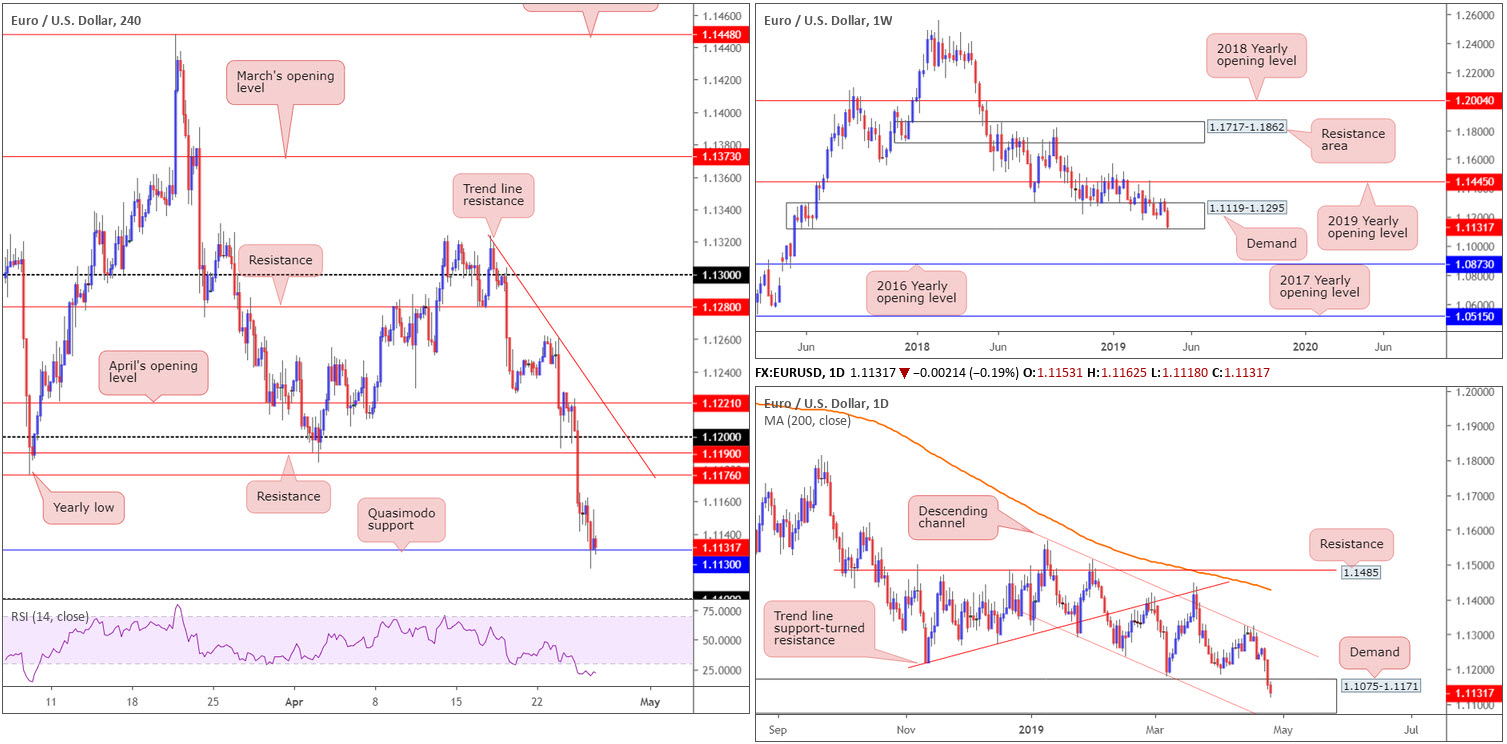
Quasimodo support at 1.1130 on the H4 timeframe nudged its way into the spotlight amid London hours yesterday and, as you can see, continued to hold into the close. The next area of interest beneath here falls in around the 1.12 handle. It may also be of interest to some traders the RSI indicator is currently testing oversold territory.
Expanding the technical view, we can see weekly buyers appear to be losing grip of a reasonably long-standing weekly demand area at 1.1119-1.1295. Recent flow clipped the lower edge of this zone, though was unlikely enough to trip stop-loss orders. A break of the area to the downside has the 2016 yearly opening level at 1.0873 to target.
Daily activity, on the other hand, continues to dip its toes into demand priced in at 1.1075-1.1171 (glued to the underside of the current weekly demand area). Note the lower edge of this barrier also aligns closely with a channel support taken from the low 1.1289.
Areas of consideration:
On account of the above reading, the majority of the market are clearly sellers at the moment. And with weekly demand quite literally ‘on its last legs’, further selling could be on the cards today/next week.
Contrary to this, however, some technicians might feel the current daily demand may be sufficient to keep buyers in the fight, together with the aforementioned H4 Quasimodo support.
In the absence of clearer price action (where all the ducks are lining up on each timeframe), opting to remain on the side lines may be the path to take today.
Today’s data points: US Advance GDP q/q; US Advance GDP Price Index q/q; US Revised UoM Consumer Sentiment.
GBP/USD:
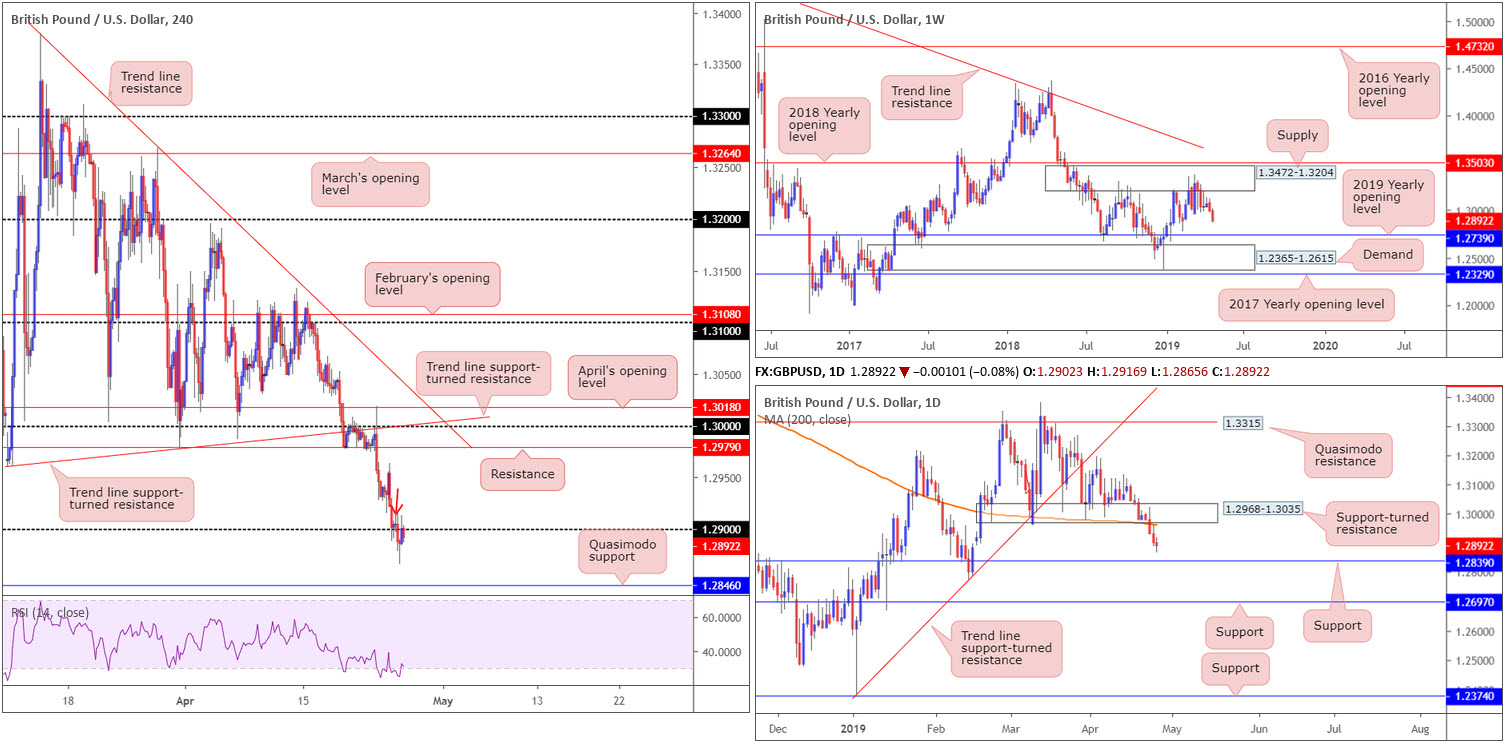
In recent sessions, the GBP/USD half-heartedly nudged beneath 1.29 amid Brexit news flow as well as a stronger dollar. A large portion of stop-loss orders beneath the psychological mark are likely filled, potentially unlocking the trapdoor towards H4 Quasimodo support priced in at 1.2846. Traders may also want to acknowledge the RSI indicator remains circulating around oversold terrain.
Further selling could be on the cards according to the weekly timeframe. Higher-timeframe flows has weekly movement threatening lower prices, after spending nearly two months consolidating around the underside of supply at 1.3472-1.3204, situated a few points south of the 2018 yearly opening level at 1.3503. With the next obvious downside target not realised on this timeframe until the 2019 yearly opening level at 1.2739, followed by demand coming in at 1.2365-1.2615, sellers still have plenty of room to manoeuvre if they press lower.
In conjunction with weekly flow, daily price recently crossed beneath its 200-day SMA (orange) and also overthrew a block of support coming in at 1.2968-1.3035 (now acting resistance). This set the stage for a run towards support at 1.2839, which is seen plotted nearby. Note this daily support is fixed only a few points beneath the H4 Quasimodo support mentioned above at 1.2846.
Areas of consideration:
Having observed all three timeframes portend further downside, a short from the underside of 1.29 could be a setup worth considering today, targeting the current H4 Quasimodo support as the initial take-profit zone. A short at current price may be an option with a stop positioned above local tops around 1.1216 (red arrow), therefore affording the trader ample room to secure reasonable risk/reward to 1.2846.
Today’s data points: US Advance GDP q/q; US Advance GDP Price Index q/q; US Revised UoM Consumer Sentiment.
AUD/USD:
Outlook unchanged due to lacklustre movement.
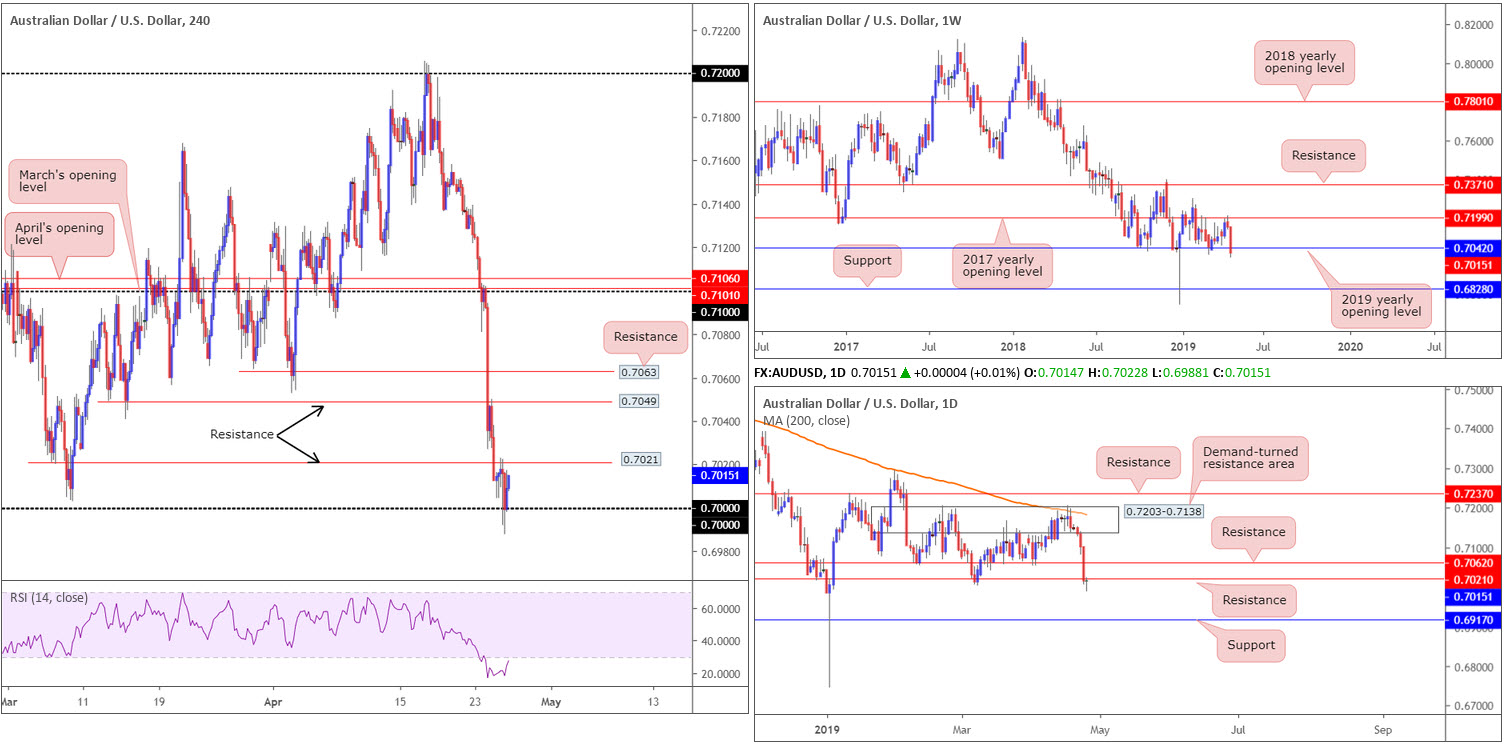
AUD/USD prices concluded unchanged Thursday, with the majority of the day spent fluctuating between a H4 resistance at 0.7021 (prior Quasimodo support) and the key figure 0.70. Beyond 0.70, the research team sees little in terms of support until daily support enters the fold at 0.6917, followed closely by 0.69.
Thanks to recent selling, the 2019 yearly opening level on the weekly timeframe at 0.7042 remains fragile. A weekly close below this level may call for further downside in the direction of support at 0.6828. By the same token, daily movement recently crossed below support priced in at 0.7021 (also represents H4 resistance), potentially unlocking the door towards support highlighted above at 0.6917.
Areas of consideration:
0.70 is clearly a level worth keeping an eyeball on today, either as support to fade or as a breakout play for lower levels. With higher-timeframe support echoing a fragile tone right now, the latter appears more of a reasonable approach. Ultimately a breakout seller has two options. Either sell the breakout candle or wait and see if a correction/retest is seen. The latter is the more conservative route. A H4 close below 0.70 that’s followed up with a retest in the shape of a H4 bearish candlestick pattern would be ideal (entry and risk parameters can be determined according to this pattern), targeting 0.6917 as the initial take-profit zone.
Today’s data points: US Advance GDP q/q; US Advance GDP Price Index q/q; US Revised UoM Consumer Sentiment.
USD/JPY:
Early Asia witnessed the Bank of Japan (BoJ) hold rates, as expected, and provide specific forward guidance to keep ‘extremely’ low rates through spring 2020.
After spending the majority of Thursday’s session entrenched within negative territory, the market encountered fresh supply, primarily attributed to a modest USD pullback from 2019 highs of 98.32 (US dollar index).
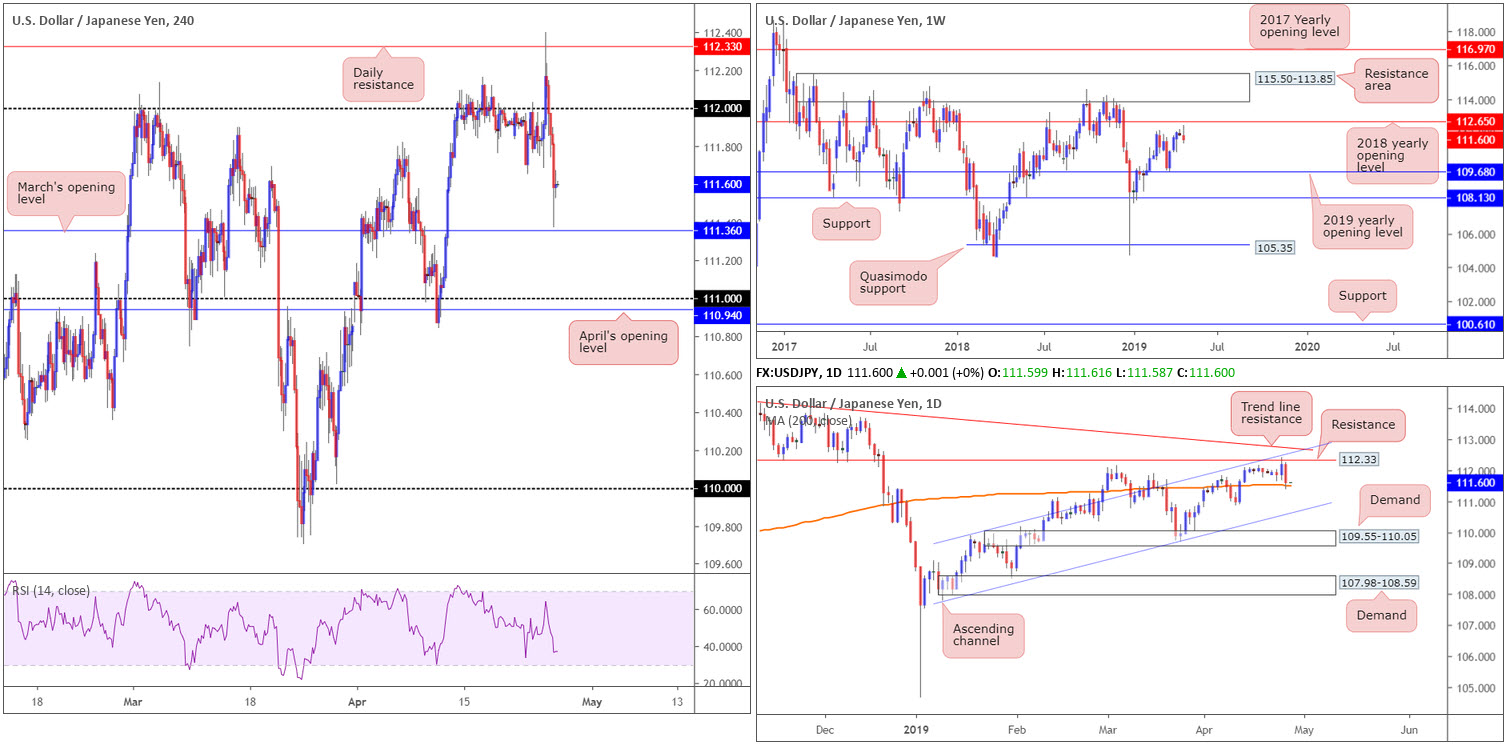
For folks who read previous reports on the USD/JPY you may recall the piece highlighted daily resistance at 112.33 as a potential sell zone. Note this barrier fused with a daily channel resistance (drawn from the high 109.88), and a nearby daily trend line resistance (etched from the high 114.54). Well done to any of our readers who managed to short this level and hold the position.
Leaving the 2018 yearly opening level unchallenged at 112.65, weekly structure, as you can see, has plenty of room to push lower. Daily activity, however, is currently shaking hands with its 200-day SMA (orange), which could offer the market support. In terms of where we’re currently positioned on the H4 timeframe, March’s opening level at 111.36 came within a few points of entering the mix yesterday, before mildly paring losses into the close.
Areas of consideration:
March’s opening level at 111.36 on the H4 timeframe is certainly a barrier worth keeping an eye on today, largely due to its connection with the 200-day SMA. A H4 or H1 bullish candlestick signal printed from 111.36 (entry and risk parameters can be determined according to this structure) is likely sufficient to draw in buyers and potentially retest the 112 region.
An alternative, should the market continue exploring lower ground, is sell the breakout beneath 111.36. Traders are urged to consider risk/reward conditions before pulling the trigger, however.
Today’s data points: US Advance GDP q/q; US Advance GDP Price Index q/q; US Revised UoM Consumer Sentiment.
USD/CAD:
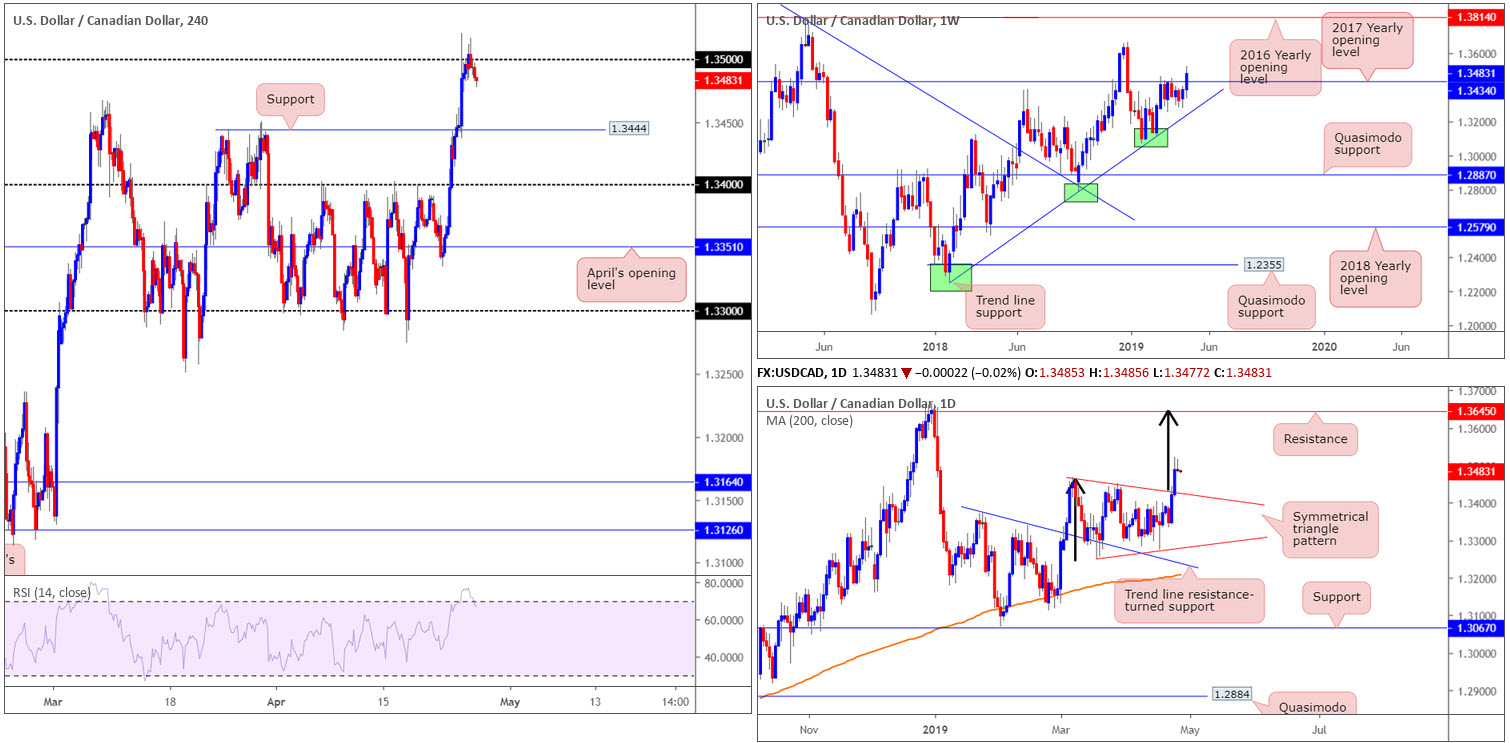
USD/CAD movement eased beneath 1.35 Thursday as the US dollar struggled to sustain its upside presence. Technically, this could draw in additional sellers today, targeting a move towards H4 support priced in at 1.3444, a Quasimodo resistance-turned support. The important thing to consider here, nonetheless, is the 2017 yearly opening level seen on the weekly timeframe at 1.3434 plotted just beneath the said H4 base.
Weekly flow, according to our technical studies, remains in a relatively healthy position above 1.3434, which could eventually lead to a move materialising in the direction of the 2018 yearly high of 1.3664. In addition to this, daily flow recently broke out of a symmetrical triangle formation. Traders are likely looking for this pattern to hit a take-profit target around resistance at 1.3645 (the T.P was calculated by adding the base distance to the breakout level [black arrows]).
Areas of consideration:
On account of the technical picture, two potential scenarios are in sight:
- In the event price action reclaims 1.35 to the upside today on a H4 closing basis, a long could be an idea. A H4 close above this number that’s followed up with a retest as support (preferably by way of a H4 bullish candlestick pattern – entry and risk can be determined according to this structure) would likely be enough evidence to draw in buyers towards at least H4 resistance at 1.3570 (not seen on the screen).
- Should sellers remain in the driving seat for the time being, nevertheless, a test of H4 support mentioned above at 1.3444 is likely on the cards. Owing to this level’s close connection with weekly support (see above), a long could also be an option from here, too. As psychological numbers are prone to fakeouts, traders are urged to consider waiting for additional candlestick confirmation before pressing the buy button.
Today’s data points: US Advance GDP q/q; US Advance GDP Price Index q/q; US Revised UoM Consumer Sentiment.
USD/CHF:
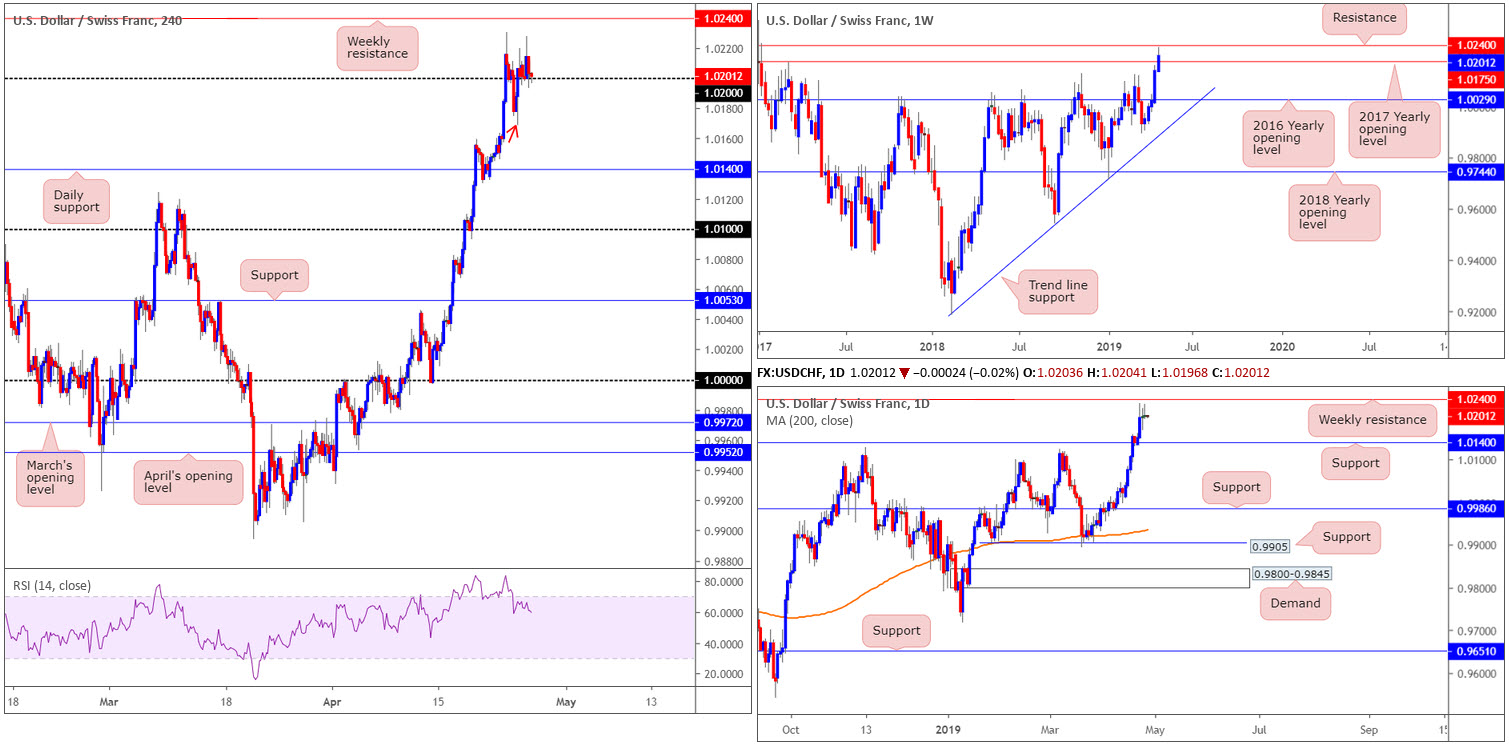
Trading volume remained thin Thursday as the unit continued to flip between gains/losses around the 1.02 handle on the H4 timeframe. Overhead, traders are urged to pencil in weekly resistance coming in at 1.0240, which could, technically, be the reason behind cautious buying above 1.02.
Another constructive development is the 2017 yearly opening level at 1.0175, which (red arrow), as you can see on the H4 timeframe, was retested as support Wednesday. In terms of daily structure, the next area of support in view falls in around 1.0140.
Areas of consideration:
From a technical standpoint, the USD/CHF appears to be ‘caught between a rock and a hard place’. In other words, irrespective of the direction one selects opposing structure is close by. A short in this market has you contending with possible support from the 2017 yearly opening level at 1.0175, and a long has you competing with nearby weekly resistance at 1.0240. Granted, a long from 1.02 has 40-points of wiggle room to play with, though given the lacklustre buying seen around this neighbourhood of late, it’s a chancy move. With that being the case, neither a long nor short seems attractive today.
Today’s data points: US Advance GDP q/q; US Advance GDP Price Index q/q; US Revised UoM Consumer Sentiment.
Dow Jones Industrial Average:
US equity indexes finished mostly lower Thursday. The Dow Jones Industrial Average clocked up a 0.51% loss, the S&P 500 ended the day marginally in the red by 0.04%, while the tech-heavy Nasdaq Composite chalked up gains of 0.42%. Offsetting strong earnings from Facebook and Microsoft, disappointing earnings reports from several industrial sector companies weighed on the market.
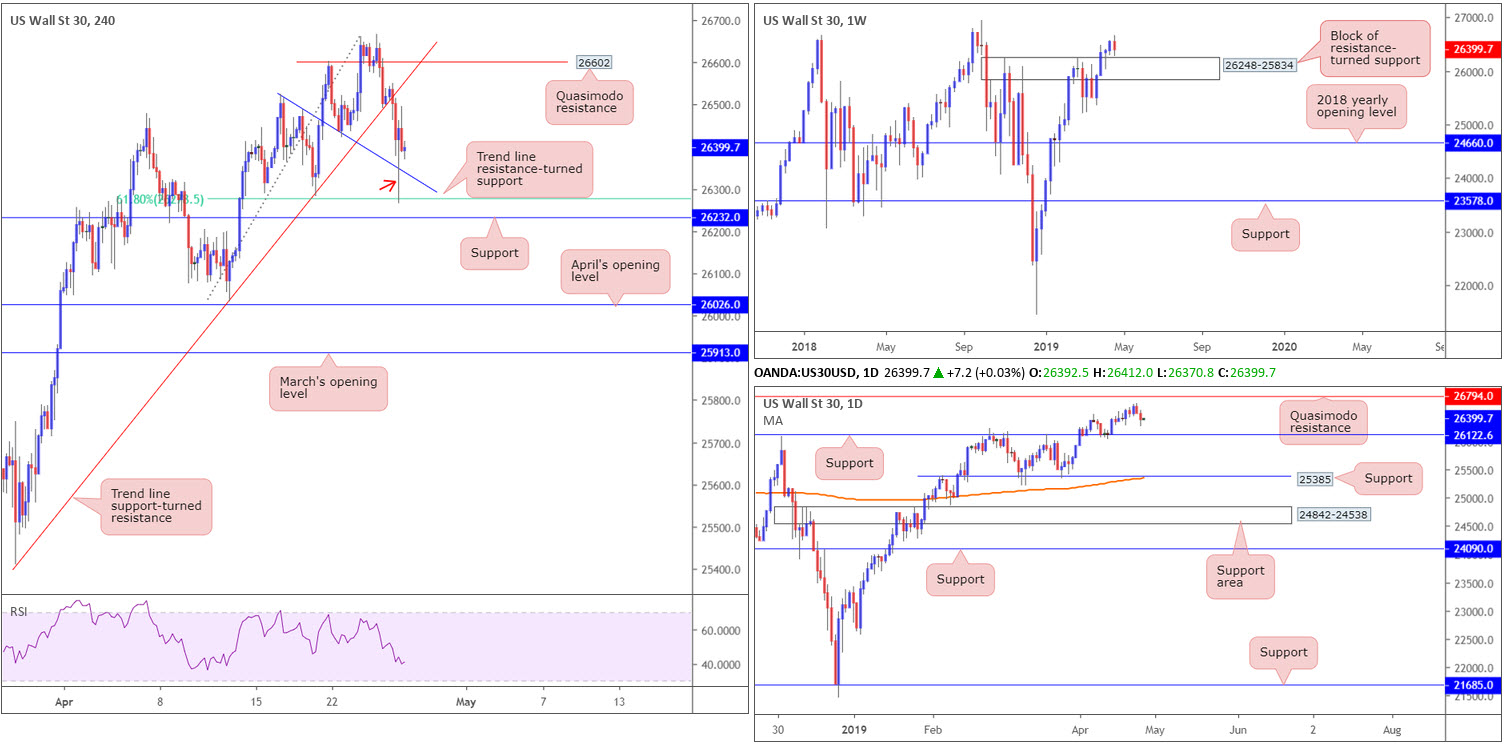
Yesterday’s correction positioned the DJIA within striking distance of 26248-25834 (a block of resistance-turned support) on the weekly timeframe, though appears to have established minor support just ahead of the zone thus far. A closer reading of price action on the daily timeframe shows potential to decline as far south as support plotted at 26122, while to the upside a Quasimodo resistance rests at 26794.
Across on the H4 timeframe, the research team notes a trend line support (taken from the low 25410) break was seen yesterday, suggesting upside momentum may be fading. The move lower, nevertheless, found support off a trend line resistance-turned support (taken from the high 26525), and is holding ground as we write. Beneath here, support resides nearby at 26232.
Areas of consideration:
With the current H4 trend line resistance-turned support in play, along with a H4 61.8% Fibonacci support at 26280 and the nearby resistance-turned support area on the weekly timeframe at 26248-25834 also in the mix, a recovery could take shape today.
Traders may already be long this market on the back of the goodish H4 pin-bar pattern (red arrow). The first logical take-profit target from this point is the underside of the recently broken H4 trend line support highlighted above, followed closely by H4 Quasimodo resistance at 26602.
Today’s data points: US Advance GDP q/q; US Advance GDP Price Index q/q; US Revised UoM Consumer Sentiment.
XAU/USD (GOLD):
Although recent movement clocked a fresh weekly high at 1282.9 Thursday, the recovery is limited amid broad dollar strength.
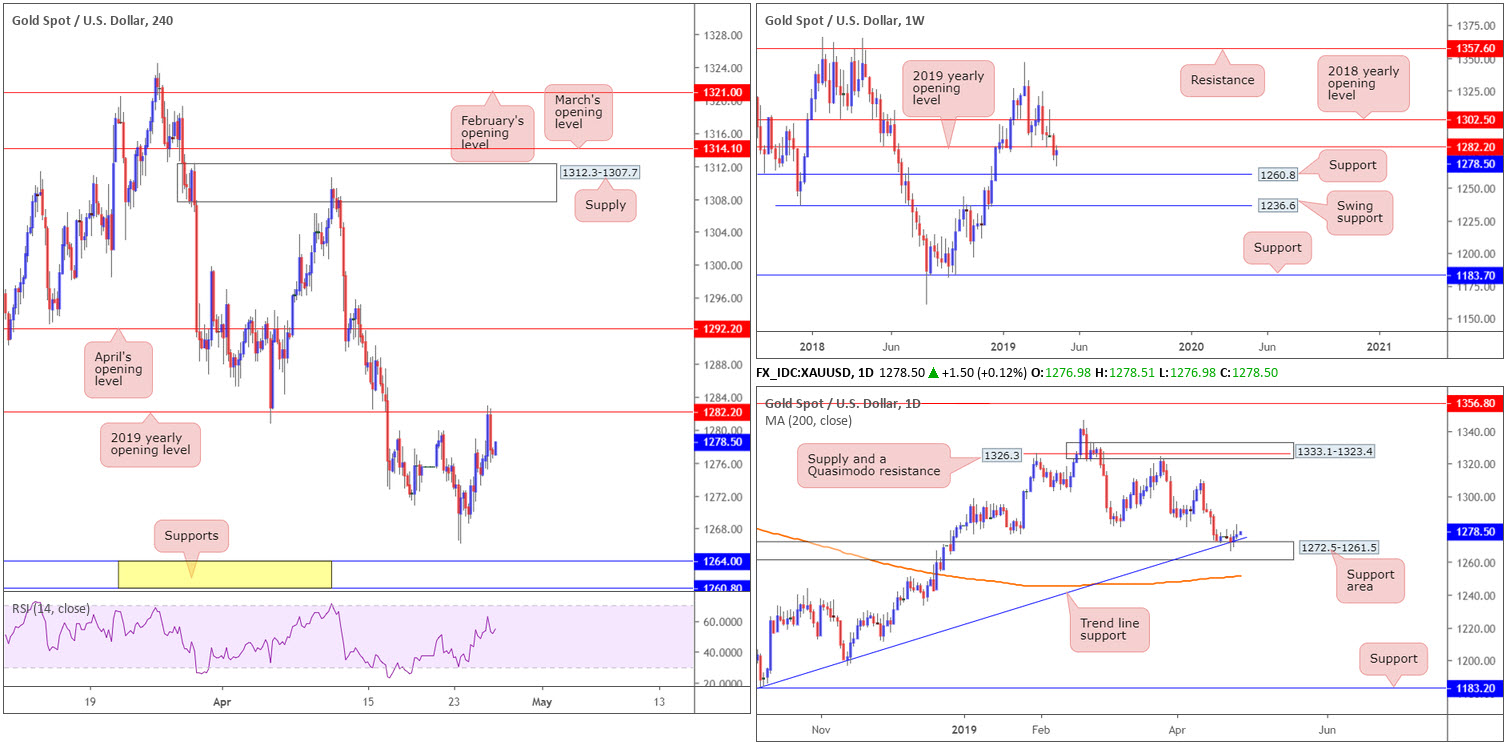
Technically speaking, the 2019 yearly opening level at 1282.2, seen on the weekly and H4 timeframes, held ground as resistance yesterday. Above this barrier on the H4 timeframe, traders’ crosshairs are likely fixed on April’s opening level at 1292.2. To the downside, apart from Tuesday’s low of 1266.1, support is seen at 1264.0, closely shadowed by a Quasimodo resistance-turned support at 1260.8.
1264.0 is also housed within a daily support area coming in at 1272.5-1261.5, which happens to align with a trend line support (taken from the low 1160.3). Interestingly, higher-timeframe flows also show the weekly candles have room to press as far south as support plotted at 1260.8 (representing the H4 support highlighted above).
Areas of consideration:
Although weekly and H4 price are defending the underside of 1282.2, daily buyers are simultaneously attempting to push higher from its support area coming in at 1272.5-1261.5.
The research team notes two possible scenarios going forward:
- H4 support at 1264.0, owing to its connection with daily structure, remains an attractive platform for longs today. It is, however, recommended to wait for additional confirmation to take shape before pulling the trigger (entry and risk levels can be determined according to the confirmation technique applied). This is due to weekly price threatening lower prices.
- In the event the unit continues to climb higher, however, and the market observes a H4 close take shape beyond 1282.2, a retest of this level (preferably in the shape of a H4 bullish candlestick pattern – entry and risk can be determined according to this pattern) as support could prompt further buying towards April’s opening level at 1292.2.
The accuracy, completeness and timeliness of the information contained on this site cannot be guaranteed. IC Markets does not warranty, guarantee or make any representations, or assume any liability with regard to financial results based on the use of the information in the site.
News, views, opinions, recommendations and other information obtained from sources outside of www.icmarkets.com.au, used in this site are believed to be reliable, but we cannot guarantee their accuracy or completeness. All such information is subject to change at any time without notice. IC Markets assumes no responsibility for the content of any linked site. The fact that such links may exist does not indicate approval or endorsement of any material contained on any linked site.
IC Markets is not liable for any harm caused by the transmission, through accessing the services or information on this site, of a computer virus, or other computer code or programming device that might be used to access, delete, damage, disable, disrupt or otherwise impede in any manner, the operation of the site or of any user’s software, hardware, data or property.


