A note on lower timeframe confirming price action…
Waiting for lower timeframe confirmation is our main tool to confirm strength within higher timeframe zones, and has really been the key to our trading success. It takes a little time to understand the subtle nuances, however, as each trade is never the same, but once you master the rhythm so to speak, you will be saved from countless unnecessary losing trades. The following is a list of what we look for:
- A break/retest of supply or demand dependent on which way you’re trading.
- A trendline break/retest.
- Buying/selling tails – essentially we look for a cluster of very obvious spikes off of lower timeframe support and resistance levels within the higher timeframe zone.
- Candlestick patterns. We tend to only stick with pin bars and engulfing bars as these have proven to be the most effective.
For us, lower timeframe confirmation starts on the M15 and finishes up on the H1, since most of our higher timeframe areas begin with the H4. Stops usually placed 5-10 pips beyond your confirming structures.
EUR/USD:
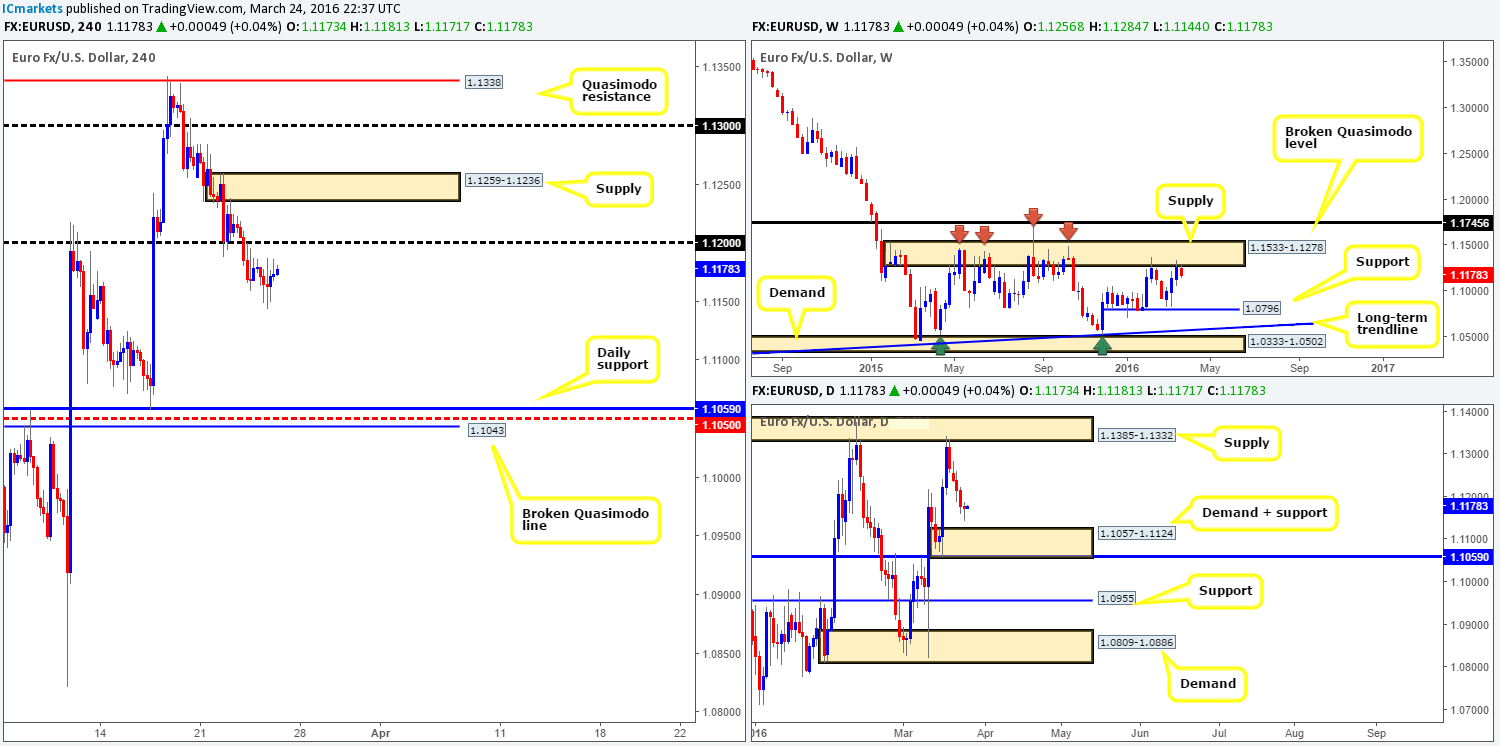
It was a quiet day for the single currency yesterday with the pair closing a mere six pips lower than Wednesday’s close at 1.1173. Price was seen confined between intraday resistance drawn from 1.1179 and support coming in at 1.1161, ranging as little as forty pips throughout the entire session.
For those who have been following our reports on the EUR of late, you may recall that we took a short position from 1.1273 last Friday with 60% already locked in at 1.1200. As of this point, we have moved our stop to just above 1.1200 at 1.1205 ahead of the Easter holidays with a final profit objective remaining at 1.1124 – the top-side of daily demand.
In support of this move, price is currently trading from weekly supply given at 1.1533-1.1278, which will likely help price reach our final objective soon. However, seeing as today’s action will likely remain quiet due to most major banks being closed today, we’re not willing to pyramid our position until the markets return to normal liquidity.
Levels to watch/live orders:
- Buys: Flat (Stop loss: N/A).
- Sells: 1.1273 [LIVE 60% of position already taken at 1.1200] (Stop loss: 1.1205).
GBP/USD:
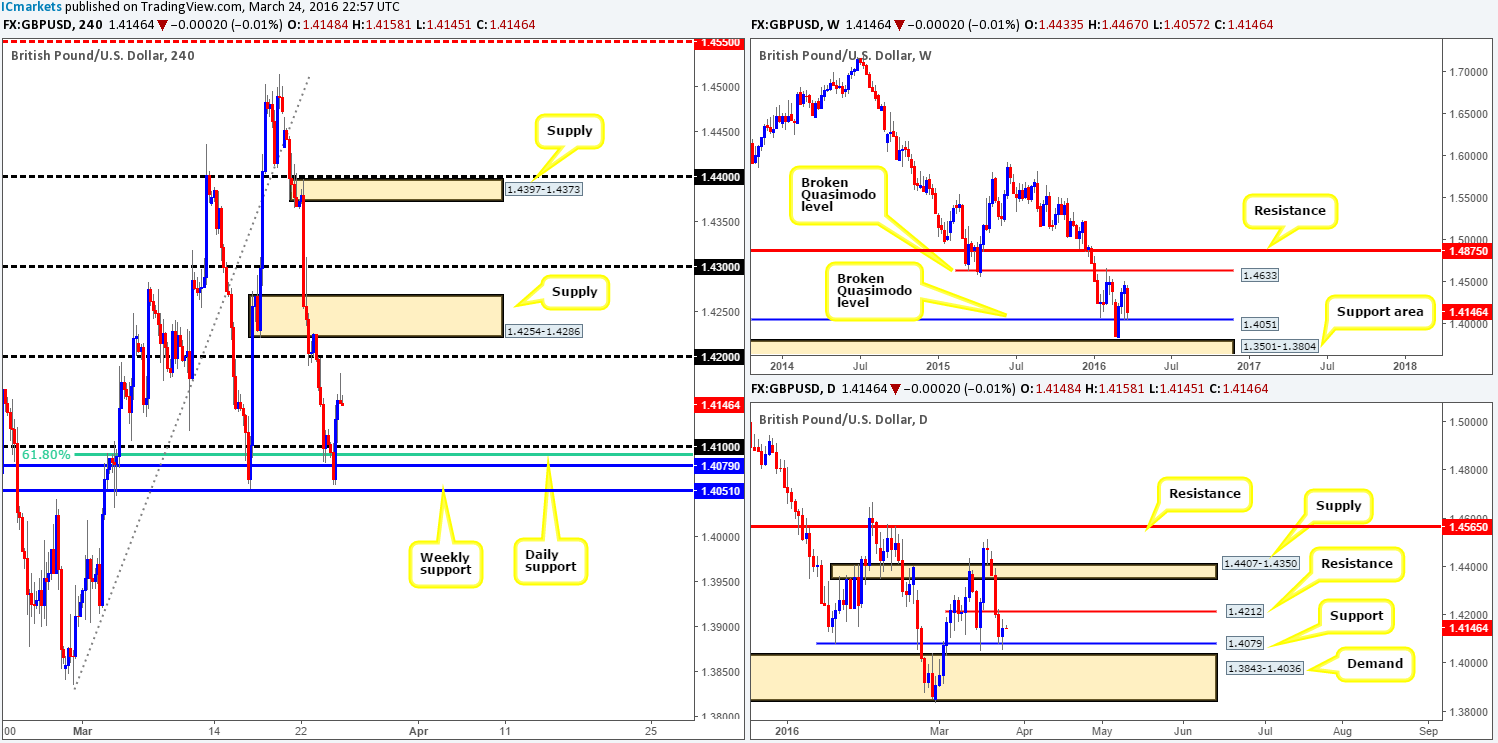
In our previous report (see link below), we spoke about keeping an eyeball on the 1.4100/1.4150 H4 area for possible longs. As you can see from the chart, shortly after London opened yesterday price rallied nicely from this zone, reaching highs of 1.4182 on the day. Well done to any of our readers who managed to board this train before it departed!
Despite the bearish H4 selling wick that formed prior to yesterday’s close, we still feel confident 1.4200 is likely going to be the next hurdle on the hit list. This would in fact be our overall take-profit area should we have managed to enter long yesterday. The reason for why is due to where price has traded from – a weekly support at 1.4051 (broken Quasimodo line) and a daily support chalked up at 1.4079.
For those who did manage a buy entry yesterday, however, taking 50% of your position off the table now and moving your stop to breakeven might be something to consider, since today’s movement will likely be choppy due to the Easter break.
Levels to watch/live orders:
- Buys: Flat (Stop loss: N/A).
- Sells: Flat (Stop loss: N/A).
AUD/USD:
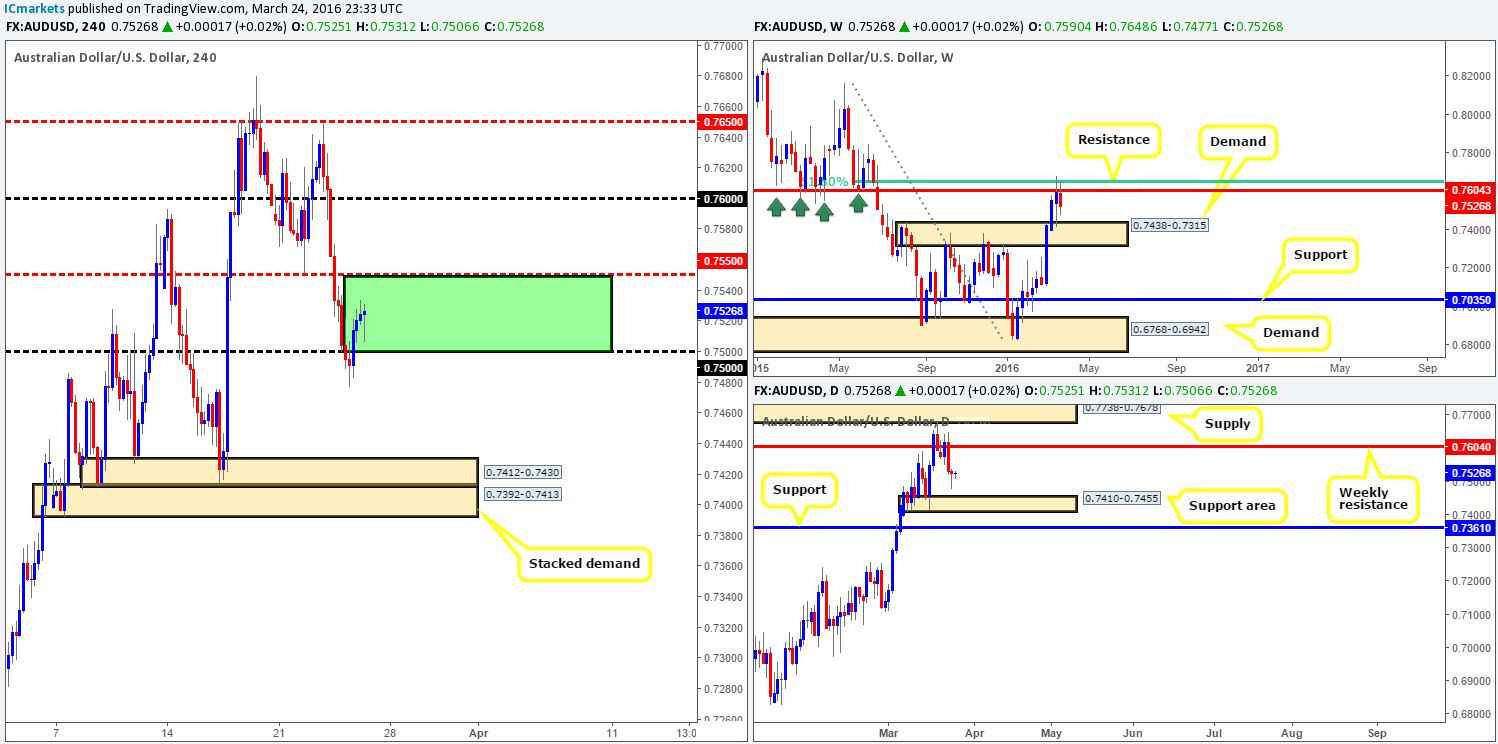
During the course of yesterday’s sessions, the commodity currency broke through the 0.7500 handle, dipping to lows of 0.7477 which, as you can see, spring boarded this market back above 0.7500, closing a mere five pips lower than Wednesday’s close at 0.7525. This H4 whipsaw explains the formation of the buying tail seen over on the daily chart.
To our way of seeing things at the moment, the overall technical tone in this market still remains to the downside. Not only is there a strong barrier of weekly resistance in play at 0.7604, but on both the weekly and daily charts room to move lower is being seen. The closest structure comes in at an area of daily support chalked up at 0.7410-0.7455.
Nevertheless, given that the majority of the market is on vacation today, as well as Monday, we do not see price closing beyond the 0.7550/0.7500 band (green area) on the H4 chart during this time. That being the case, there’s very little that we see worth trading at this time.
Levels to watch/live orders:
- Buys: Flat (Stop loss: N/A).
- Sells: Flat (Stop loss: N/A).
USD/JPY:
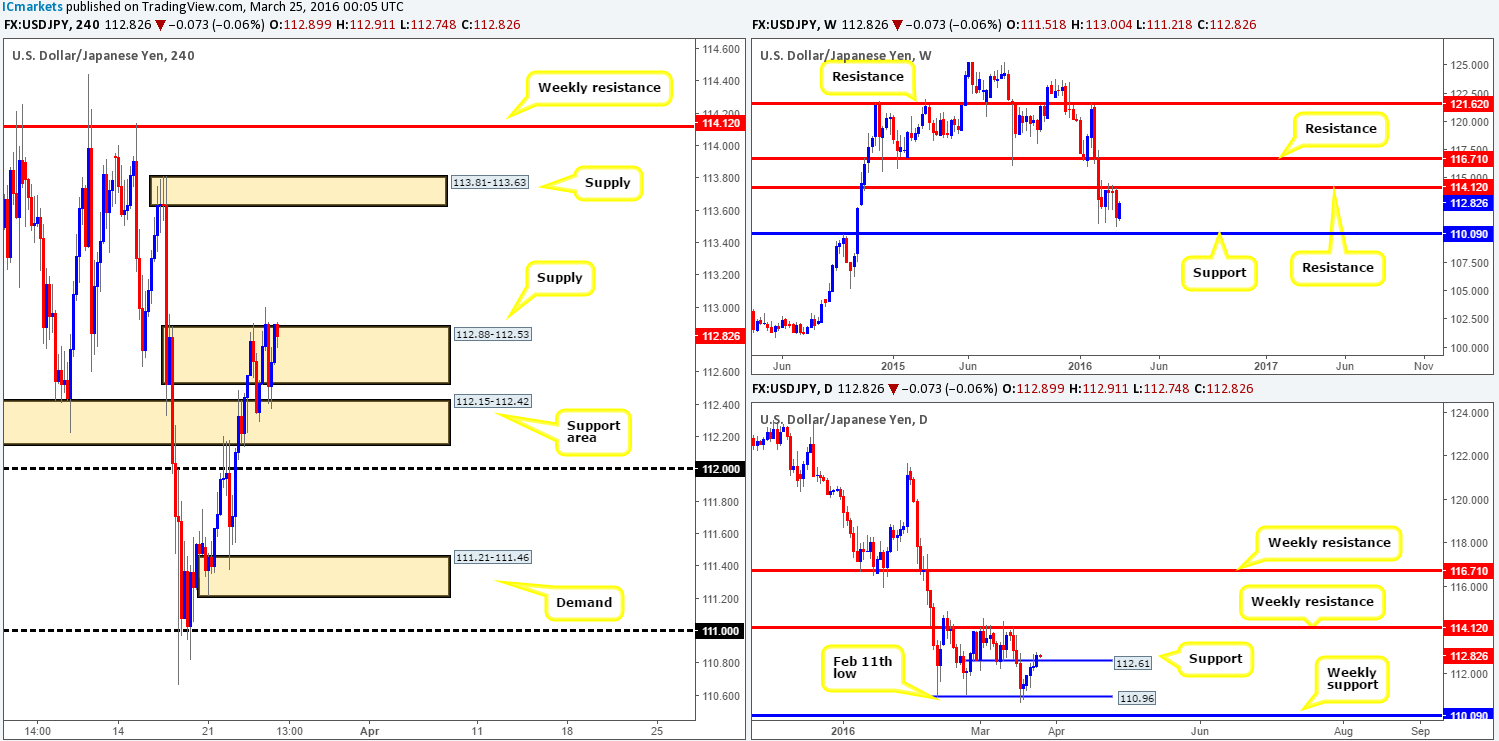
Using a top-down approach this morning, we can see that weekly trade is now effectively positioned mid-range amid support fixed at 110.09 and resistance drawn from 114.12. With both levels having significant history, make sure to note these beauties down in your watch lists for future use.
Climbing down into the pits of the daily timeframe, nevertheless, recent trading saw a close above resistance at 112.61, which should now provide support to this market. In the event that the bulls are able to defend this barrier, it’s likely price will head north to cross swords with the above said weekly resistance level.
Moving down one more level to the H4 timeframe, supply at 112.88-112.53 is clearly struggling to hold ground, especially with buyers bolstering this pair just below from the support area painted at 112.15-112.42. Beyond this supply, we see little stopping price from rallying up to supply coming in at 113.81-113.63, which, as can be seen from the chart, is positioned directly beneath weekly resistance. Therefore, should price close above the current H4 supply and retest it as demand, we would, dependent on the lower timeframe action, look to go long from this base.
Despite this somewhat bullish tone, choppy action is likely to be seen due to the Easter holidays. As such, any trades taken during this time should be done so with caution!
Levels to watch/live orders:
- Buys: Watch for price to consume 112.88-112.53 and look to trade any retest seen thereafter (lower timeframe confirmation required).
- Sells: Flat (Stop loss: N/A).
USD/CAD:
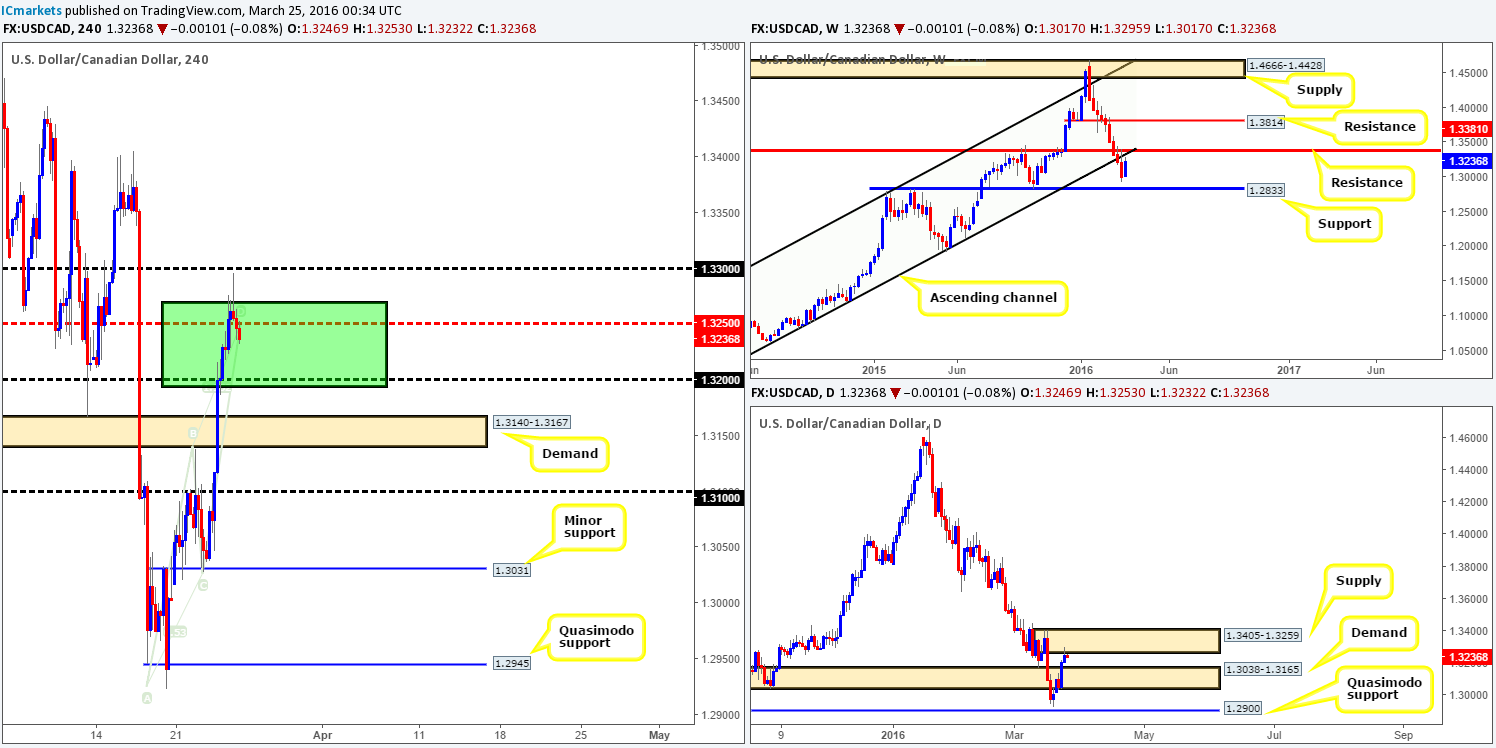
Yesterday’s action saw the buyers continue to fuel this market going into the European open yesterday, allowing price to fake above the H4 AB=CD bearish sell zone (1.3270/1.3194 Green area), and reach highs of 1.3295 before selling-off into the U.S. session. Well done to any of our readers who managed to lock in a position here as this was a noted area to watch for shorts.
Technically, this pair is hugely bearish for us now. Oil is currently trading from an area of H4 support seen at 38.16-38.94, whilst daily supply at 1.3405-1.3259 and also the underside the recently broken ascending support line (1.0630) are now effectively in play.
In view of the points made above, traders may want to keep an eye on any retest seen at the H4 mid-level barrier 1.3250, since bar the 1.3200 figure, there’s room for price to head lower toward H4 demand at 1.3140-1.3167 (sits within the top-side of daily demand at 1.3038-1.3165).
Despite the clear bearish tone in this market, choppy action is likely to be seen due to the Easter holidays. As such, any trades taken during this time should be done so with caution!
Levels to watch/live orders:
- Buys: Flat (Stop loss: N/A).
- Sells: 1.3250 [Tentative – confirmation required] (Stop loss: dependent on where one confirms this level).
USD/CHF:
(The following report remains unchanged from yesterday since there was little development seen in this market)
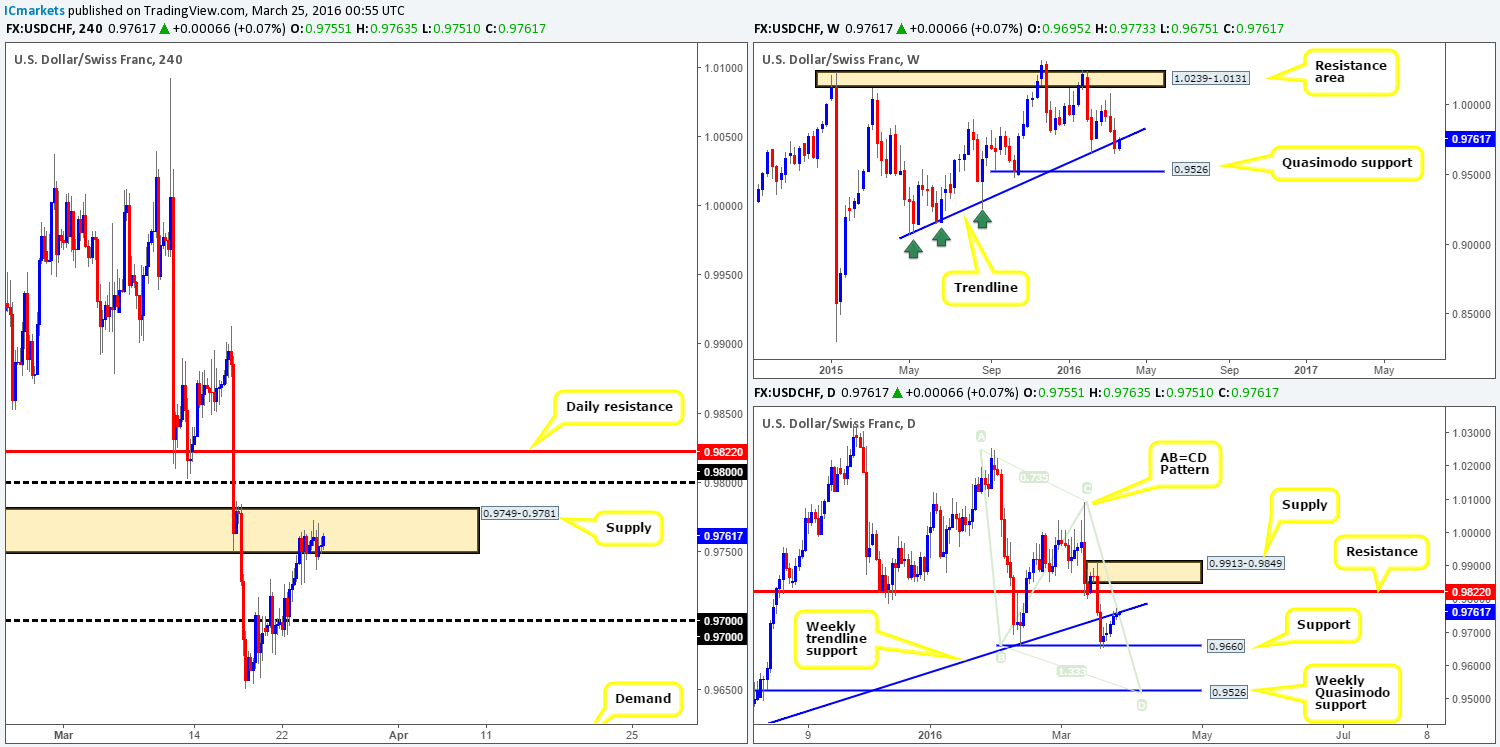
Similar to its inversely correlated cousin, the EUR/USD, the USD/CHF also saw very little change throughout yesterday’s trading sessions. As can be seen from the H4 chart, price remains housed within H4 supply coming in at 0.9749-0.9781. This area, as we mentioned in the previous report, is showing very little selling interest at the moment. Be that as it may, with the higher-timeframe action currently testing the underside of a recently broken weekly trendline support extended from the low 0.9071, the H4 supply still remains in a good position despite H4 candle activity. Nevertheless, trading this area at market is a little too risky for our liking as we generally do not like taking market trades at zones when the only higher-timeframe convergence is a trendline. Not only this, there is also a chance price could fake above to the 0.9800 figure and quite possibly even to the daily resistance seen at 0.9822 before sellers step in. Therefore, in our humble opinion it would be best to wait for the lower timeframes to confirm the current H4 area before risking capital.
In addition to the above, today and Monday’s sessions will likely be just as quiet, since most trading desks have closed up shop for the Easter holidays, so trade with caution guys!
Levels to watch/live orders:
- Buys: Flat (Stop loss: N/A).
- Sells: 0.9749-0.9781 [Tentative – confirmation required] (Stop loss: dependent on where one confirms this area).
DOW 30:
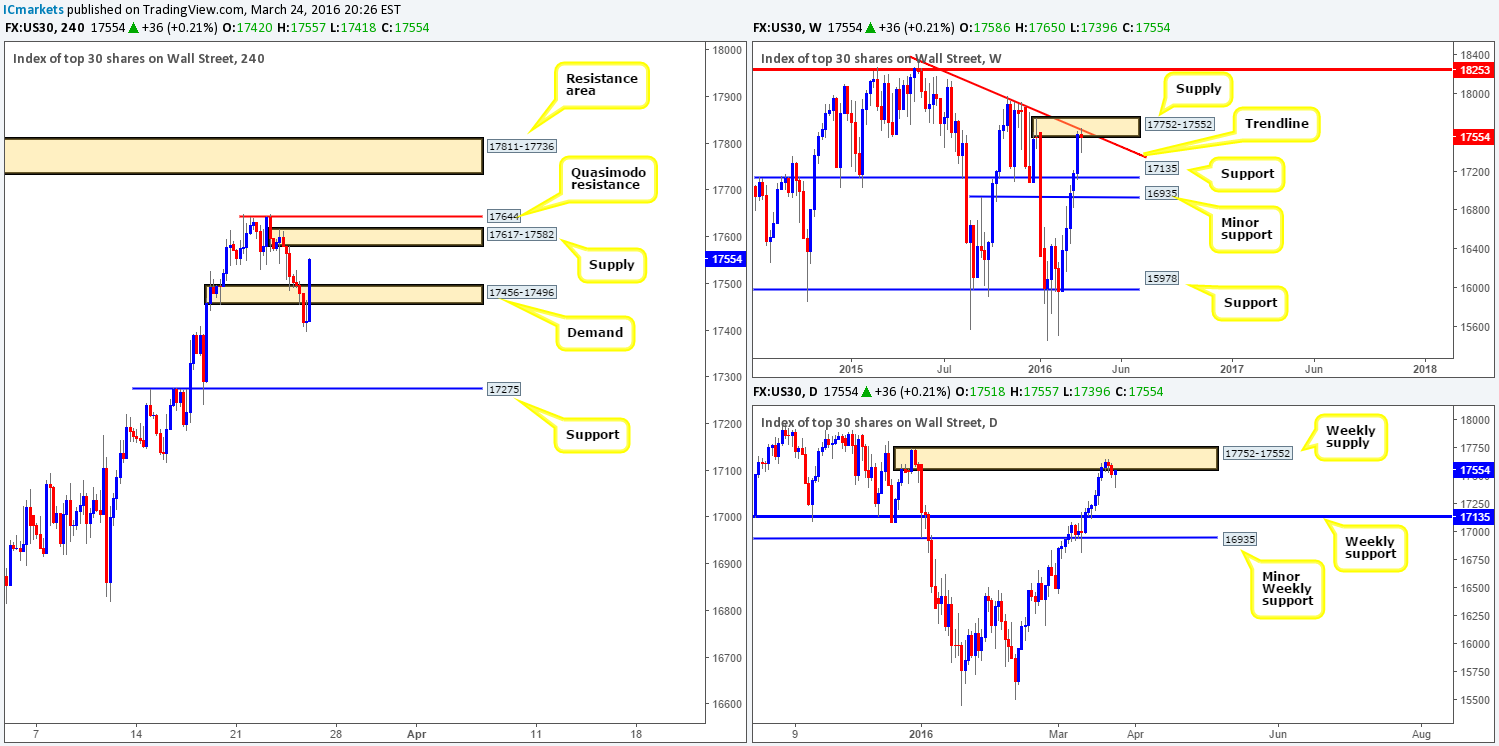
From the weekly chart, the bears seem to be struggling at the moment to hold this market lower from supply at 17752-17552 (converges just beautifully with trendline resistance taken from the high 18365). This becomes even more apparent as we slide down into the daily chart, where yesterday’s session printed a clear-cut buying tail!
Turning our attention to the H4 chart, we can see that the DOW is currently heading northbound towards a small supply zone coming in at 17617-17582. This, alongside a small Quasimodo resistance level above at 17644, is the last barrier of defense until the resistance area seen at 17811-17736, which sits at the very extreme point of the aforementioned weekly supply.
In light of the above points, the near-term H4 supply and the Quasimodo resistance lurking just above it will be our first port of call for shorts. Entering into a position here, however, without lower timeframe confirmation (see the top of this article for confirmation techniques) is not something we’d be comfortable participating in.
Whatever method one choses to trade, please remain aware that most banks will be closed today and Monday in observance of the Easter holidays so liquidity will likely be light going forward.
Levels to watch/live orders:
- Buys: Flat (Stop loss: N/A).
- Sells: 17617-17582 [Tentative – confirmation required] (Stop loss: dependent on where one confirms this area). 17644 [Tentative – confirmation required] (Stop loss: dependent on where one confirms this level). 17811-17736 [Tentative – confirmation required] (Stop loss: dependent on where one confirms this area).
XAU/USD: (Gold)
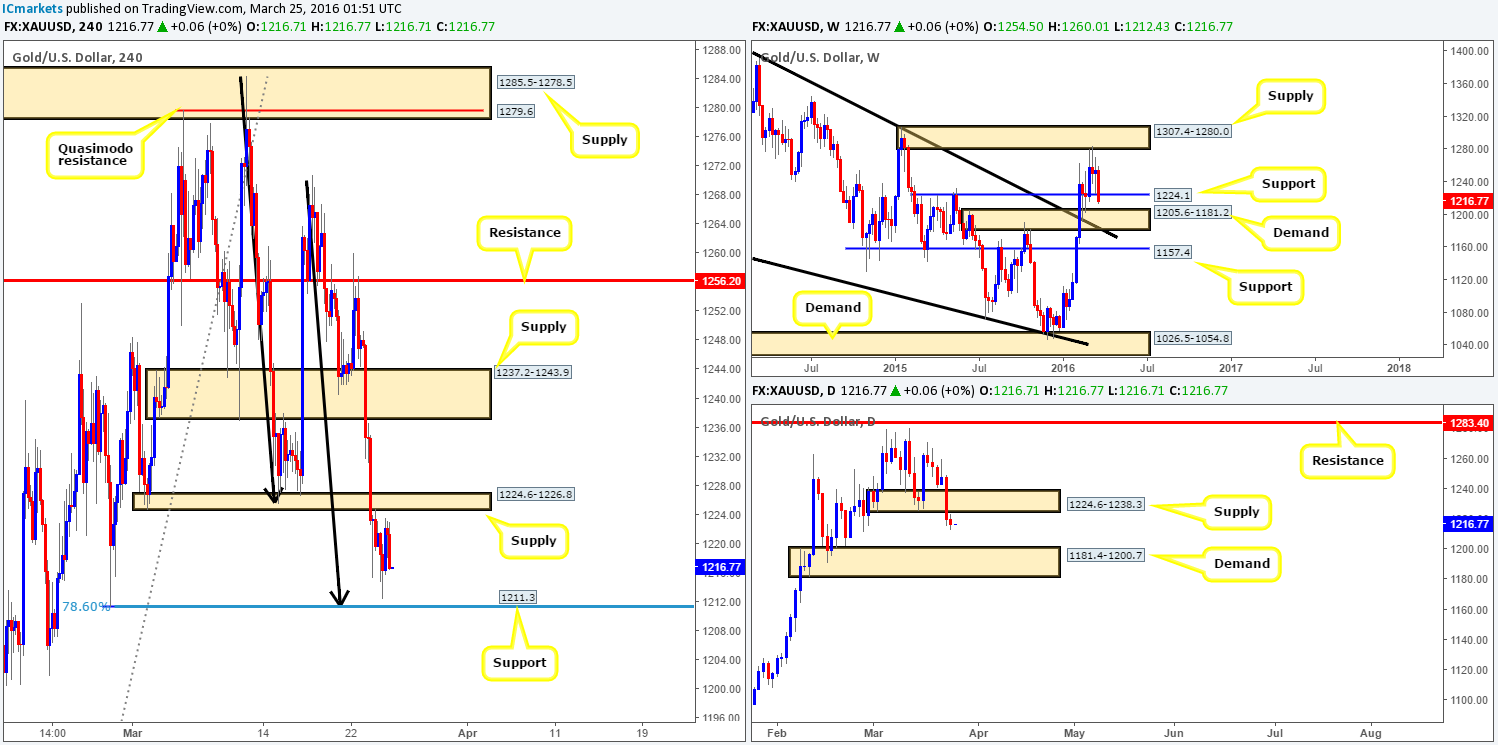
With the yellow metal seeing a rather lackluster performance yesterday, much of the following analysis will remain the same as in the previous report.
Seeing as how the weekly chart remains below support at 1224.1, this could potentially pave the way south towards weekly demand at 1205.6-1181.2. In-line with this expectation, daily price remains bearish below the recently broken demand at 1224.6-1238.3 (now acting supply), possibly setting the stage for a continuation sell-off down to daily demand at 1181.4-1200.7 (sits within the extremes of the aforementioned weekly demand).
Although the higher-timeframe direction is clearly pointing south right now, we still like the look of the 26th Feb low at 1211.3 on the H4 chart for buys, since it fuses nicely with a 1:1 Harmonic correction (black arrows) and a 78.6% Fibonacci support level (taken from the low 1190.8). Yet, trading this barrier is a risky play in our book and would only be possible with the backing of a lower timeframe buy setup (see the top of this article for confirmation techniques). In addition to this buy level, we also like the recently broken H4 demand (now supply) at 1224.6-1226.8 for sells. This area has already held ground on its first retest so it stands a good chance of holding on its second time back. Therefore, as long as price does not hit 1211.3 before connecting with the above said H4 supply, we’ll be looking for lower timeframe sell opportunities around this region knowing we’ll be trading in-line with higher-timeframe flow (see above in bold).
As we have already mentioned above in other markets, traders might want to tread carefully both today and Monday as liquidity will likely be thin in view of the Easter break.
Levels to watch/live orders:
- Buys: 1211.3 [Tentative – confirmation required] (Stop loss: dependent on where one confirms this level).
- Sells: 1224.6-1226.8 [Tentative – confirmation required] (Stop loss: dependent on where one confirms this area).