EUR/USD:
Latest economic reports came in largely disappointing, with service and manufacturing slowing in Germany and the Eurozone. The German IFO also echoed a negative tone, coming in much lower than expected. Despite this, after dropping to a fresh yearly low against the US dollar, the EUR/USD witnessed a sharp change in mood, fuelled by pressure on the US dollar following substandard PMIs.
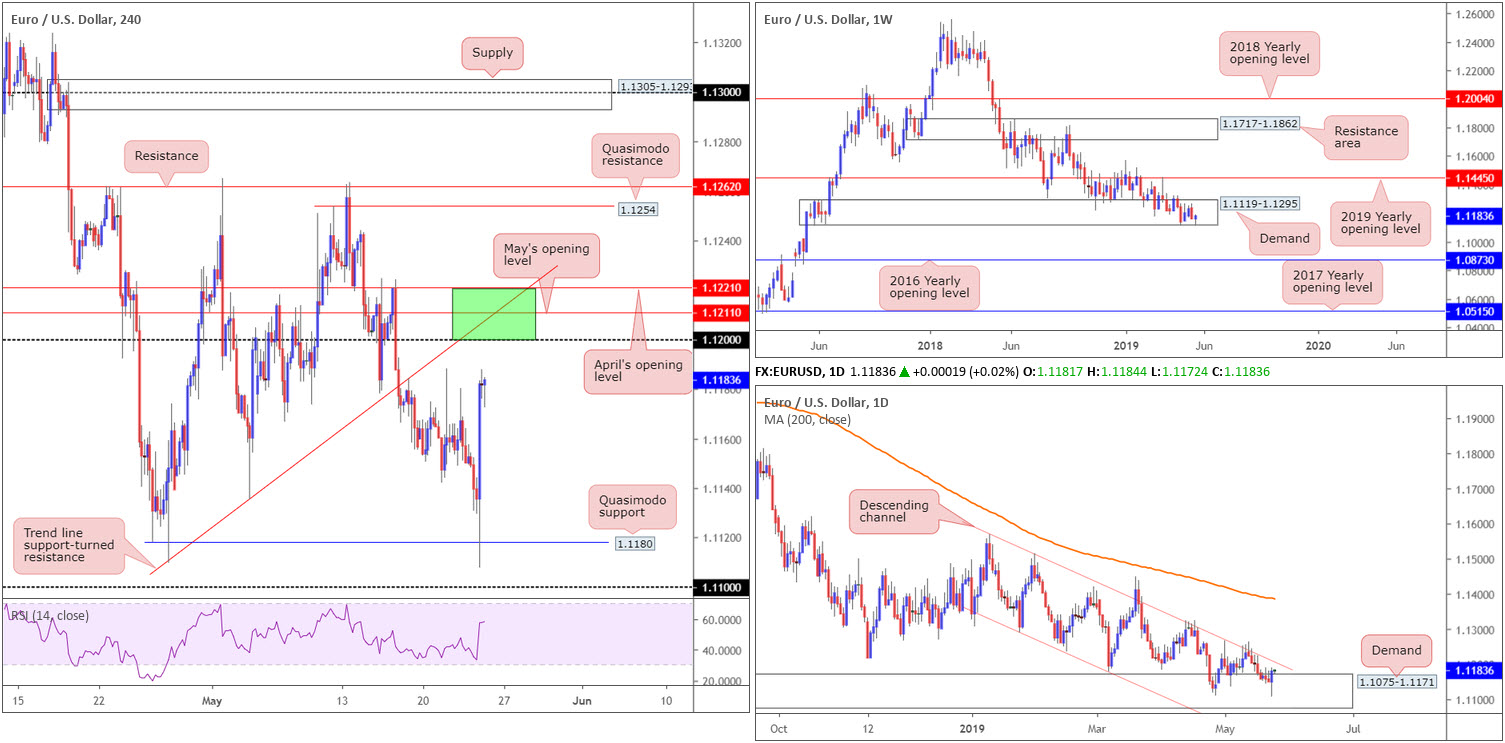
H4 flow shook hands with Quasimodo support at 1.1180 and concluded Thursday within striking distance of the 1.12 handle. Beyond this psychological mark, May’s opening level at 1.1211, April’s opening level at 1.1221 and trend line support-turned resistance (taken from the low 1.1109) are visible resistances to be aware of.
The current candle on the weekly timeframe is attempting to recover, following a marginal breach to the lower edge of a long-standing demand at 1.1119-1.1295. In the event a decisive break of the aforesaid demand is observed, traders’ crosshairs will likely be fixed on the 2016 yearly opening level at 1.0873. This, according to our technical studies, remains a possibility, given the long-term trend facing a southerly bearing since topping in early 2018.
The central focus on the daily timeframe is demand parked at 1.1075-1.1171 (glued to the underside of the current weekly demand area). Although price respected the zone in recent trading, the unit remains hampered by nearby channel resistance etched from the high 1.1569.
Areas of consideration:
Longer term, although the overall trend is facing south, selling this market is challenging owing to demand seen on the weekly and daily timeframes.
Shorter-term traders, however, are encouraged to keep an eye on the 1.1221/1.12 zone marked in green on the H4 timeframe for potential selling opportunities today. Not only is the area comprised of multiple H4 resistances, it also aligns with the aforesaid daily channel resistance. Traders concerned about weekly and daily demand may opt to wait and see how H4 price action behaves prior to pulling the trigger. Should the pair chalk up a strong bearish candlestick pattern or cross beneath a lower-timeframe moving average, for example, this should be sufficient enough to prove seller intent, at least for a profitable bounce.
Today’s data points: US Core Durable Goods Orders m/m; US Durable Goods Orders m/m.
GBP/USD:
Cable largely took its cue from EUR/USD movement Thursday, though continued speculation on when PM May will leave hindered upside.
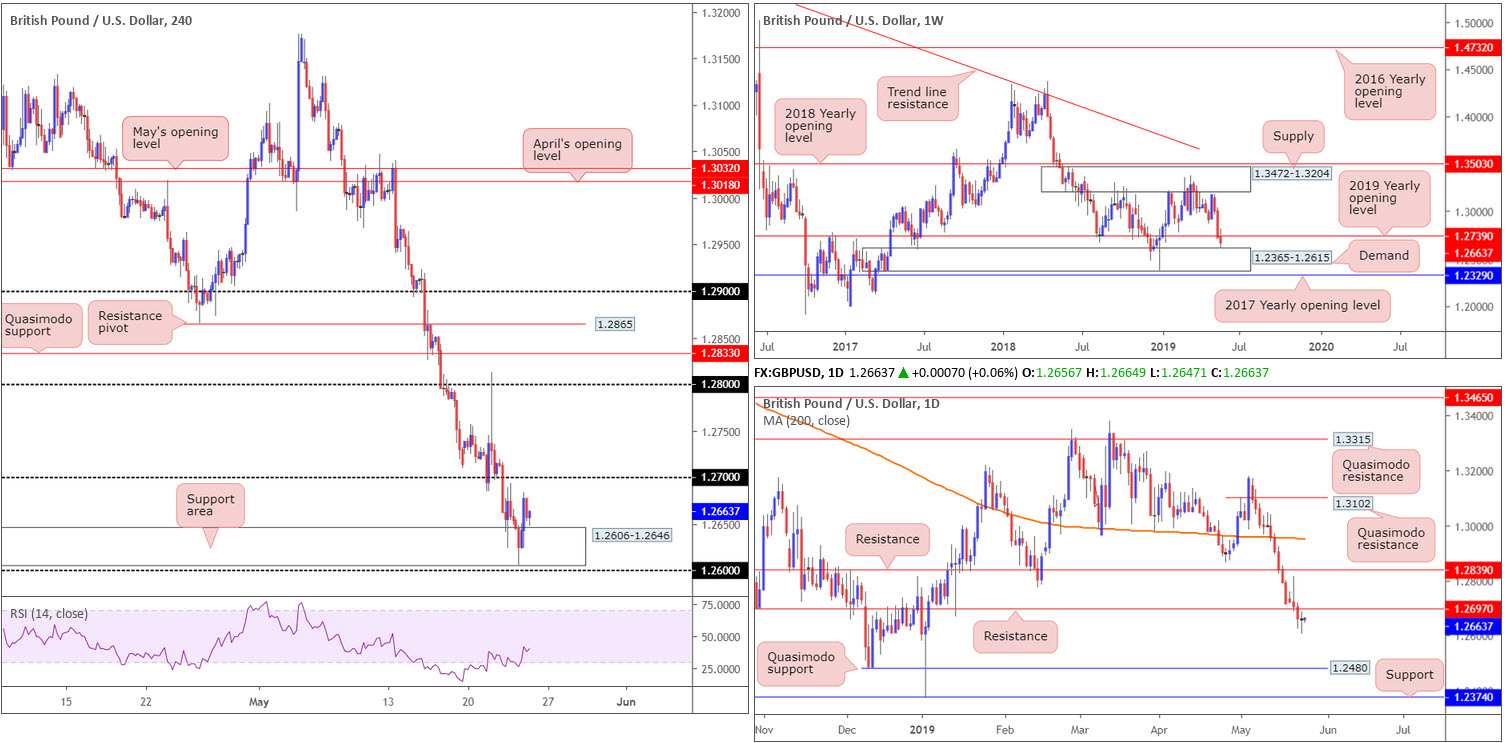
Following a push to lows of 1.2605, levels not seen since early January, the GBP/USD recovered from the lower limits of a H4 support area coming in at 1.2606-1.2646. The next upside objective from here falls in around the 1.27 handle.
1.27 is an interesting resistance, not only because we’re currently entrenched within a reasonably dominant downtrend, but also due to 1.27 merging with resistance on the daily timeframe from 1.2697. Contrary to this theory, however, is the weekly timeframe’s position: rebounding off the top edge of a demand base coming in at 1.2365-1.2615, with the next resistance not expected to enter the fold until the 2019 yearly opening level at 1.2739.
Areas of consideration:
As higher-timeframe structure typically takes precedence over the lower-timeframe structure, a break of 1.27 to the upside is a possibility today/early next week. A H4 close above this number clears the pathway north towards 1.28, opens the door to further buying on the daily scale to resistance at 1.2839 and also validates upside strength from the current weekly demand. The downside to this is the threat of weekly resistance emerging around 1.2739.
Ultimately, a H4 close above 1.27, followed up with a retest in the shape of a bullish candlestick formation (entry and risk parameters can be adjusted according to this structure) would, according to our reading, likely entice buyers into the market, targeting 1.2739, 1.28 and 1.2839.
Today’s data points: UK Retail Sales m/m; US Core Durable Goods Orders m/m; US Durable Goods Orders m/m.
AUD/USD:
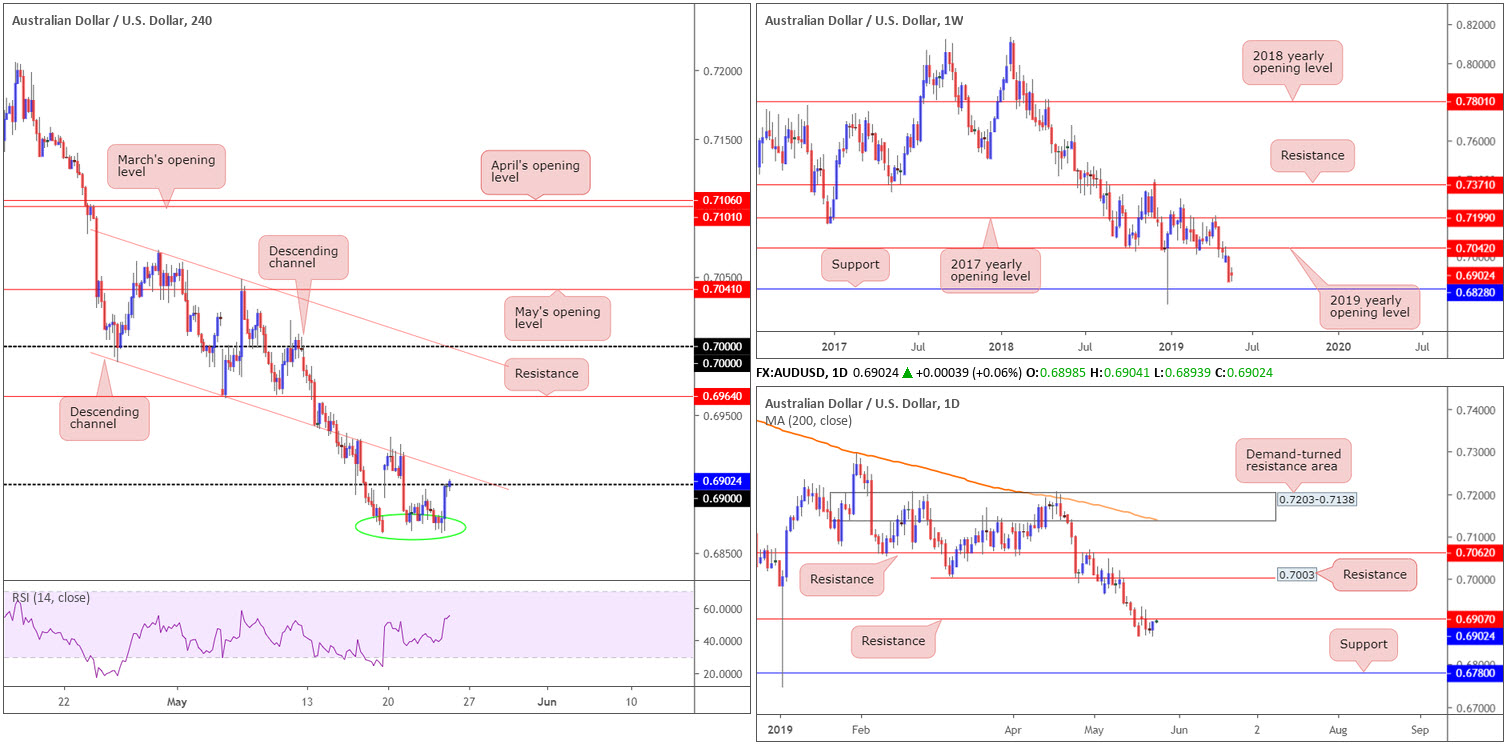
AUD/USD bulls went on the offensive Thursday, bolstered by a waning buck after US PMIs reported lower-than-expected numbers. H4 flow recovered from a local base of support (green circle) around 0.6866ish and finished the day crossing swords with the underside of 0.69.
Circulating above 0.69, we have H4 channel support-turned resistance taken from the low 0.6988 and also a daily resistance level parked at 0.6907. The combination of these three levels, coupled with the overall trend in this market being entrenched within a year-long slide, offers traders a platform to potentially consider shorting opportunities today.
Below 0.69, the research team notes limited support, aside from the local base around 0.6866ish, until connecting with 0.68. This downside projection is further highlighted on the higher timeframes. Weekly price exhibits scope to press as far south as support coming in at 0.6828, and daily action, after crossing back beneath support (now acting resistance) at 0.6907, has support at 0.6780 to target.
Areas of consideration:
On account of the overall technical picture, the pendulum still appears to be swinging in favour of sellers, despite yesterday’s recovery.
Should the market print a notable H4 bearish candlestick pattern at 0.6907/0.69 today, this is likely enough to encourage sellers into the market, targeting downside points voiced above.
Today’s data points: US Core Durable Goods Orders m/m; US Durable Goods Orders m/m.
USD/JPY:
As US equities plunged lower across the board, and the US 10-year Treasury note dropped more than 2.00% as well as the US dollar index faded 98.00, the USD/JPY wrapped up Thursday’s session down by 0.68%.
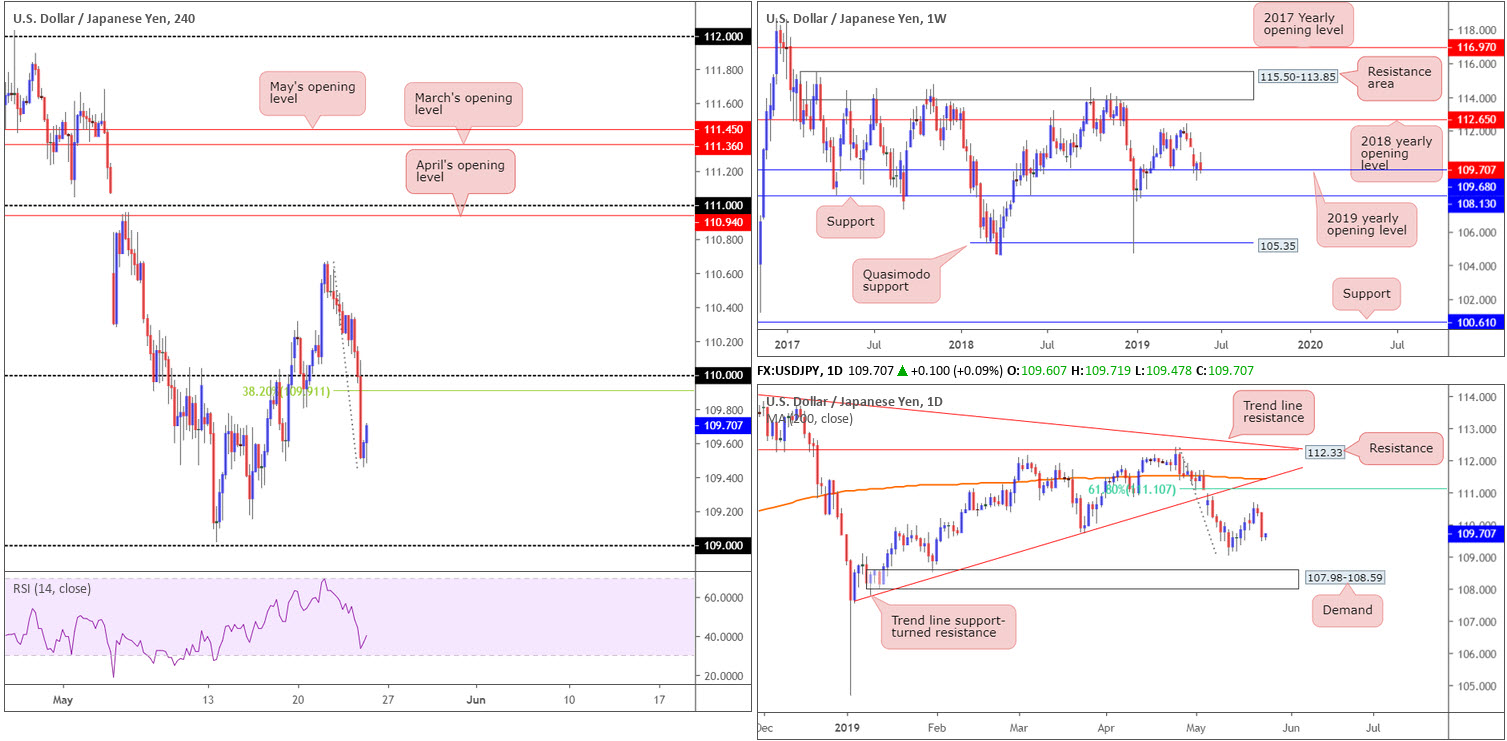
Technically, we can see the H4 candles dethroned 110 as support and tested lows of 109.45, before mildly paring losses into the close. To the left of current price, limited demand is visible until reaching 109.
The story on the higher timeframes, however, has weekly price teasing the 2019 yearly opening level at 109.68, while daily flow has its eye on the 109.01 May 13 low (essentially the 109 handle mentioned above on the H4 timeframe) as its next downside objective. Beyond 109.01, traders may also wish to acknowledge demand coming in at 107.98-108.59.
Areas of consideration:
With weekly price suggesting a move higher could be on the cards, and daily action pointing to a move lower, higher-timeframe direction is somewhat uneven for the time being.
Shorter-term flows on the H4 timeframe, nevertheless, shows 110 to be a reasonably attractive resistance, having seen how well it held as resistance in early May. Apart from a 38.2% Fibonacci resistance at 109.91, though, the research team notes limited confluence. Therefore, traders are encouraged to take a cautious stance should this level enter the fray today.
Today’s data points: US Core Durable Goods Orders m/m; US Durable Goods Orders m/m.
USD/CAD:
Outlook unchanged.
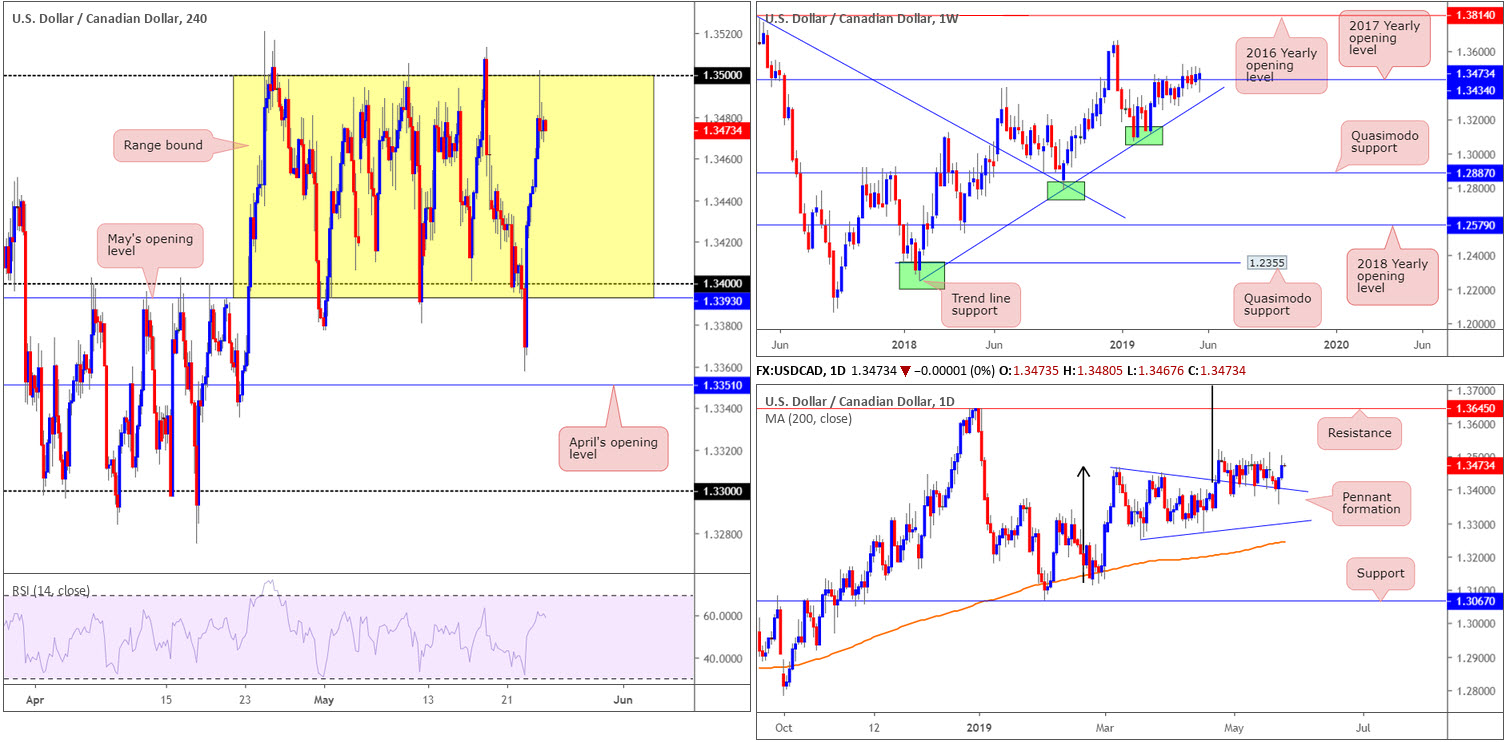
Softening oil prices – WTI had its worst day this year, down more than 5.00% – weighed on the Canadian dollar Thursday, therefore propping up the USD/CAD market. This led to a move materialising towards the 1.35 handle on the H4 timeframe, which, as you can see, held into the close as resistance.
Overall, the H4 candles, since the latter part of April, have been busy carving out a 100-point+ range between May’s opening level at 1.3393/1.34 and the round number 1.35.
On a wider context, longer-term flows broke out above the 2017 yearly opening level at 1.3434 on the weekly timeframe, though has so far failed to breed much follow-through momentum. Areas outside of this level to be aware of fall in around the 2018 yearly high of 1.3664, and a trend line support etched from the low 1.2247.
A closer reading of price action shows the daily candles continue to feed off support drawn from the top edge of a pennant pattern (1.3467). Although the traditional price target (calculated by taking the distance from the beginning of the preceding move and adding it to the breakout price) remains on the chart at 1.3768 (black arrows), the next upside target from a structural standpoint falls in around resistance at 1.3645.
Areas of consideration:
In the event we continue to push higher the market may observe a H4 close form above the 1.35 figure. Should a close higher occur, traders have the choice of either buying the breakout candle and placing stop-loss orders beneath its tail, or waiting and seeing if a retest scenario takes shape and entering on the back of the rejection candle’s structure. The next upside target on the H4 scale can be seen around 1.3570 (not seen on the screen), though according to the higher timeframes we could be heading much higher.
Further rejection off 1.35 may also be of interest to some traders, but remain aware the higher-timeframe picture is pointing to further buying.
Today’s data points: US Core Durable Goods Orders m/m; US Durable Goods Orders m/m.
USD/CHF:
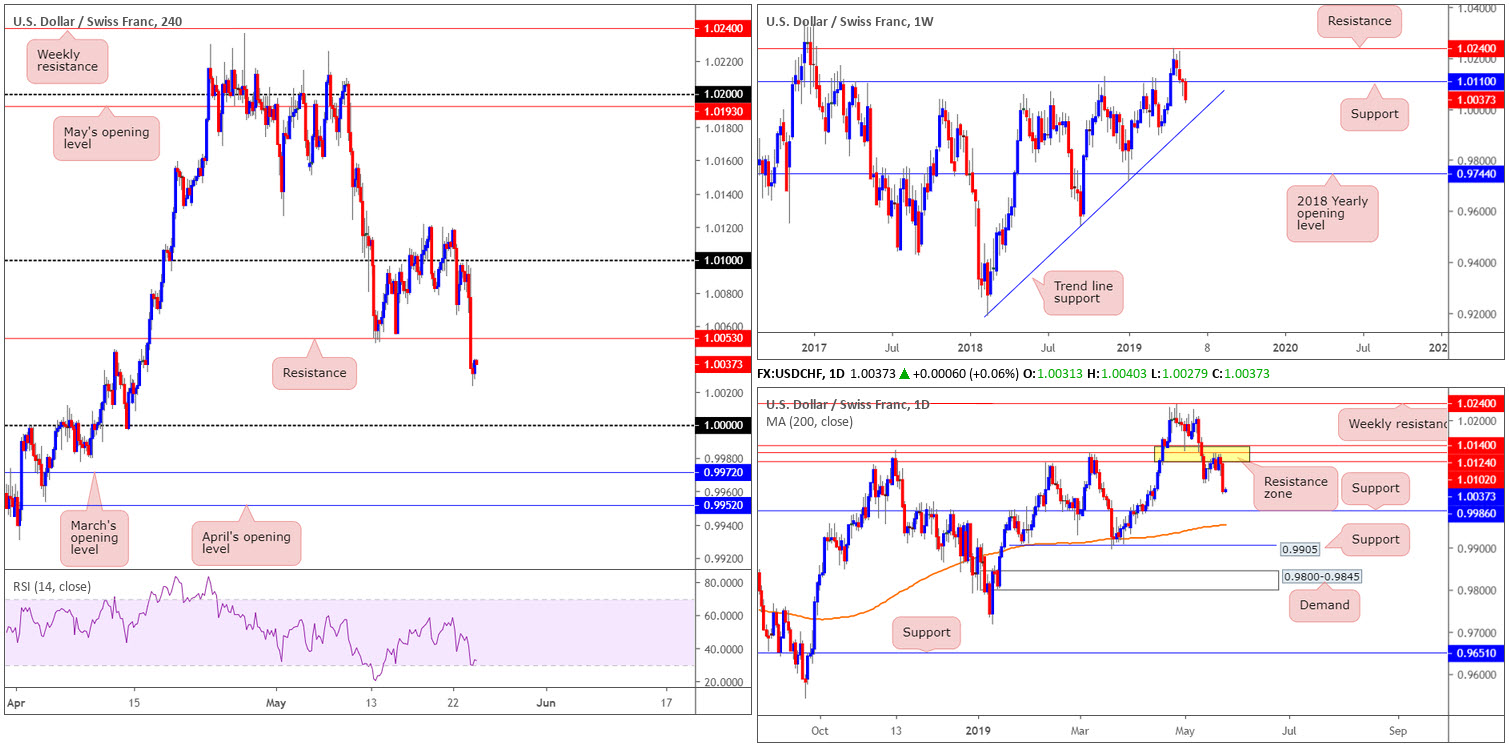
USD/CHF extended losses Thursday on the back of broad-based dollar selling. The move, according to H4 action, overthrew support at 1.0053, which could potentially serve the market as resistance going forward. Another important highlight resulting from yesterday’s slide is 1.0000 (parity), which, by and of itself, is a recognised level.
Switching to the higher timeframes, traders will likely acknowledge weekly price trading through support at 1.0110, targeting a possible run towards trend line support etched from the low 0.9187. Daily movement, on the other hand, pressed lower from a robust resistance zone between 1.0102/1.0140, now eyeing 0.9986 as its next support level.
Areas of consideration:
With all three timeframes suggesting a continuation of selling today, short-term traders likely have eyes on a retest scenario at H4 resistance drawn from 1.0053, targeting 1.0000 as the initial take-profit zone. To increase the odds of 1.0053 holding as resistance, traders are encouraged to wait for additional confirmation to take shape before pressing the sell button, be it a candlestick signal, an MA crossover or even lower-timeframe confirming structure: a support-turned resistance retest.
Today’s data points: US Core Durable Goods Orders m/m; US Durable Goods Orders m/m.
Dow Jones Industrial Average:
The Dow Jones Industrial Average fell 269 points (-1.04%) Thursday following the latest flare-up in US/China trade tensions, consequently dampening investors’ expectations of a near-term resolution.
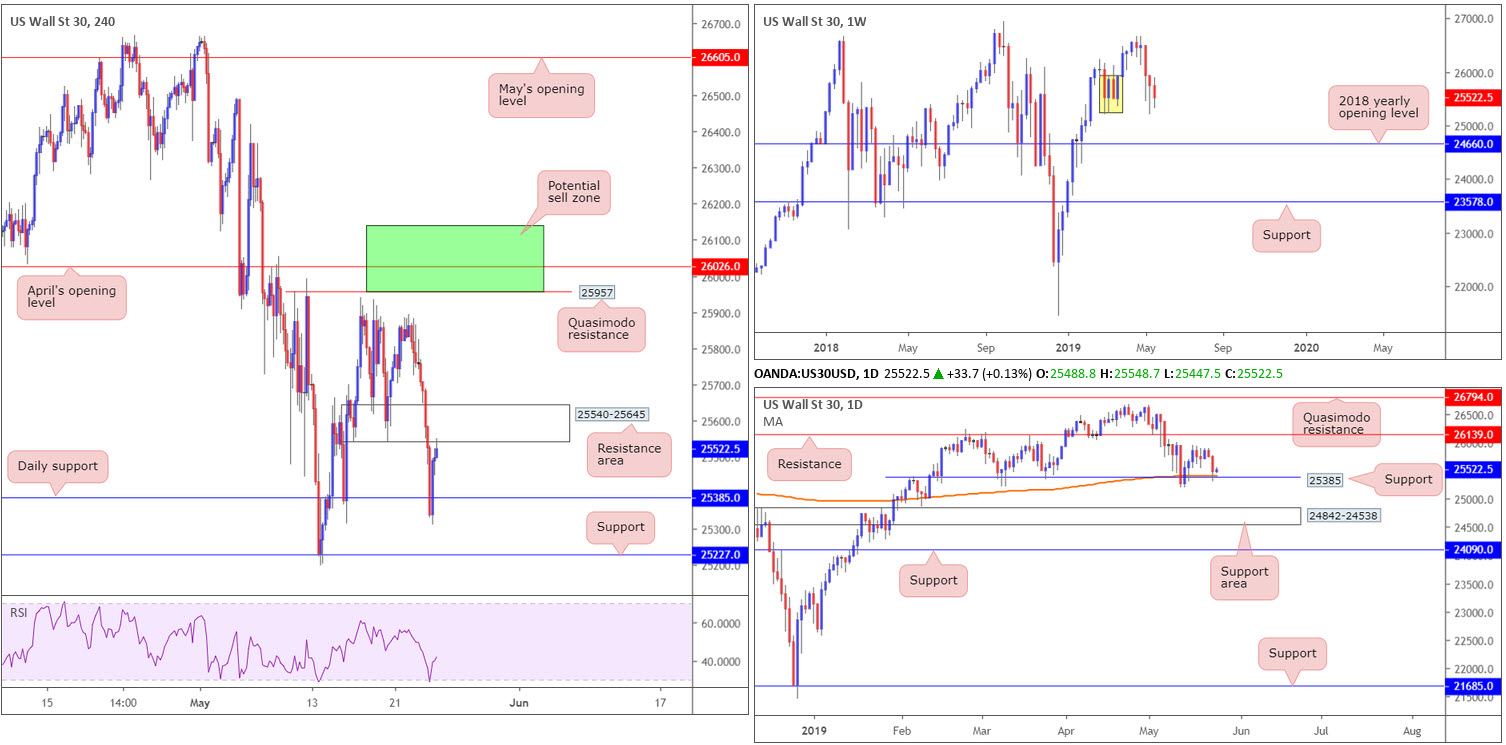
Despite two days of consecutive selling, weekly structure, in the form of demand marked in yellow at 25217-25927 (although unlikely to be considered a strong area on this timeframe owing to limited momentum produced from the base) remains in the fold.
In conjunction with weekly activity, daily movement is shaking hands with notable support at 25385, which happens to intersect with the 200-day SMA. Technically, this may provide a platform for buyers to enter the market, with the next upside point of interest falling in at resistance fixed from 26139.
Closer analysis of the H4 timeframe, nevertheless, reveals the bounce from the aforesaid daily support faces a potential ceiling by way of a resistance area coming in at 25540-25645. Should we engulf this zone, upside will likely be confirmed at least until the candles touch gloves with H4 Quasimodo resistance at 25957.
Areas of consideration:
In light of the current technical picture, the research team notes, particularly for traders looking to buy this market, waiting for a H4 close above the current H4 resistance area is likely required before active buyers enter the fold. A H4 close above this area that’s followed up with a retest (preferably in the shape of a H4 bullish candlestick configuration – entry/risk can be determined according to this structure) would, given higher-timeframe direction, likely be enough to draw in buyers and push higher.
Another area the research team are particularly fond of is the green zone plotted on the H4 timeframe between 26139 (the daily resistance level) and 25957 (H4 Quasimodo resistance).
Today’s data points: US Core Durable Goods Orders m/m; US Durable Goods Orders m/m.
XAU/USD (GOLD):
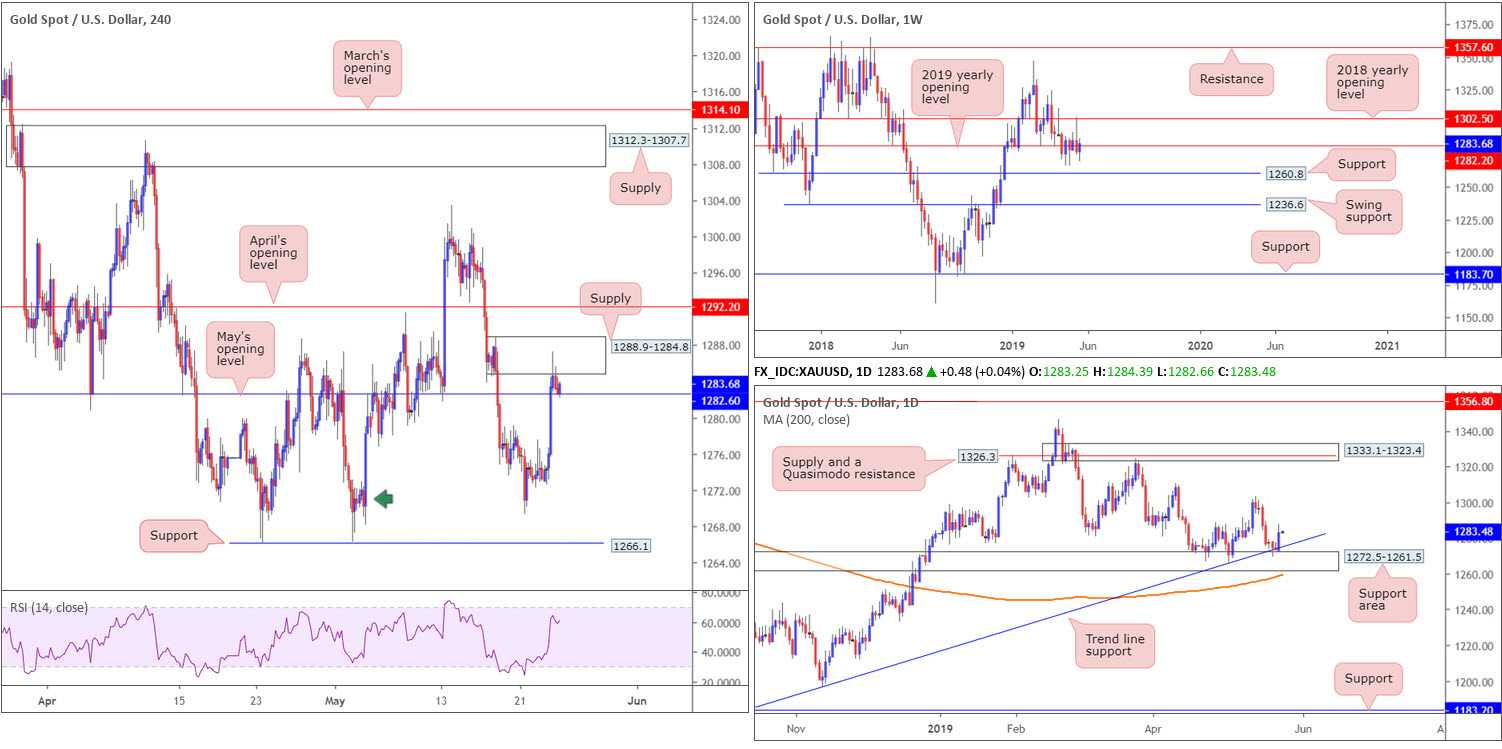
Kicking things off from the top this morning, traders can see the price of gold remains toying with its 2019 yearly opening level at 1282.2 on the weekly timeframe. Surrounding areas to be aware of on this scale are the 2018 yearly opening level at 1302.5 and support coming in at 1260.8.
Moving things to the daily timeframe, the support area at 1272.5-1261.5 – boasts a reasonably solid history and merges with a trend line support taken from the low 1160.3 – held things higher yesterday, with the next upside base appearing to reside around the 1303.4 May 14 high.
Lack of demand for the greenback Thursday saw the yellow metal explore higher ground. H4 movement surpassed May’s opening level at 1282.6 and tested nearby supply coming in at 1288.9-1284.8. Beyond here, the next area of interest falls in around April’s opening level at 1292.2.
Areas of consideration:
Traders showing interest in shorting the current H4 supply zone face potentially strong support. Not only can May’s opening level at 1282.6 offer the market support, we also have to consider the fact further buying may take shape on the back of yesterday’s upsurge from the aforementioned daily support area. For that reason, the H4 supply should be viewed cautiously.
Should the H4 candles pop beneath 1282.6 in the form of a full or near-full-bodied bearish formation, however, a short could then be considered, knowing we have limited support until a H4 demand marked with a green arrow at 1268.1-1272.3 (boasts a connection to the top base of the current daily support area).
The accuracy, completeness and timeliness of the information contained on this site cannot be guaranteed. IC Markets does not warranty, guarantee or make any representations, or assume any liability with regard to financial results based on the use of the information in the site.
News, views, opinions, recommendations and other information obtained from sources outside of www.icmarkets.com.au, used in this site are believed to be reliable, but we cannot guarantee their accuracy or completeness. All such information is subject to change at any time without notice. IC Markets assumes no responsibility for the content of any linked site. The fact that such links may exist does not indicate approval or endorsement of any material contained on any linked site.
IC Markets is not liable for any harm caused by the transmission, through accessing the services or information on this site, of a computer virus, or other computer code or programming device that might be used to access, delete, damage, disable, disrupt or otherwise impede in any manner, the operation of the site or of any user’s software, hardware, data or property.