
A note on lower timeframe confirming price action…
Waiting for lower timeframe confirmation is our main tool to confirm strength within higher timeframe zones, and has really been the key to our trading success. It takes a little time to understand the subtle nuances, however, as each trade is never the same, but once you master the rhythm so to speak, you will be saved from countless unnecessary losing trades. The following is a list of what we look for:
- A break/retest of supply or demand dependent on which way you’re trading.
- A trendline break/retest.
- Buying/selling tails/wicks – essentially we look for a cluster of very obvious spikes off of lower timeframe support and resistance levels within the higher timeframe zone.
- Candlestick patterns. We tend to only stick with pin bars and engulfing bars as these have proven to be the most effective.
We search for lower timeframe confirmation between the M15 the H1 timeframes, since most of our higher-timeframe areas begin with the H4. Stops are usually placed 5-10 pips beyond confirming structures.
EUR/USD:
During the course of yesterday’s sessions the EUR/USD rallied around 100 pips, as recent polls indicated that the ‘remain’ camp are edging out a lead. Voting has now closed in the UK and investors await the final result which is scheduled to be released between 4am-7am GMT today.
Despite the EUR pair rallying around 100 pips, the sell-side of this market were not completely dormant! Active sellers were (and still are) seen defending the 1.1400 region. This – coupled with the fact that weekly price remains trading within a large weekly resistance area at 1.1533-1.1278, as well as daily supply at 1.1446-1.1369 still holding ground, technically shorts are a good bet in our opinion.
Our suggestions: Although the technical picture suggests shorting this market from 1.1400 today, our team is going to steer clear of trading this pair today as uncertainty surrounding the ‘Brexit’ vote will likely cause erratic price action.

Levels to watch/live orders:
- Buys: Flat (Stop loss: N/A).
- Sells: Flat (Stop loss: N/A).
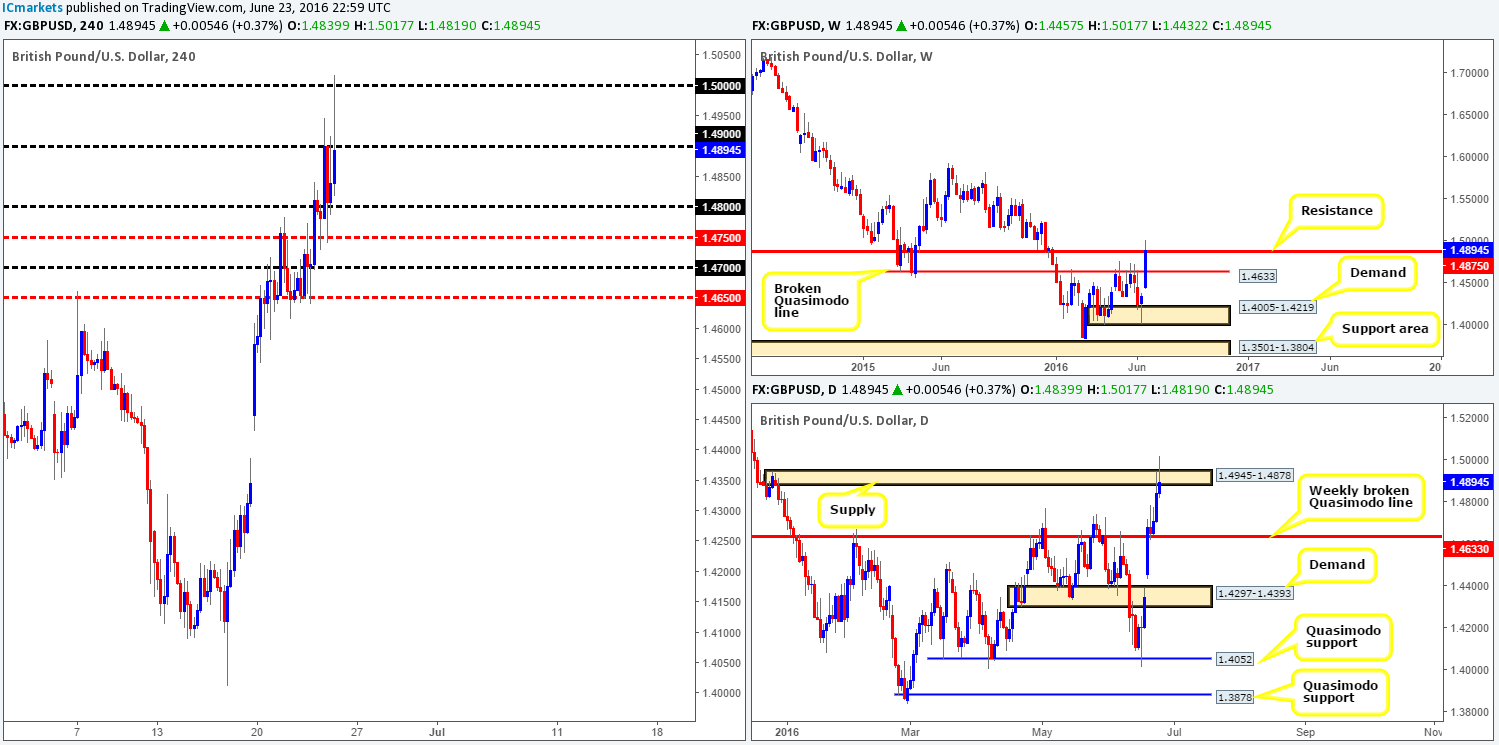
GBP/USD:
Over in the UK votes are now being counted as polling stations across the country have closed. Latest polls show that the ‘remain’ camp is in the lead but there is still an air of uncertainty brewing! Results of the referendum are expected to be released between 4am-7am GMT today.
GBP increased in value against the US dollar yesterday as optimism for a ‘remain’ vote is clearly present. However, the H4 chart shows that cable has just recently dropped over 100 pips down from its peak 1.5017 early in Asia trading. Although over on the weekly chart resistance at 1.4875 is currently in play now, and price seems to be holding around daily supply coming in at 1.4945-1.4878, trading this pair is not something our team would be comfortable with given how close we are to the final results!
Our suggestions: In regard to the GBP/USD pair, our suggestions would be to take your finger off of the mouse button and sit on your hands. We know it is tempting to try and make a quick buck but trading in such volatile conditions is not, at least in our opinion, acting in one’s own best interest.
Levels to watch/live orders:
- Buys: Flat (Stop loss: N/A).
- Sells: Flat (Stop loss: N/A).
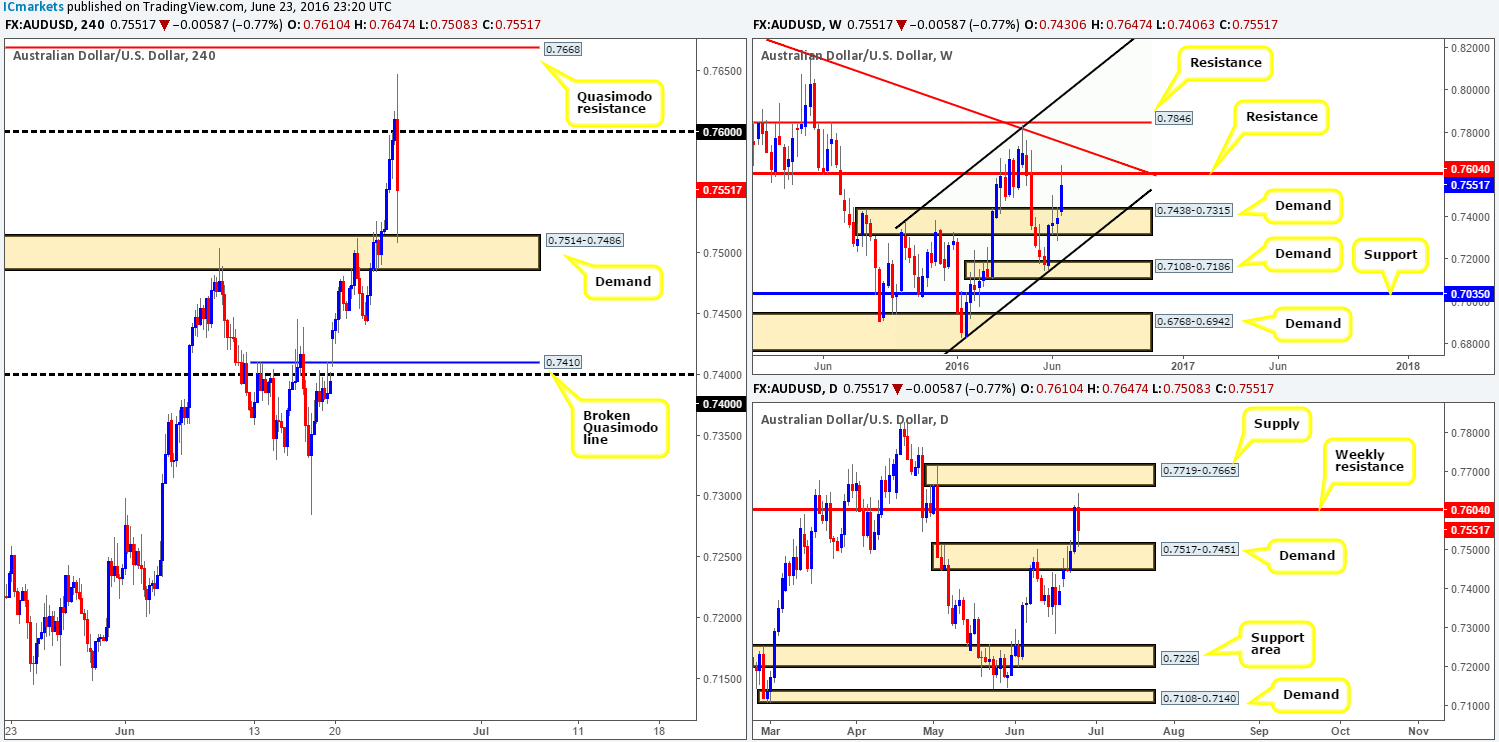
AUD/USD:
Looking at the weekly chart this morning, we can see that the commodity currency recently stabbed into a major-league resistance drawn from 0.7604, which for the time being is holding firm. Technically, we are expecting the market to drop from here to at least retest weekly demand seen at 0.7438-0.7315. Despite room for further downside on the weekly chart, daily action is now flirting with the top-side of a daily demand base penciled in at 0.7517-0.7451 that could potentially halt selling on the weekly chart!
Turning our attention to the H4 chart, the Aussie currency recently peaked at 0.7647 (missing the H4 Quasimodo resistance at 0.7668 by a little over twenty pips), before crashing lower to test H4 demand seen at 0.7514-0.7486 (lodged within the above said daily demand area). Despite price trading at such an historic weekly resistance line (see above), shorting this market when the pair is testing demand on both the H4 and daily charts (see above) is not something we’d stamp high probability!
Our suggestions: Given the expected volatility today surrounding the current ‘Brexit’ situation, and the fact that the path south is obstructed by lower timeframe demands, our team sees little opportunity to trade this unit today. Therefore, opting to stand on the side lines here may very well be the best path to take!
Levels to watch/live orders:
- Buys: Flat (Stop loss: N/A).
- Sells: Flat (Stop loss: N/A).
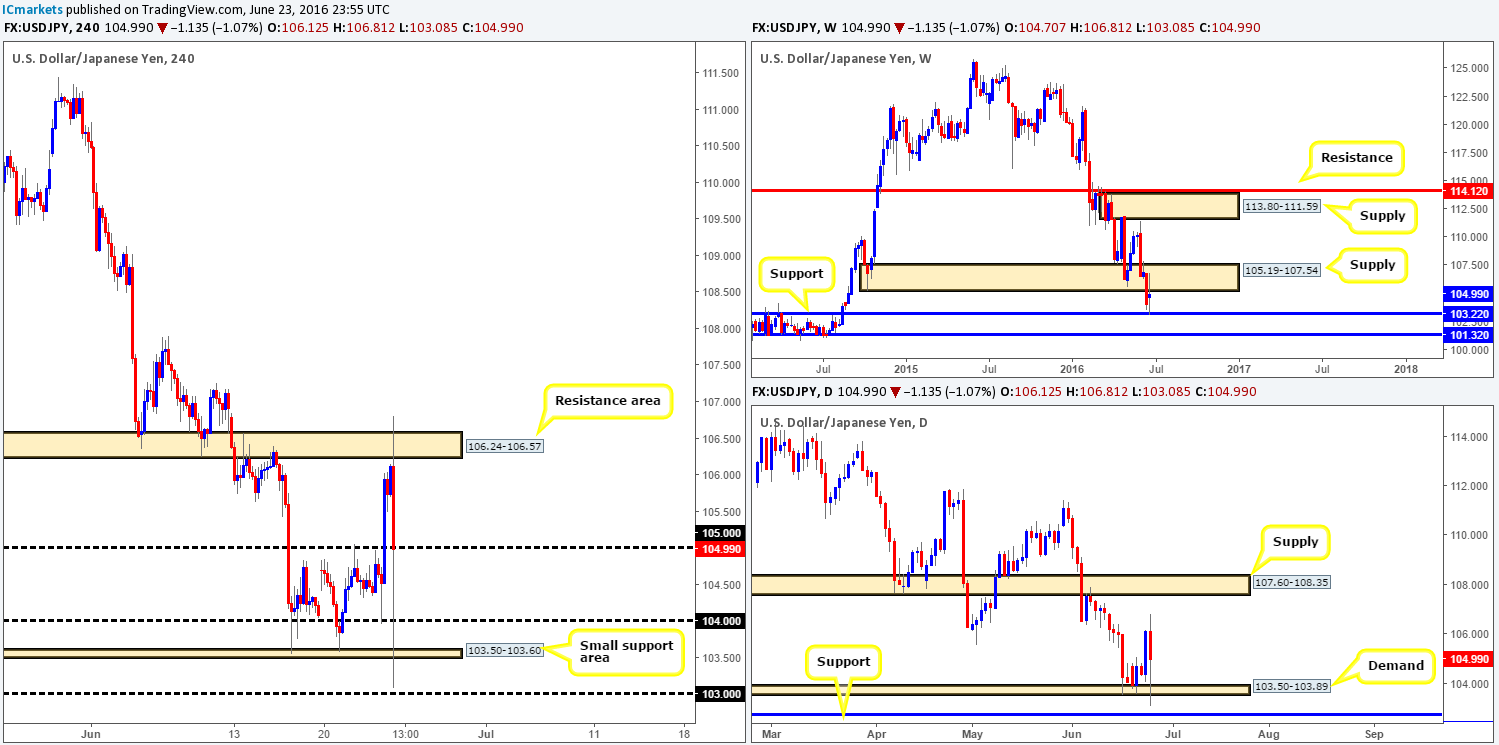
USD/JPY:
Current action on the H4 chart is making a right mess at the moment! Recent ‘Brexit’ support in the north of England sent the USD/JPY crashing to lows of 103.08 down from a peak of 106.81, as investors quickly loaded up on the safe-haven Yen currency.
From a technical standpoint, the buyers and sellers over on the weekly chart remain sandwiched between a large weekly supply zone drawn from 105.19-107.54 and a weekly support coming in at 103.22. Moving down to the daily chart, support has once again been seen from around the small daily demand area at 103.50-103.89. From this angle, the currency has, as far as we can see, the potential to climb up to at least daily supply at 107.60-108.35 (located above the current weekly supply area).
Our suggestions: Seeing first-hand the volatility one can expect today, trading in such a thin market is not something our team would recommend. Yes price may bounce from a level, but you’ll likely be whipsawed out of your position shortly after – is it really worth the risk???
Levels to watch/live orders:
- Buys: Flat (Stop loss: N/A).
- Sells: Flat (Stop loss: N/A).
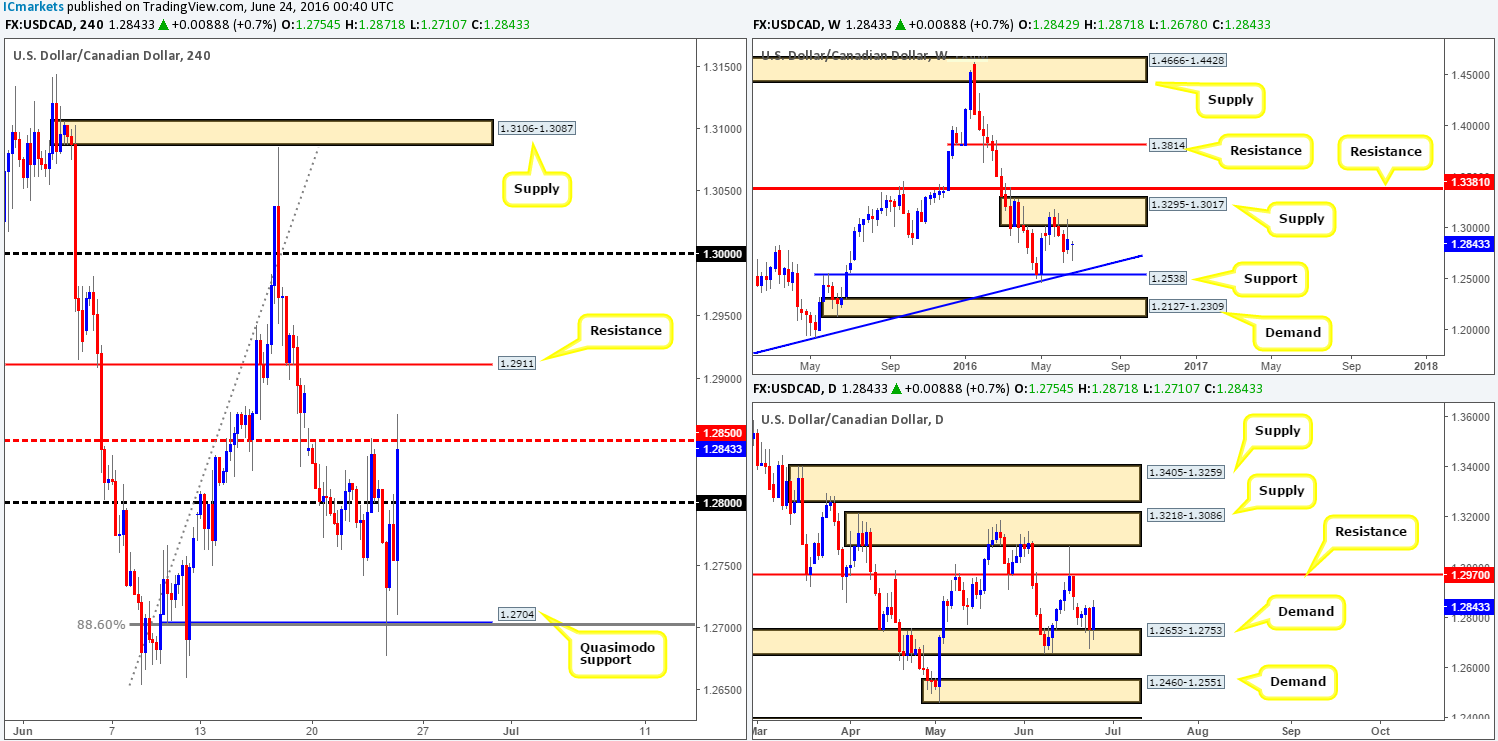
USD/CAD:
Mid-morning trade over in London yesterday saw the USD/CAD bounce beautifully from the H4 Quasimodo support line at 1.2704. As we mentioned in our previous report, 1.2704 was our only line of interest going forward. Not only does this line represent a round number at 1.27, but it also fuses well with a H4 88.6% Fib support at 1.2703 and is positioned within daily demand seen at 1.2653-1.2753. Our team actually passed on this setup due to the following reasons:
1. The uncertainty surrounding the ‘Brexit’ situation.
2. Weekly price just rebounded from a weekly supply zone coming in at 1.3295-1.3017.
Granted, price could retest the underside of the current weekly supply area, and thus open up the possibility for a buy trade in this market up to the 1.30 region.
Our suggestions: At the time of writing, ‘Brexit’ voters are ahead and this is causing turbulence in the market place. A lot of traders are staying out and this has let the market extremely thin. Therefore, even with an exceptionally attractive technical setup we’ll be taking no chances today as we remain on the sidelines!
Levels to watch/live orders:
- Buys: Flat (Stop loss: N/A).
- Sells: Flat (Stop loss: N/A).
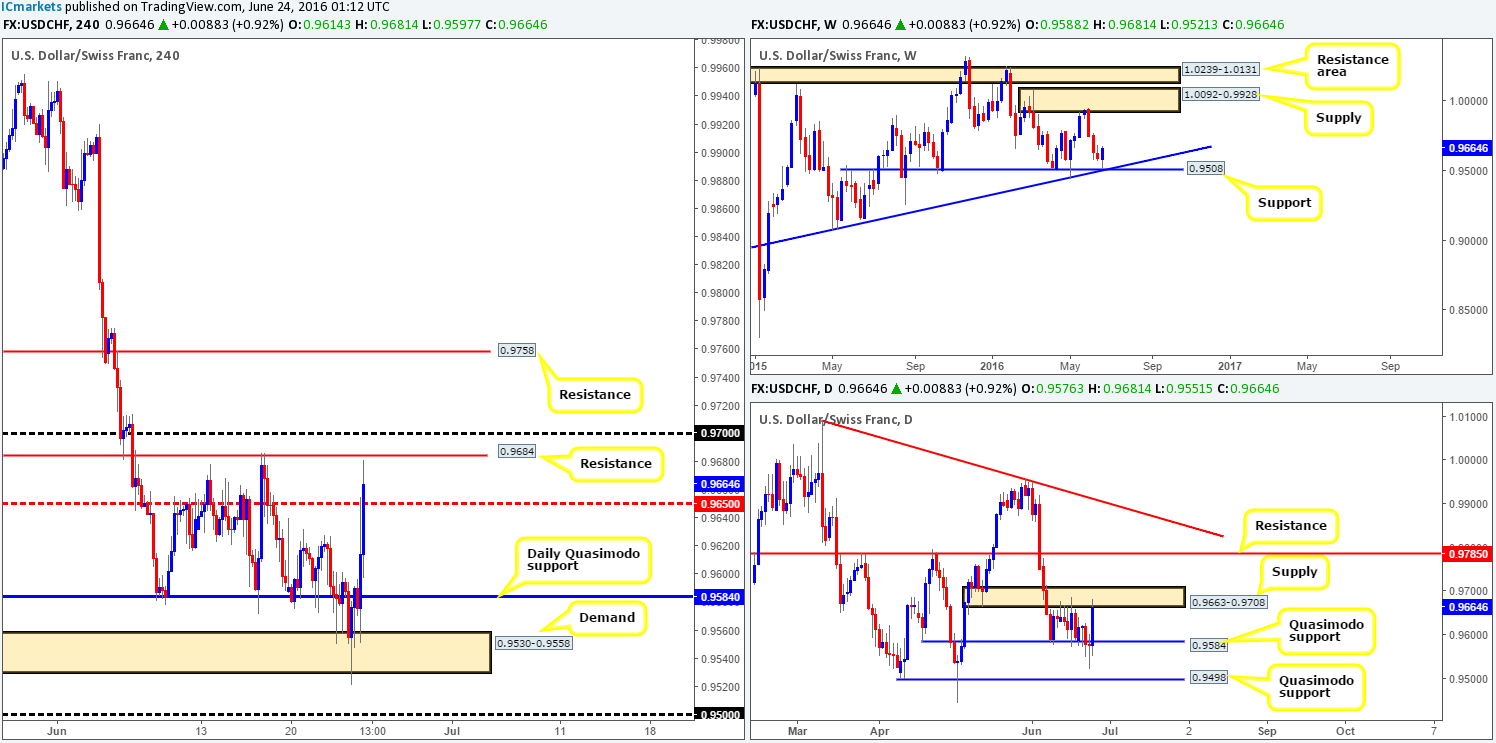
USD/CHF:
Since price tagged weekly supply at 1.0092-0.9928 four weeks ago, the bears have been in control of this market. As can be seen from the weekly chart, candle action has started to reflect a more bullish stance as price recently come within fifteen pips of connecting with a major weekly support level at 0.9508 (coincides nicely with weekly trendline confluence taken from the low 0.9078).
Down on the daily chart, however, supply at 0.9663-0.9708 has recently been brought into play, which could along with daily resistance seen above at 0.9785, prove difficult barriers to overcome before the Swissy touches gloves with the aforementioned weekly supply area.
With EUR and GBP pairs taking a right hammering at the moment on the prospect of a possible ‘Brexit’, H4 action on the USD/CHF continues to climb higher and is now within touching distance of the H4 resistance at 0.9684.
Our suggestions: Technically, we believe this market is ready to be bought above the 0.97 handle. A close above this line followed by a subsequent retest, along with a lower timeframe buy signal (see the top of this report) would usually be a trade we would take. However, in light of recent volatility price is just too erratic for us to consider risking capital right now.
Levels to watch/live orders:
- Buys: Flat (Stop loss: N/A).
- Sells: Flat (Stop loss: N/A).
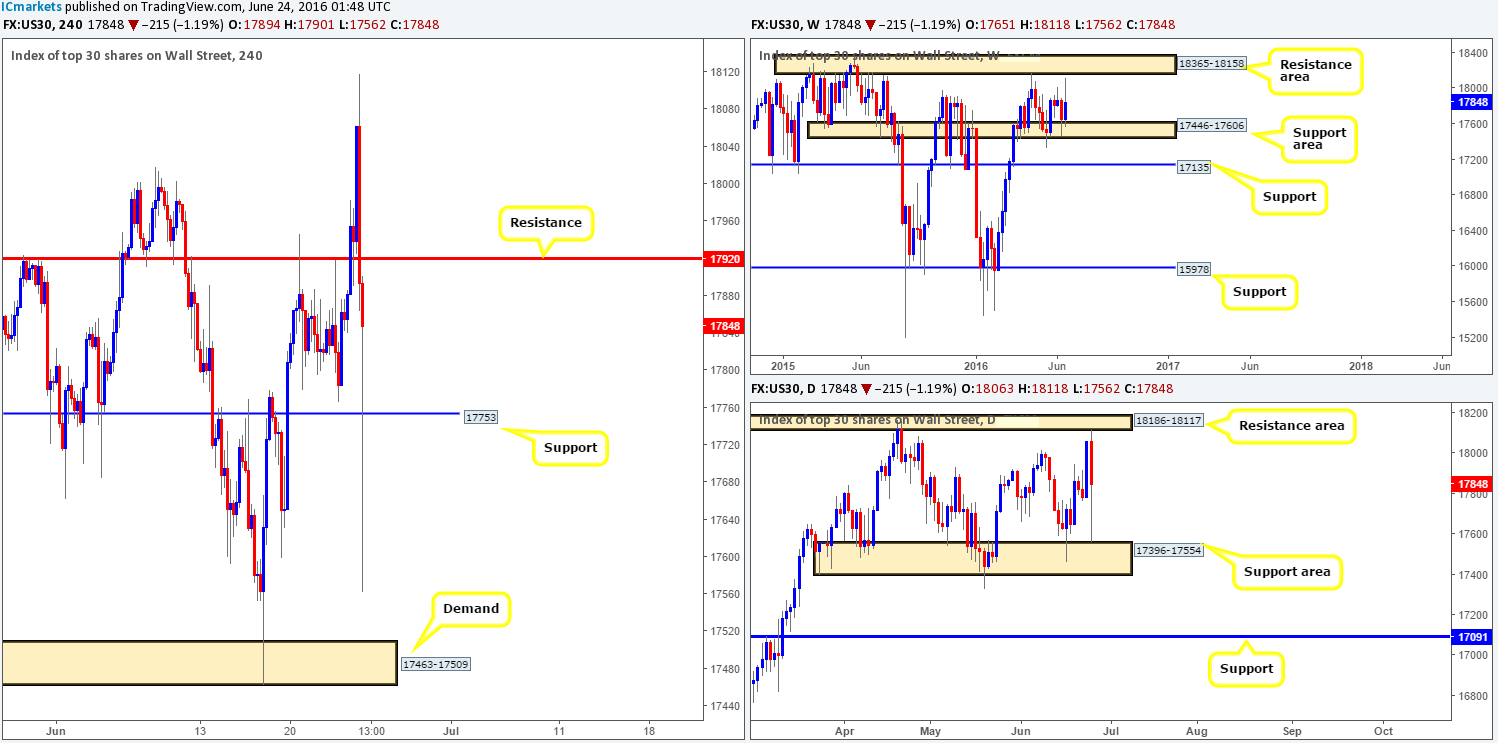
DOW 30:
Despite recent volatility surrounding the ‘Brexit’ affair, weekly buyers remain steady around the weekly support area at 17446-17606. Looking down to the daily chart, nevertheless, the daily resistance area at 18186-18117 was recently brought into play and saw price plummet lower down to just ahead of the daily support area at 17396-17554.
As we have already seen from the higher timeframe charts, US stocks are suffering amid the current volatility. H4 support at 17753 was obliterated, with the DOW coming very close to connecting with a H4 demand at 17463-17509 (positioned within the aforementioned daily support area).
Our suggestions: Let’s be frank here guys, who wants to be involved in something as volatile as this. Granted you may get lucky and pick an area which bounces price a few 100 points but is that what trading is all about? We would strongly advise keeping your finger off the trigger for the time being at least until the dust settles!
Levels to watch/live orders:
- Buys: Flat (Stop loss: N/A).
- Sells: Flat (Stop loss: N/A).
GOLD:
In recent trading, the yellow metal pushed higher as ‘Brexit’ results continue to flood the wire. As we write, however, H4 supply at 1282.1-1278.5, although it was recently breached, is currently holding gold lower. Weekly technicals continue to reflect a bearish stance in this market as price continues to loiter below weekly supply at 1307.4-1280.0. Daily action on the other hand is showing that price found a pocket of bids just below daily support at 1262.2. This, nevertheless, is likely due to the recent selling seen in major risk markets.
Our suggestions: As with the seven markets we’ve already analyzed this morning, gold is no different we’re afraid. We have absolutely no interest whatsoever in getting tangled up in all of this volatility as our team continues to trade flat.

Levels to watch/live orders:
- Buys: Flat (Stop loss: N/A).
- Sells: Flat (Stop loss: N/A).


