
A note on lower timeframe confirming price action…
Waiting for lower timeframe confirmation is our main tool to confirm strength within higher timeframe zones, and has really been the key to our trading success. It takes a little time to understand the subtle nuances, however, as each trade is never the same, but once you master the rhythm so to speak, you will be saved from countless unnecessary losing trades. The following is a list of what we look for:
- A break/retest of supply or demand dependent on which way you’re trading.
- A trendline break/retest.
- Buying/selling tails/wicks – essentially we look for a cluster of very obvious spikes off of lower timeframe support and resistance levels within the higher timeframe zone.
- Candlestick patterns. We tend to stick with pin bars and engulfing bars as these have proven to be the most effective.
We typically search for lower-timeframe confirmation between the M15 and H1 timeframes, since most of our higher-timeframe areas begin with the H4. Stops are usually placed 3-5 pips beyond confirming structures.
EUR/USD:
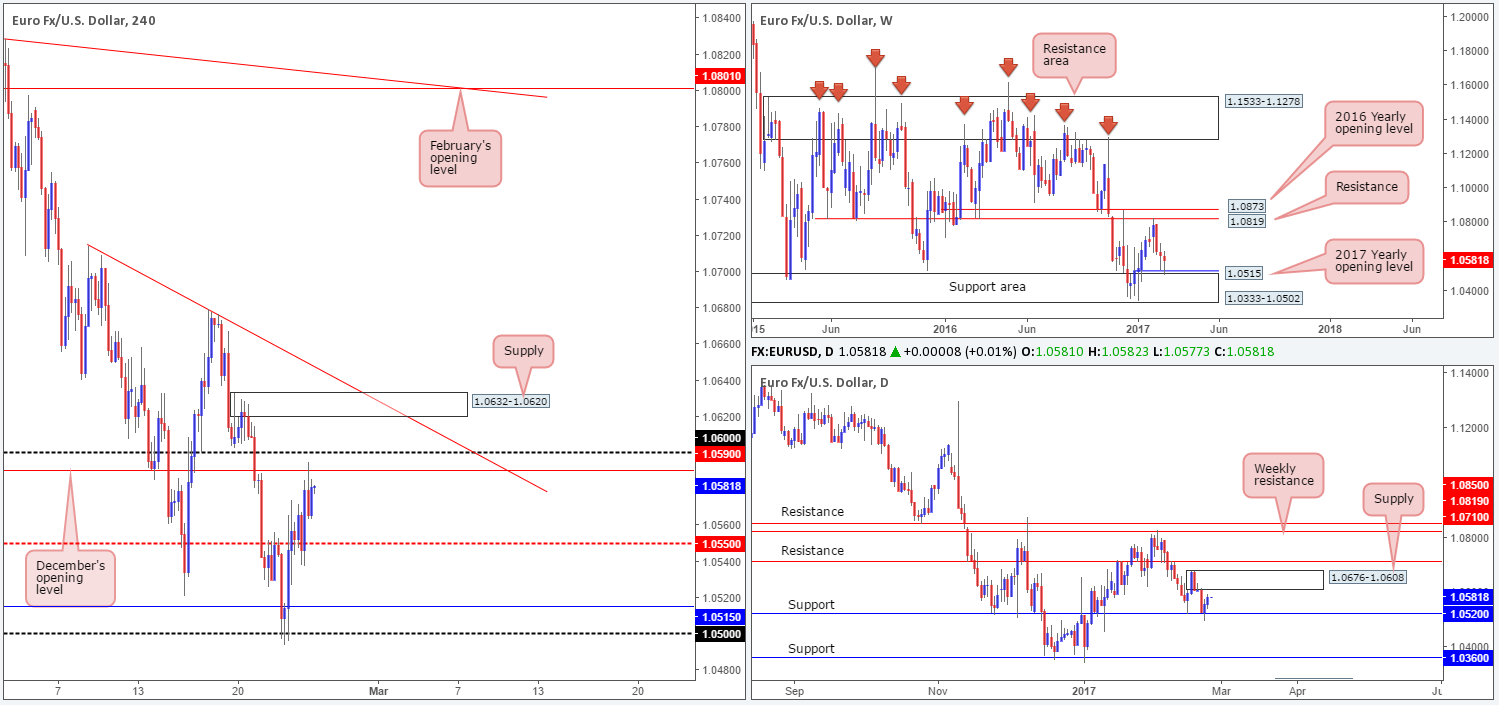
Beginning with the weekly timeframe this morning, we can see that the pair continues to hold its own against the dollar after connecting with the 2017 yearly opening level at 1.0515/weekly support area at 1.0333-1.0502. Although this weekly move was bolstered by a daily support at 1.0520, a nearby daily supply at 1.0676-1.0608 could, however, potentially throw a spanner in the works here!
Over on the H4 candles, the H4 mid-way support at 1.0550 continued to hold firm yesterday and saw the unit gravitate north going into London lunchtime. As you can see, price ended the day closing just ahead of December’s opening base at 1.0590.
Our suggestions: While the weekly timeframe suggests further buying may be on the cards, both the daily and H4 timeframes seem to be throwing up red flags. Buying this market when price is trading just ahead of a daily supply and also a monthly opening level/psychological handle at 1.06 is not something we would advise, no matter how strong the weekly candle appears!
Therefore, we have come to the conclusion that remaining flat may very well be the better path to take today.
Data points to consider: US housing data at 3pm GMT.
Levels to watch/live orders:
- Buys: Flat (stop loss: N/A).
- Sells: Flat (stop loss: N/A).
GBP/USD:
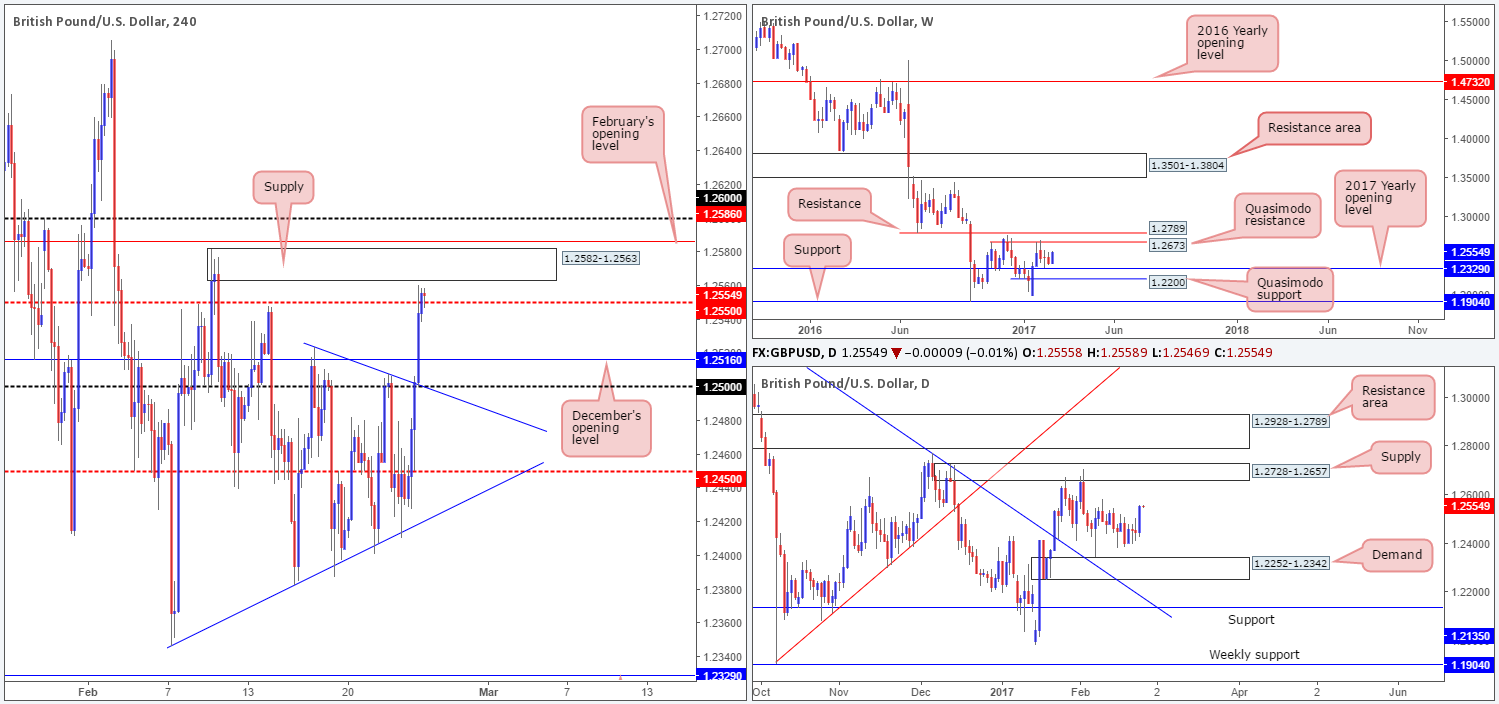
The GBP was a notable mover during yesterday’s trading, rallying over 100 pips (open/close) against its US counterpart. Several H4 tech resistances were taken out during this bullish assault, with price concluding the day closing above a H4 mid-way resistance at 1.2550. Before traders look to buy from above here, it might be worth noting that while the bulls closed the day on a positive note, there is a nearby H4 supply seen within touching distance at 1.2582-1.2563.
Seeing as how the unit currently lacks higher-timeframe (structural) direction at present, there is very little seen supporting the aforementioned H4 supply zone. In fact, there is a strong possibility that this area may suffer a fakeout due to both February’s opening level and psychological handle at 1.26/1.2580 sitting directly above.
Our suggestions: Generally, we only like to trade when there is higher-timeframe convergence unless, of course, there is reasonable H4 confluence. In our opinion, there is not enough in this market to justify a trade at present. As such, we will be taking the safest position of them all today: flat!
Data points to consider: US housing data at 3pm GMT.
Levels to watch/live orders:
- Buys: Flat (stop loss: N/A).
- Sells: Flat (stop loss: N/A).
AUD/USD:
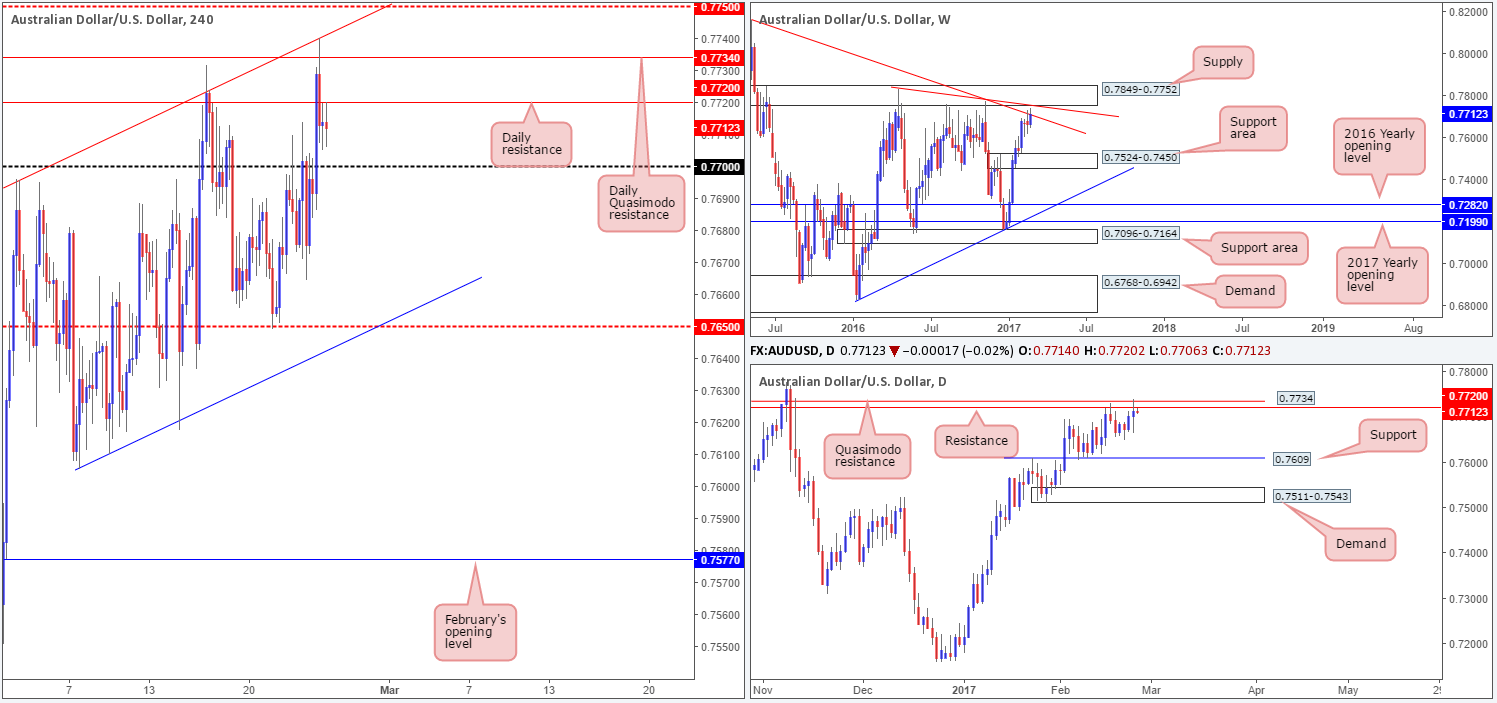
As can be seen from the H4 chart this morning, price action recently connected with a H4 channel resistance stretched from the high 0.7696. Supporting this line is a daily Quasimodo resistance level coming in at 0.7734 and a weekly trendline resistance extended from the high 0.8163. This confluence, as you can see, helped push the commodity currency back below a nearby daily resistance at 0.7720 going into the closing bell.
Our suggestions: Although there’s a possibility that price could still climb up to the H4 mid-level resistance at 0.7750, which represents the lower edge of a long-term weekly supply at 0.7849-0.7752, our overall bias for this pair is south.
With this being the case, what we’re ideally looking for now is a H4 close below the 0.77 handle. This – coupled with a retest and a reasonably sized H4 bear candle would, in our book of technical setups, be considered a high-probability trade, with an initial target set at the H4 channel support taken from the low 0.7605 (intersects nicely with a H4 mid-way support at 0.7650).
Data points to consider: US housing data at 3pm GMT.
Levels to watch/live orders:
- Buys: Flat (stop loss: N/A).
- Sells: Watch for a H4 close below 0.77 and then look to trade any retest seen thereafter ([waiting for a reasonably sized H4 bearish close to form following the retest is advised] stop loss: ideally beyond the trigger candle).
USD/JPY:
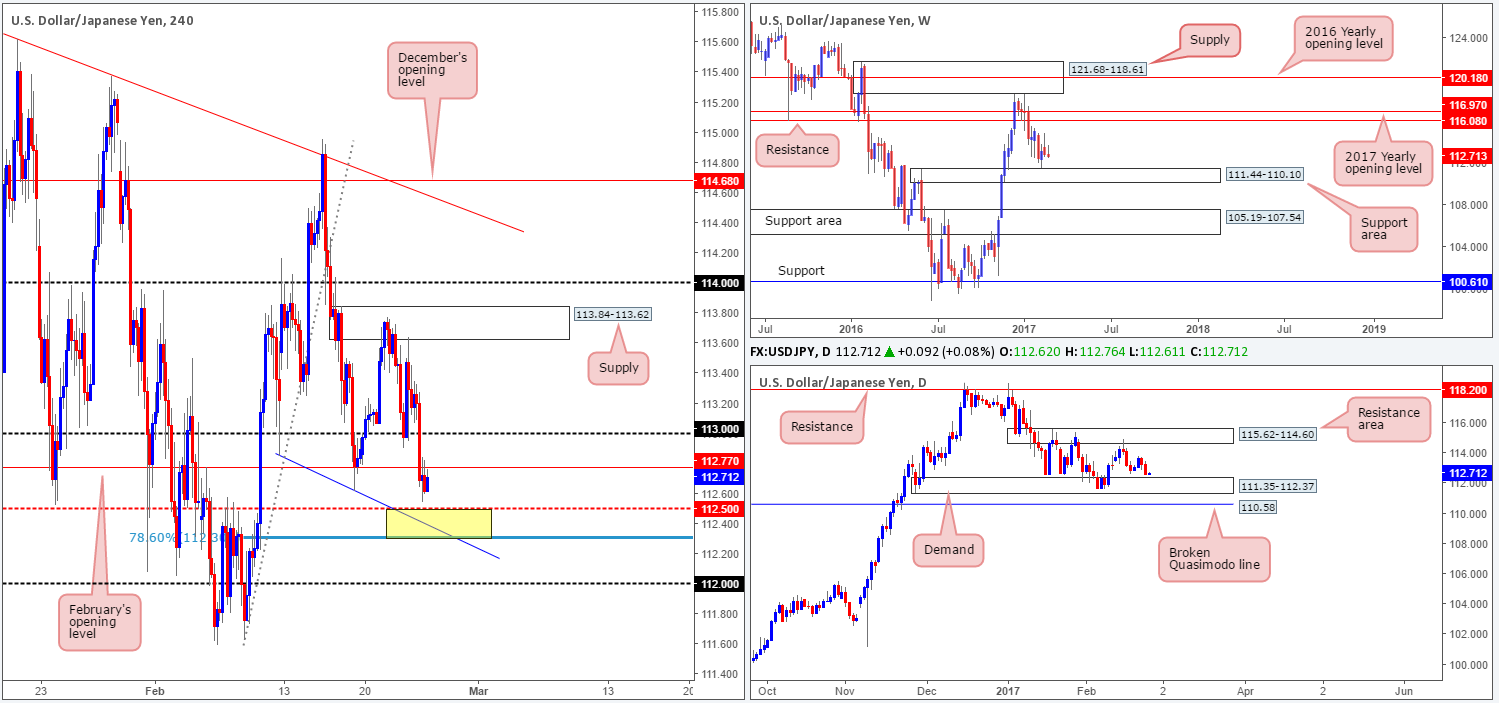
A broadly weaker dollar helped send the USD/JPY lower yesterday, taking out the 113 handle as well as February’s opening level at 112.77. With the H4 candles now seen retesting the underside of this monthly hurdle as resistance, we feel it will not be long until the H4 mid-way support drawn from 112.50 is brought into the picture.
112.50, as you can probably see, is supported by a H4 78.6% retracement at 112.30, a H4 trendline support extended from the low at 112.85 and also the top edge of a daily demand at 112.37. Collectively, this forms a strong-looking area of support, in our opinion (yellow zone).
Our suggestions: Given that we’re unable to locate an obvious H4 demand to the left of the above noted H4 support area, waiting for additional (lower-timeframe) confirmation (see the top of this report) here before pulling the trigger is something we’d advise. As we’re sure you already know, this will by no means guarantee a winning trade, but what it will do is show buyer interest within a high-probability reversal zone.
Data points to consider: US housing data at 3pm GMT.
Levels to watch/live orders:
- Buys: 112.30/112.50 ([wait for a lower-timeframe confirming signal to form before looking to execute a trade] stop loss: dependent on where one confirms this area).
- Sells: Flat (stop loss: N/A).
USD/CAD:
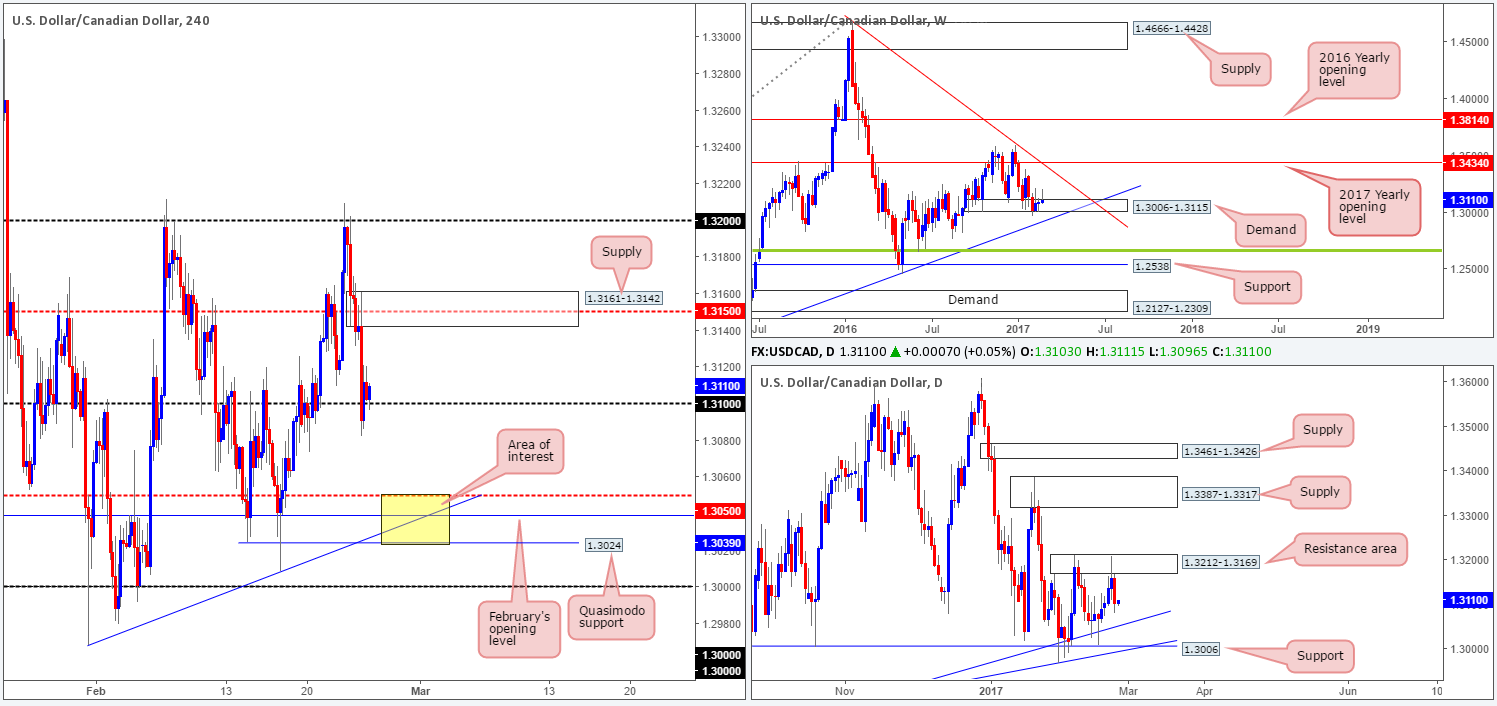
The USD/CAD extended Wednesday’s rejection move from the 1.32 band on Thursday, consuming the H4 mid-way support at 1.3150 and consequently stabbing into the 1.31 handle going into the closing bell. Helped by a daily resistance area coming in at 1.3212-1.3169, the pair aggressively broke a four-day bullish phase.
Although the 1.31 handle is currently holding price higher, we feel it may be on the verge of giving way simply because the daily timeframe shows room to move south down to a daily trendline support extended from the low 1.2822.
Our suggestions: The main area of interest for our desk this morning is seen on the H4 chart below 1.31 at 1.3024/1.3050 (yellow zone). It comprises of the following structures: a H4 mid-way support at 1.3050, February’s opening level at 1.3039, a H4 intersecting trendline support taken from the low 1.2968, a H4 Quasimodo support at 1.3024, the aforementioned daily trendline support and also we have to consider the fact that the weekly candles remain trading within the walls of a weekly demand area at 1.3006-1.3115. In view of this confluence, our team would, dependent on time of day, consider trading this zone without waiting for additional confirmation, with a stop placed around the 1.3016 mark.
Data points to consider: US housing data at 3pm. Canadian inflation report at 1.30pm GMT.
Levels to watch/live orders:
- Buys: 1.3024/1.3050 ([dependent on the time of day, this area could possibly be traded without the need for additional confirmation] stop loss: 1.3016).
- Sells: Flat (stop loss: N/A).
USD/CHF:
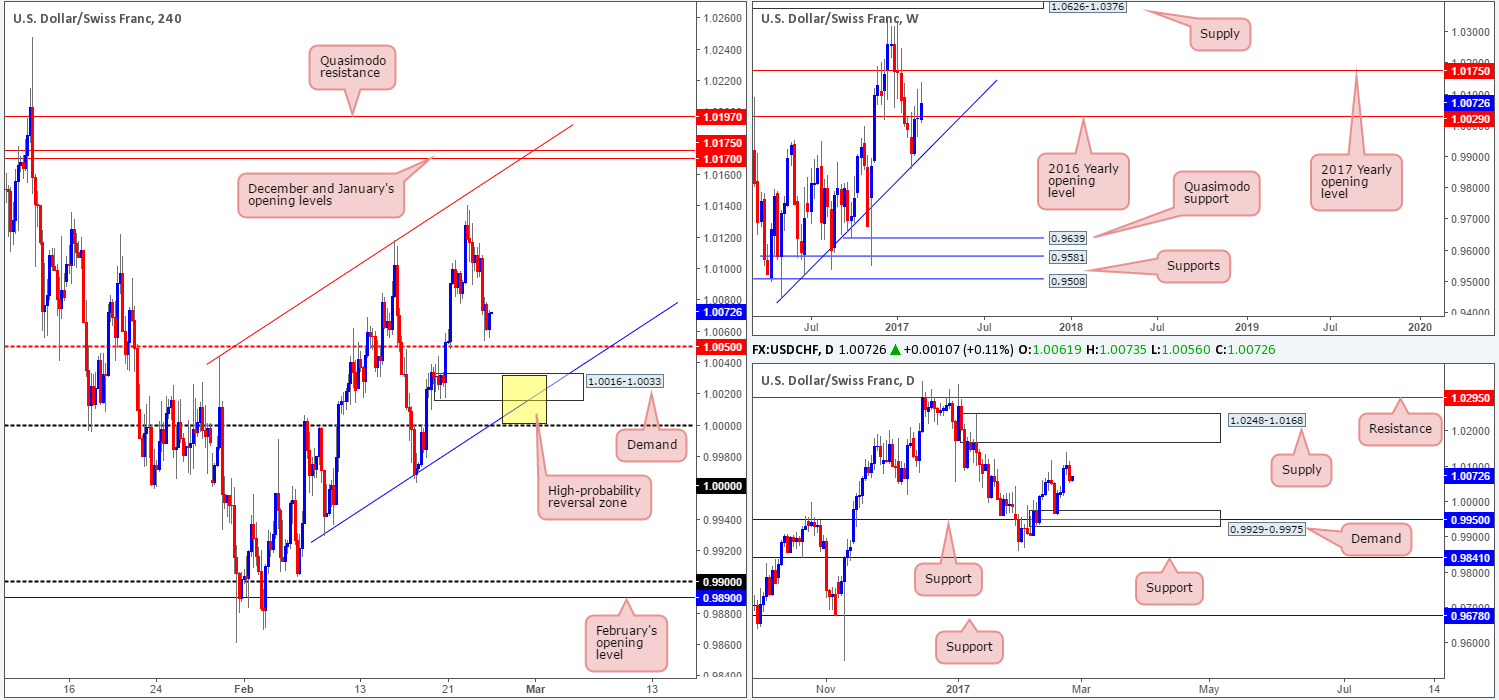
Across the board, we saw the US dollar decline in value yesterday, consequently pushing the USD/CHF into further losses. As we write, the H4 candles are seen trading amid a well-structured H4 ascending chancel (0.9929/1.0044). The next downside target from current price can be seen around the H4 mid-way support hurdle at 1.0050. Beyond this barrier, however, there’s a nearby H4 demand base sitting at 1.0016-1.0033, which happens to converge nicely with the H4 channel support line etched from the low 0.9929 and also the 2016 yearly opening level at 1.0029 (see weekly chart).
Our suggestions: In view of current price, we have little faith in the H4 mid-way support at 1.0050 holding firm today.
Although the chance of a reaction from the above noted H4 demand zone is high in view of its confluence, let’s be mindful to the fact that just beneath this area is parity (1.0000) – a number that is watched by the majority of the market! Therefore, there is a possibility of a fakeout through this zone. So, waiting for a lower-timeframe confirming buy signal (see the top of this report) to form within the walls of 1.0000/1.0033 (yellow zone) would, in our opinion, be the more logical route to take here.
Data points to consider: US housing data at 3pm GMT.
Levels to watch/live orders:
- Buys: 1.0000/1.0033 ([wait for a lower-timeframe confirming signal to form before looking to execute a trade] stop loss: dependent on where one confirms this area).
- Sells: Flat (stop loss: N/A).
DOW 30:
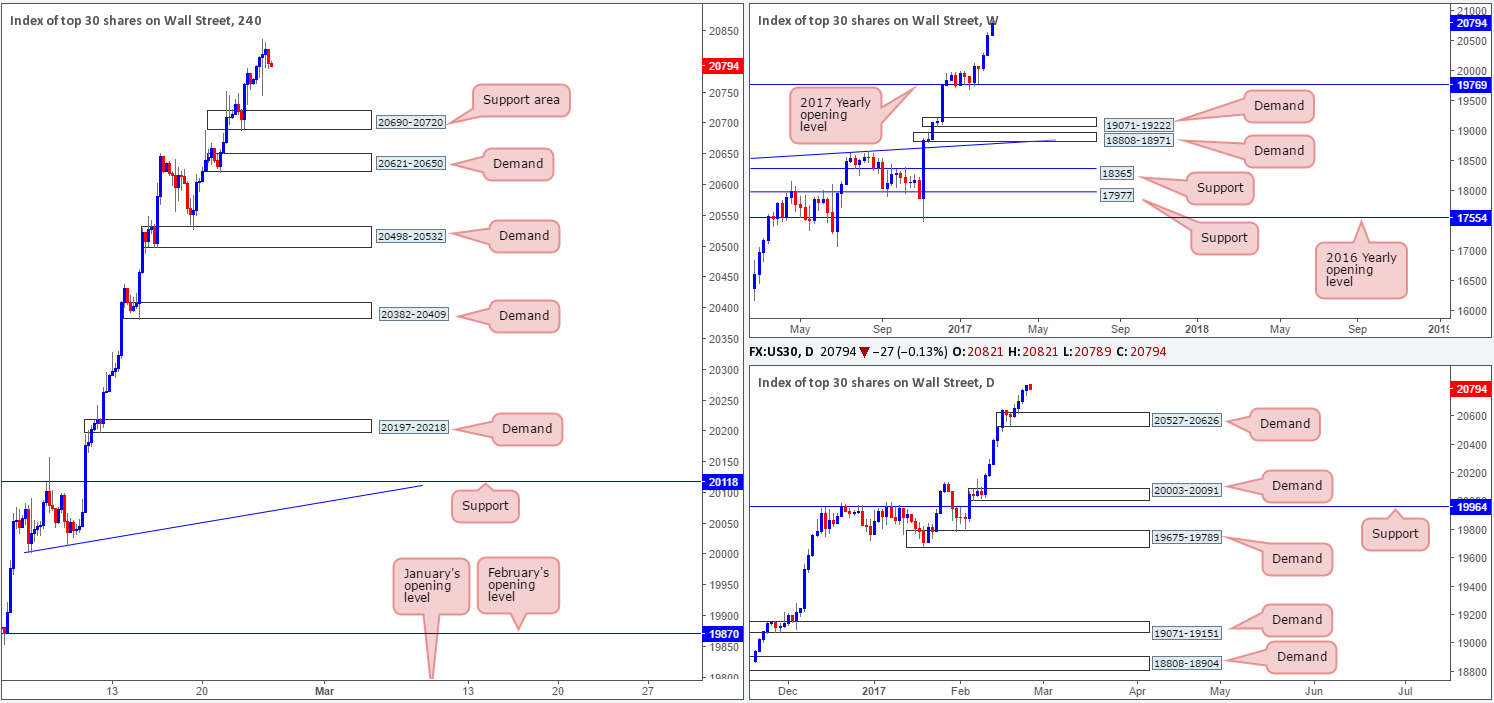
US equities closed higher for a fourth consecutive day yesterday, tapping a fresh record high of 20838. With absolutely no higher-timeframe resistance levels in sight, the best we feel we can do for the time being is continue looking to ‘buy the dips’. The nearest higher-timeframe area can be seen at 20527-20626: a newly-formed daily demand.
Our suggestions: The next area of support on the H4 chart remains to be seen around a H4 demand base at 20690-20720. While this zone boasts no higher-timeframe (structural) convergence, we feel it is still worthy of attention simply because it was formed in line with the current uptrend. Just to be clear here though, placing pending orders at this zone is not advised, since there’s little stopping price from ignoring this area and heading to the H4 demand zone below at 20621-20650, which happens to be positioned around the top edge of the current daily demand base. Waiting for additional confirmation such as a lower-timeframe buy signal (see the top of this report) or a reasonably sixed H4 bull candle would, at least in our opinion, be the safer, more logical, path to take.
Data points to consider: US housing data at 3pm GMT.
Levels to watch/live orders:
- Buys: 20690-20720 ([waiting for additional confirmation is advised before looking to execute a trade] stop loss: dependent on how one chooses to confirm the zone).
- Sells: Flat (stop loss: N/A).
GOLD:
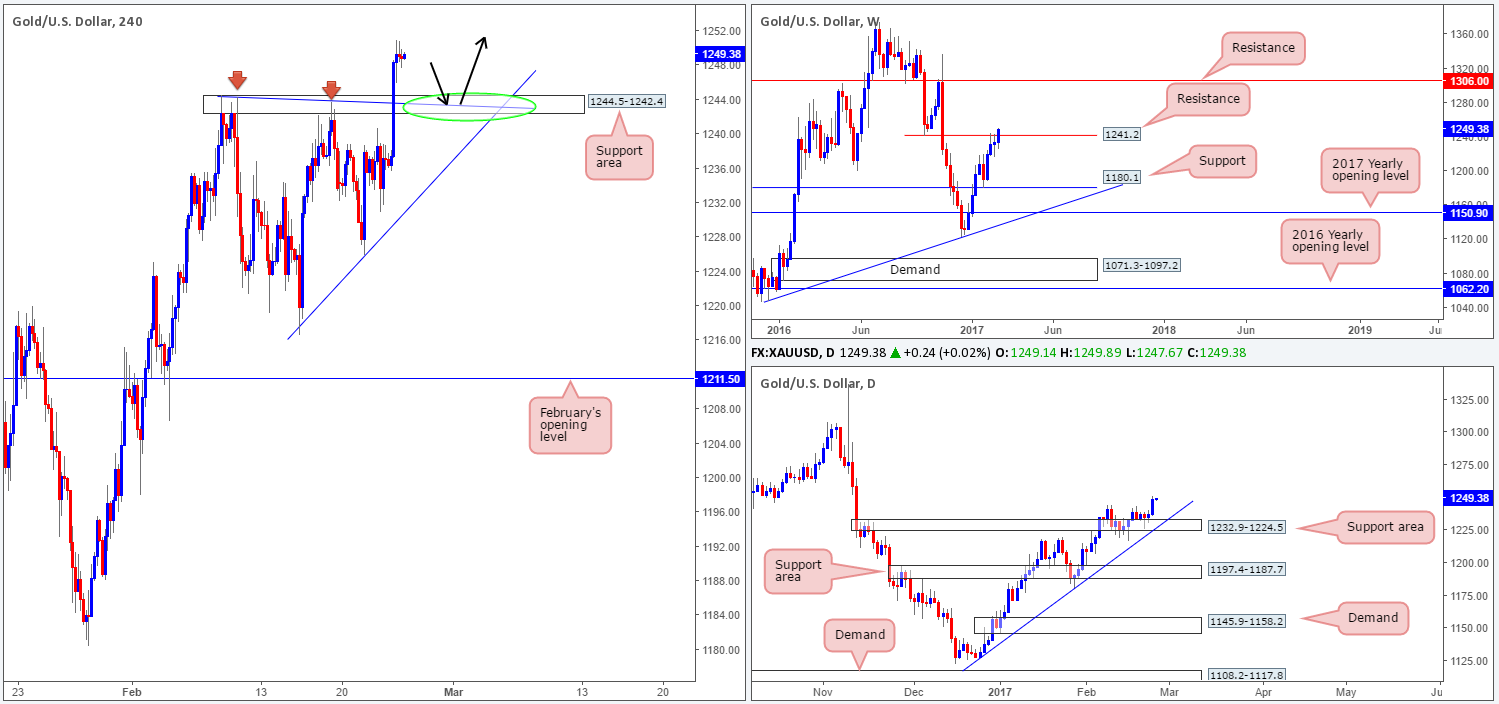
Recent dollar losses helped nudge the gold market higher yesterday, breaking through a H4 resistance area coming in at 1244.5-1242.4. With this move also placing the current weekly candle above weekly resistance at 1241.2, further upside in this market is now a real possibility. The next upside objective on the weekly scale can be seen at 1306.0: a weekly resistance level.
Before our team can become buyers, however, we would prefer to see a weekly CLOSE take shape beyond the current weekly resistance line. Should this come to fruition, we would be very interested in buying from 1244.5-1242.4 on the H4 chart, which effectively should now act as a support area.
Our suggestions: While daily action is bolstered by a daily support area at 1232.9-1224.5, our team, as mentioned above, will not consider a buy from the current H4 support area as valid UNTIL a weekly close is seen above the aforementioned weekly resistance line. As a result, we will remain flat going into today’s segment and look to reassess structure on Monday.
Levels to watch/live orders:
- Buys: Flat (stop loss: N/A).
- Sells: Flat (stop loss: N/A).


