
Key risk events today:
UK Retail Sales m/m; German IFO Business Climate; US Core Durable Goods Orders m/m and Durable Goods Orders m/m.
(Previous analysis as well as outside sources – italics).
EUR/USD:
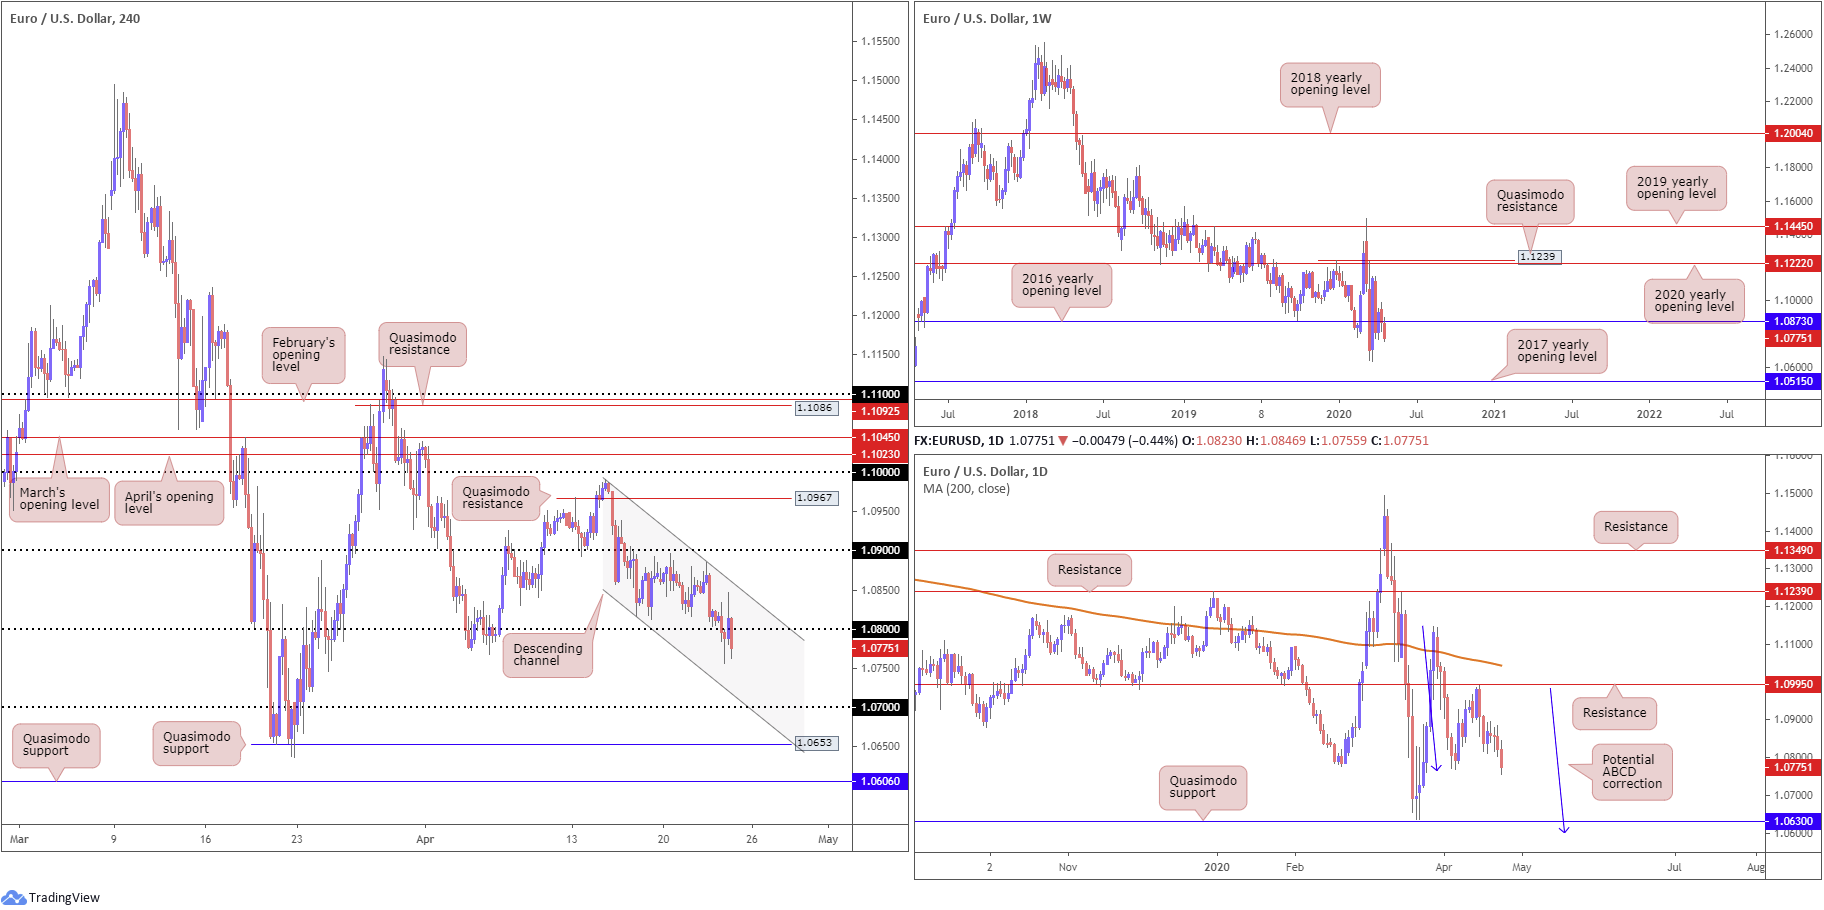
In recent hours, EUR/USD gave up its 1.08 handle, breaching the 1.0768 April 6 low. Sour Eurozone Flash Manufacturing/Services PMIs, along with EU leaders failing to reach an agreement on a COVID-19 recovery package, positioned price action firmly south of 1.08, unlocking the possibility of a run to 1.07, merging closely with channel support, extended from the low 1.0816.
Further afield, action based on the weekly timeframe reveals the pair exploring ground south of its 2016 yearly opening level at 1.0873. To the downside, multi-year lows at 1.0635 are in view, with follow-through moves shining the spotlight on the 2017 yearly opening level at 1.0515.
The story on the daily timeframe shows price action eclipsed the 1.0768 April 6 low, shifting focus to Quasimodo support at 1.0630, closely tracked by a potential ABCD correction (blue arrows) at 1.0597.
Areas of consideration:
The air appears reasonably thin beneath 1.08 right now, positioning sellers in a strong position as we head into Friday. Higher-timeframe action also supports additional selling with support unlikely to emerge until reaching the daily Quasimodo support mentioned above at 1.0630.
As a result of the above analysis, bearish scenarios beneath 1.08 are a possibility going forward, with conservative traders likely eyeing a retest setup around the underside of the said round number before committing.
GBP/USD:
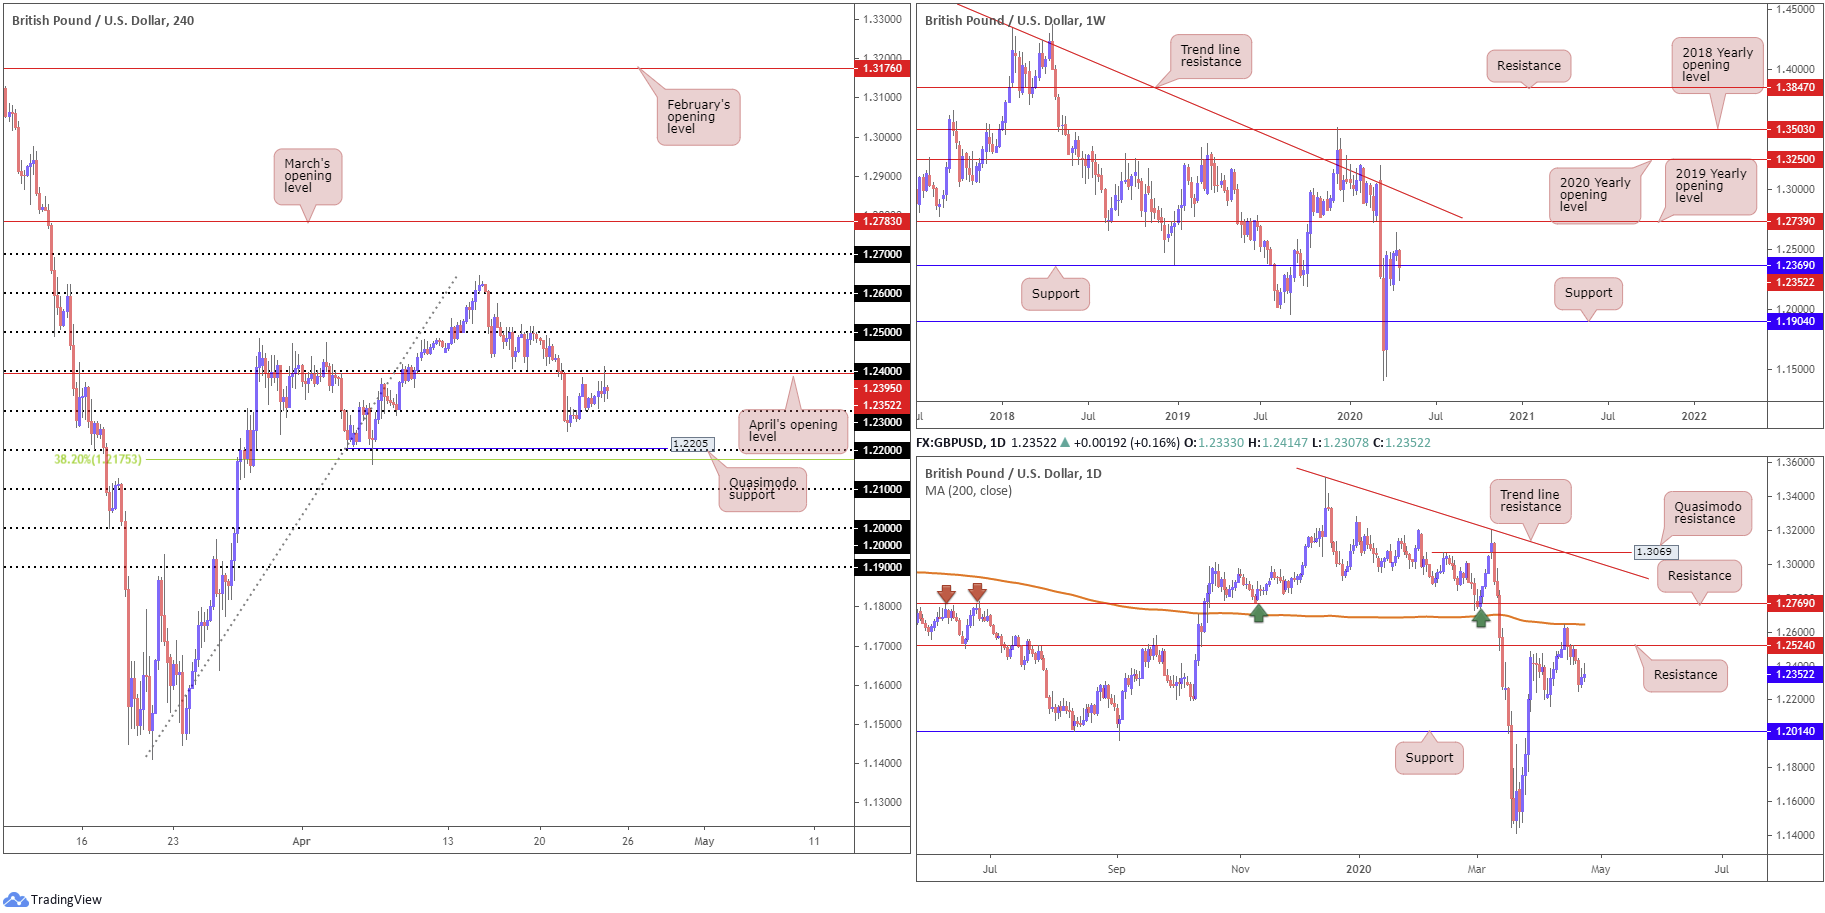
In the face of dismal UK PMI surveys and a moderately bullish greenback, GBP/USD performed remarkably well Thursday. 1.24 and April’s opening level at 1.2395 welcomed price action during US trade, though price failed to sustain gains north of 1.2414. Candlestick analysis reveals price subsequently chalked up a strong selling wick, possibly setting the path for moves to 1.23. A break of 1.23 to the downside will immediately light up Tuesday’s low at 1.2247 and quite possibly Quasimodo support at 1.2205, fixed a few points north of 1.22 and a 38.2% Fibonacci retracement ratio at 1.1753.
On more of a broader perspective, weekly price is seen tackling support at 1.2369, despite having dipped a toe to lows of 1.2247. Activity on the daily timeframe witnessed Thursday conclude by way of a shooting star candlestick pattern, which may be enough to drive price action to the 1.2163 April 7 low, followed by support at 1.2014.
Areas of consideration:
Weekly support at 1.2369 seen in play may hinder downside attempts off 1.24, despite the reasonably strong H4 candle wick and shooting star candlestick pattern on the daily timeframe. Traders may consider waiting and seeing if the H4 candles close beneath 1.23 before considering a short sale in this market.
A breakout above 1.24 could be interesting, targeting 1.25. In this case, you’d be trading alongside weekly structure.
AUD/USD:
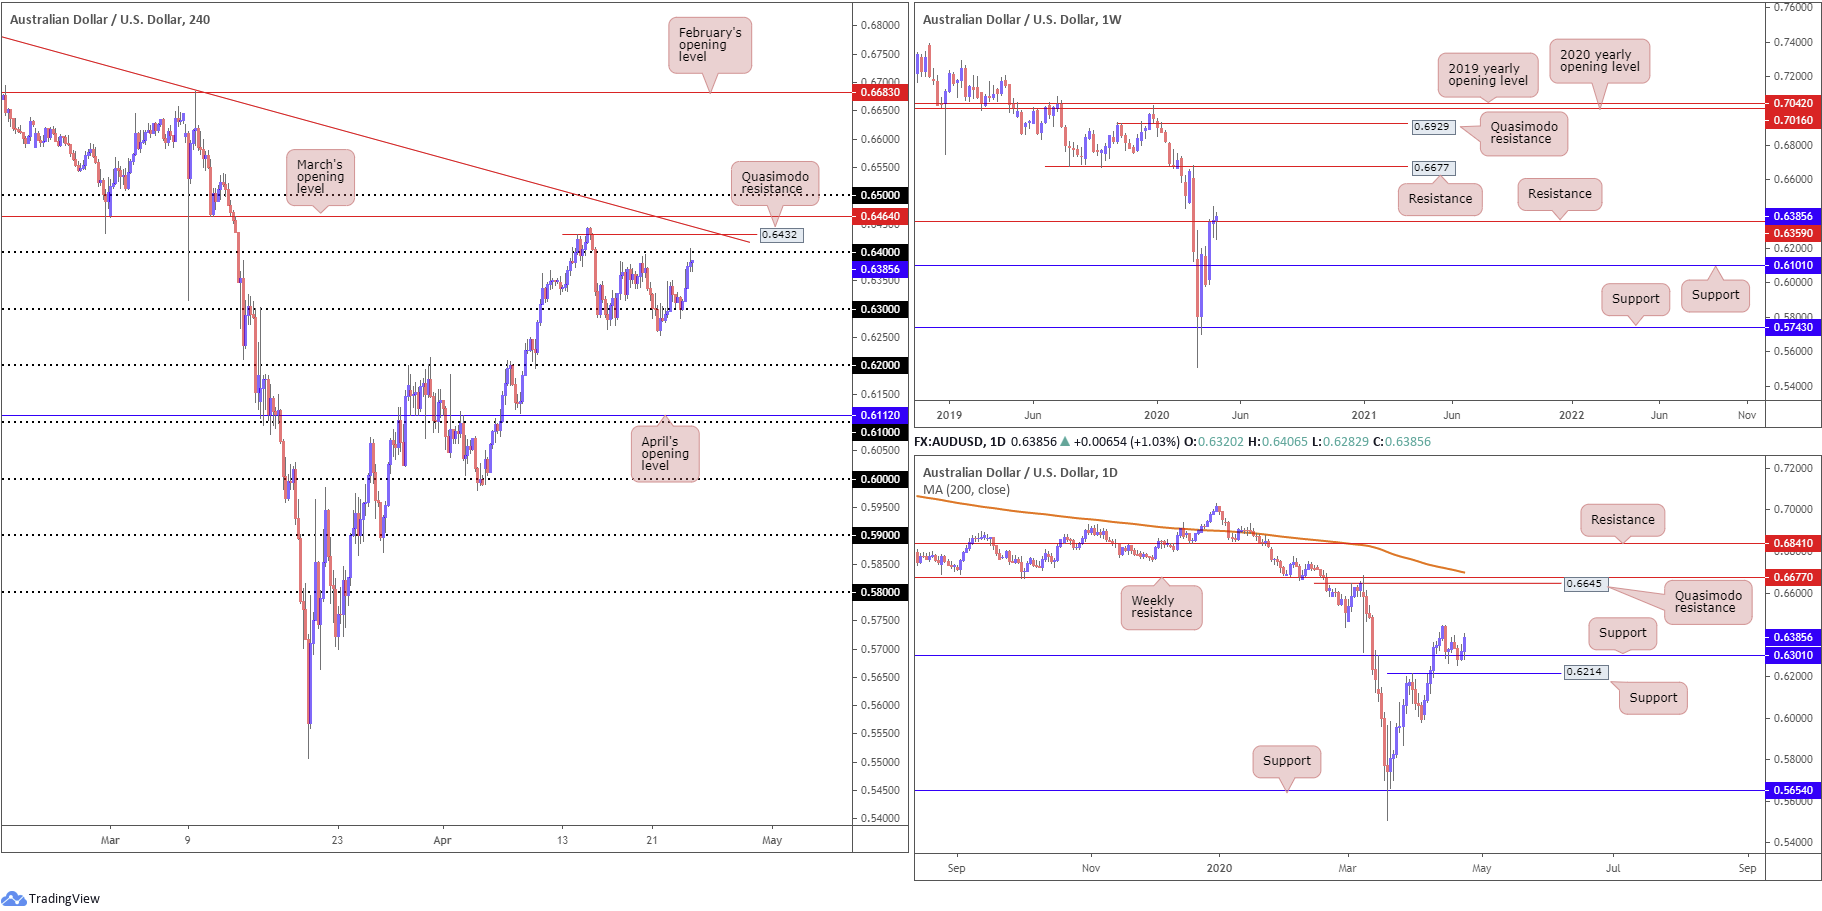
AUD/USD buyers went on the offensive Thursday following an early retest off 0.63, based on the H4 timeframe. As you can see, price action greeted 0.64 at the tail end of the session, producing a mild correction. Buy-stop liquidity above 0.64 is likely appealing to some traders today, with bearish themes off H4 Quasimodo resistance at 0.6432 a possibility. Traders will also note the trend line resistance seen nearby, extended from the high 0.7025.
Price action, based on the weekly timeframe, is seen attempting to regain a foothold above resistance at 0.6359, threatening the possibility of further recovery to 0.6677. The daily timeframe has the unit engaging with support at 0.6301, with price printing its second consecutive daily gain yesterday, highlighting a possible move to last Tuesday’s high at 0.6444.
Areas of consideration:
Keeping things simple today, a fakeout above 0.64 is likely on the cards, one which trips the majority of buys stops above the round number and tests H4 Quasimodo resistance at 0.6432/H4 trend line resistance. The combination of the said resistances, on top of buy-stop liquidity north of 0.64, could fuel sellers. Traders may use March’s opening level at 0.6464 as a base to position protective stop-loss orders, with some even perhaps favouring 0.65.
USD/JPY:
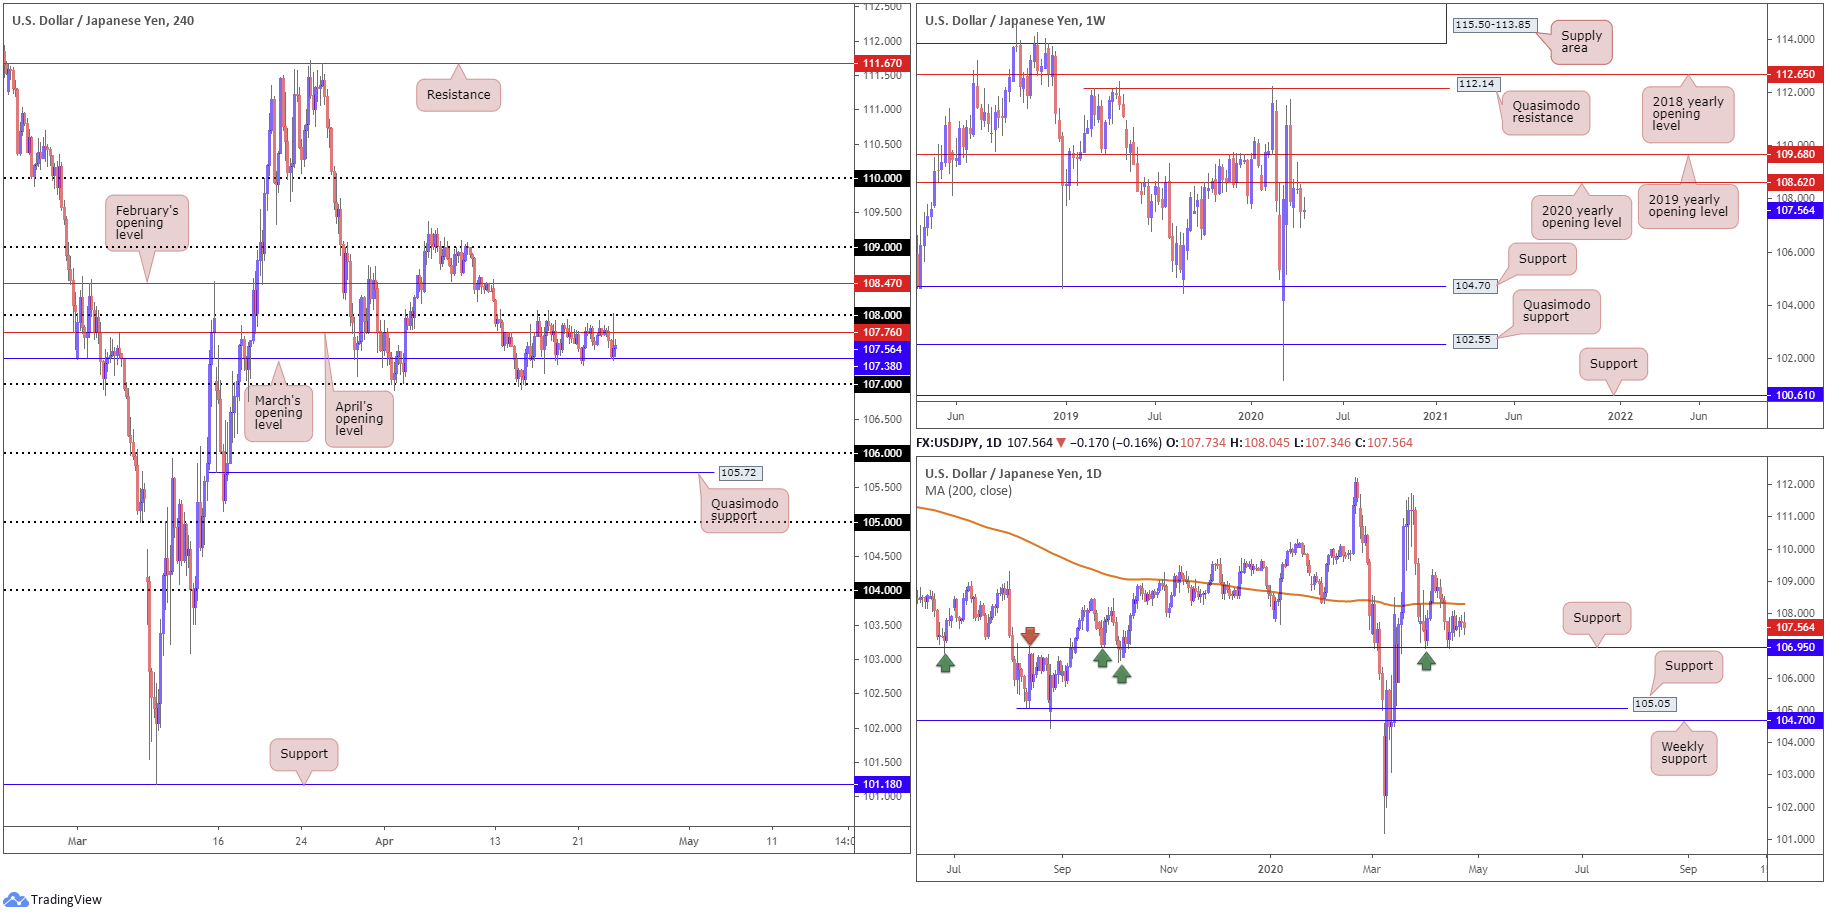
Thursday observed H4 price remain within the walls of its consolidation between the 108 handle and March’s opening level at 107.38 (note in between this range we also have April’s opening level at 107.76 present). 107 is seen as viable support outside of the consolidation, along with February’s opening level at 108.47 as resistance.
The vibe on the weekly timeframe continues to represent a bearish tone. Price action recently produced a clear-cut shooting star candlestick configuration off the 2020 yearly opening level at 108.62, with last week putting in a strong follow-through move to the downside to lows of 106.92. The next support target is not seen until 104.70. Note this figure also represents the lower boundary of a multi-month range between Quasimodo resistance at 112.14. So far this week, we’ve seen little development with the pair trading a touch off last week’s lows.
Support at 106.95 continues to have a presence on the daily timeframe. The 200-day SMA (orange – 108.30) stands as possible resistance, whereas a break through 106.95 could land the 105.05 support in the mix, followed by weekly support highlighted above at 104.70.
Areas of consideration:
The H4 range may be of interest to lower-timeframe traders; fading the extremes are an option. Waiting for additional candlestick confirmation to form before pulling the trigger, however, is an idea, since whipsaws may take shape.
Traders may also wish to acknowledge 107 aligns closely with daily support at 106.95, while February’s opening level at 108.47 comes in closely with the 200-day SMA at 108.30.
Weekly price suggesting lower levels certainly places a question mark on further gains above 108, though if we’re able to reach 108.47, active sellers are likely to enter the fray. The combination of daily support at 106.95 and 107 could also spark a reaction if tested.
USD/CAD:
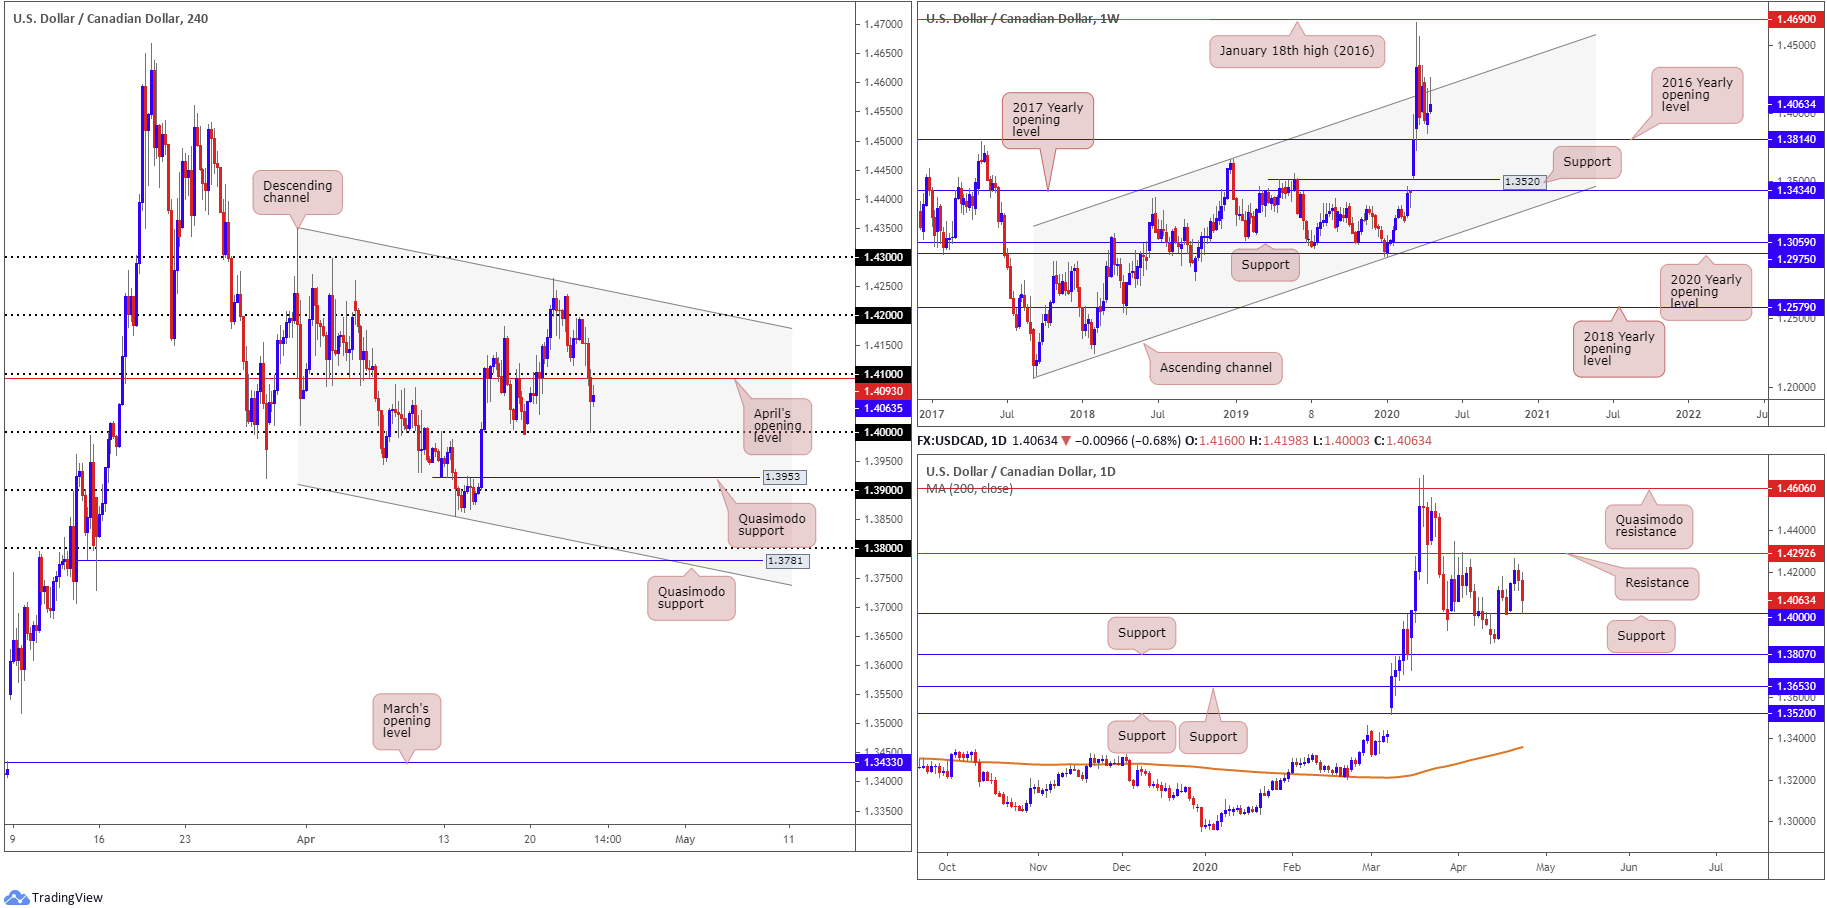
Kicking off with a look at the weekly timeframe, we can see price action fading a long-term channel resistance, extended from the high 1.3661, currently shaped by way of a shooting star candlestick pattern. This could see the 2016 yearly opening level at 1.3814 re-enter the frame.
From the daily timeframe, price action chalked up its second consecutive bearish candle yesterday, with price action shaking hands with the 1.4000 support level. Aside from the 1.3855 April 13 low, support exists at 1.3807.
The key figure 1.40 entered play on the H4 timeframe (which also represents daily support – above) and has thus far printed a generous rebound. April’s opening level at 1.4093, along with 1.41, stands as possible resistance on this scale, whereas a breach of 1.40 has Quasimodo support at 1.3953 to target, closely shadowed by 1.39.
Areas of consideration:
Weekly price fading channel resistance may weaken upside attempts above 1.41, therefore 1.41 and April’s opening level at 1.4093 could be a location sellers make an appearance today if we reach this far north. A H4 bearish candlestick pattern formed off 1.41, therefore, will likely see sellers enter the market and target 1.40.
Breaking 1.40 may also be interpreted as a bearish signal, with scope to approach Quasimodo support at 1.3953 as an initial target.
USD/CHF:
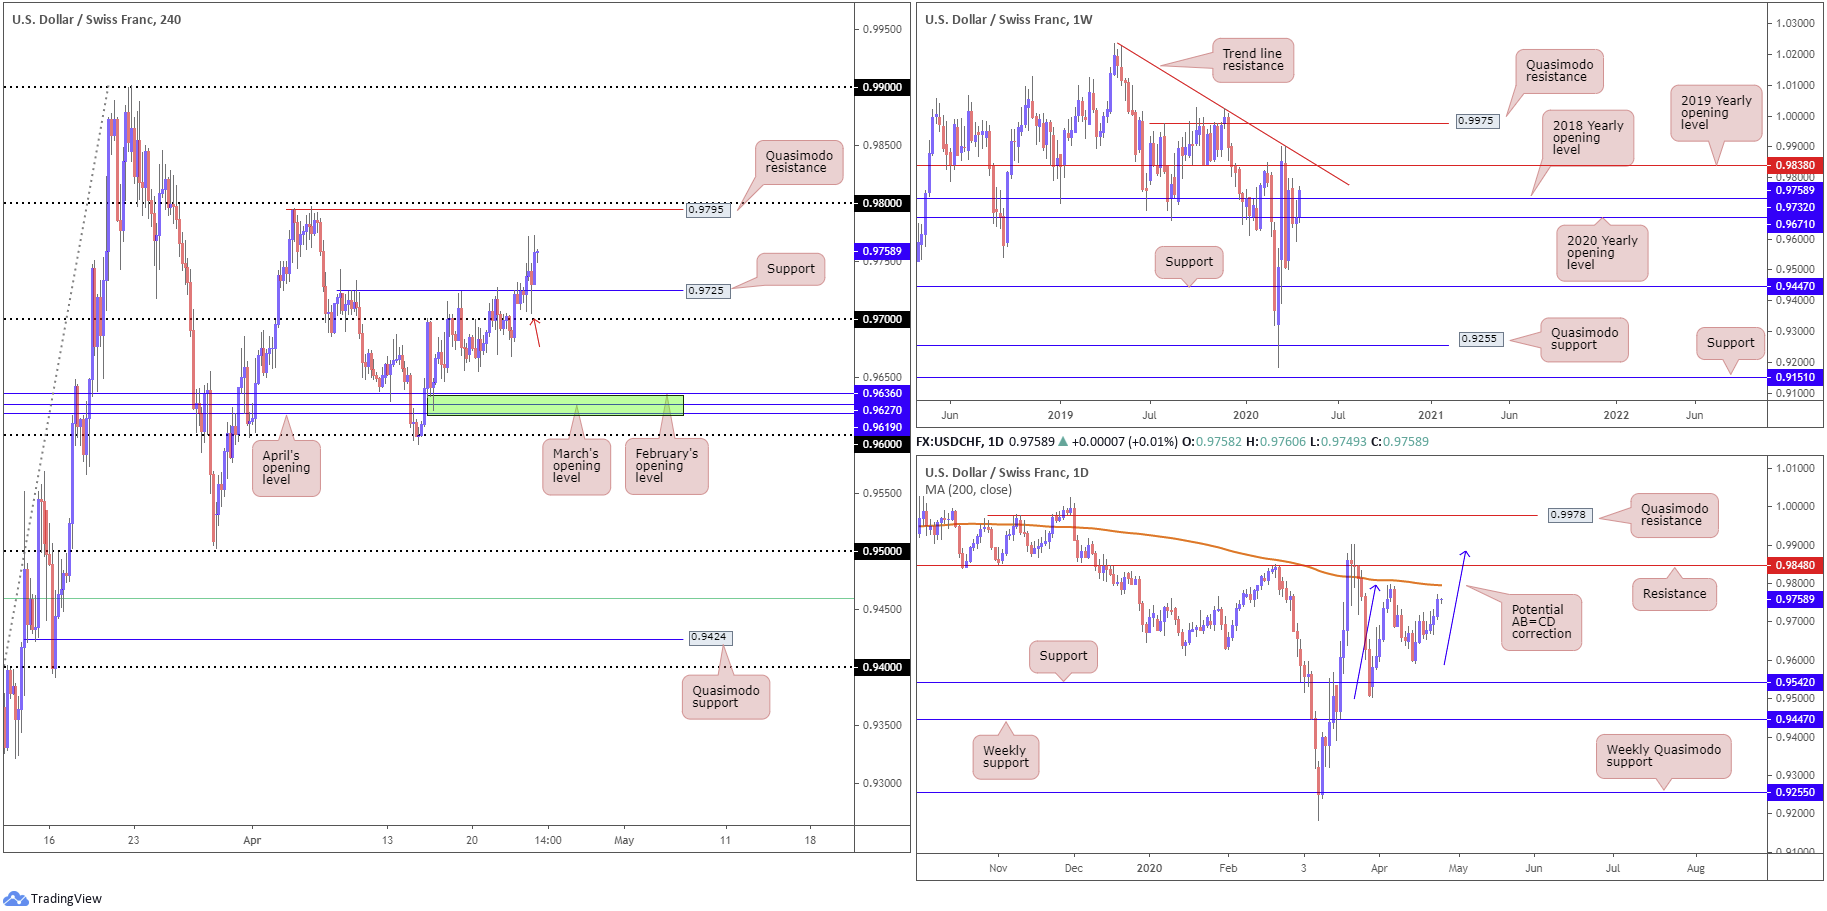
Clearing Quasimodo resistance on the H4 timeframe at 0.9725 Thursday (now a serving support) has potentially paved the path north for 0.98 to make its way back into the picture, reinforced by a Quasimodo resistance at 0.9795. A number of traders likely entered long on yesterday’s retest at0.9725, formed by way of a hammer candlestick pattern (red arrow).
Weekly price, so far this week, has put in solid ground above the 2020 yearly opening level at 0.9671 and, in recent movement, glided through the 2018 yearly opening level at 0.9732. This highlights the 2019 yearly opening level at 0.9838 and trend line resistance, taken from the high 1.0226.
To the upside on the daily timeframe, resistance is unlikely to emerge until reaching the 200-day SMA (orange – 0.9795), accompanied by 0.9848 and a potential AB=CD correction (blue arrows) at 0.9886. Lower on the curve we have support priced in at 0.9542, situated just ahead of weekly support at 0.9447.
Areas of consideration:
All three timeframes point to further upside today/possibly early next week. However, entering at current price on the H4 scale has little appeal, in that risk/reward to 0.98 is poor. Should a pullback to 0.9725 develop today, on the other hand, and print another H4 bullish candlestick pattern, this positions the trader in more of a favourable position with respect to risk/reward.
Dow Jones Industrial Average:
Major US equity indexes finished mostly lower Thursday following reports of a leading experimental coronavirus drug performing poorly in tests. The Dow Jones Industrial Average added 39.44 points, or 0.17%; the S&P 500 erased 1.51 points, or 0.05%, and the tech-heavy Nasdaq 100 concluded lower by 23.14 points, or 0.27%.
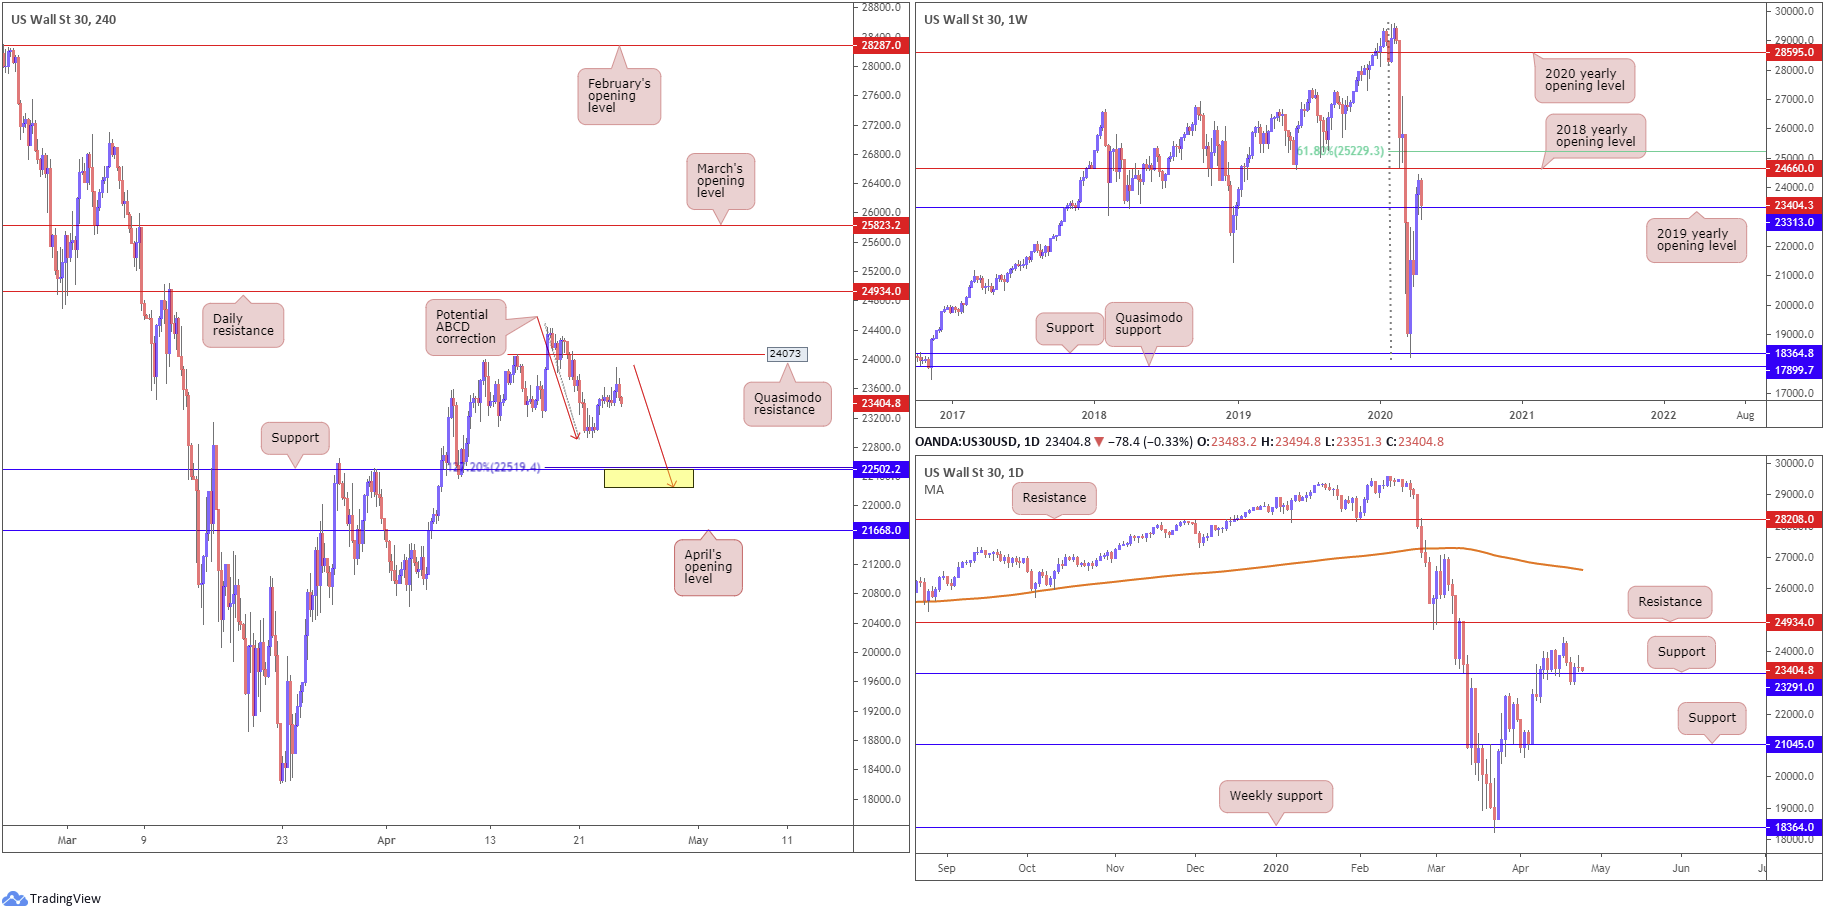
From the weekly timeframe, support by way of the 2019 yearly opening level at 23313 remains in play. While it is far too early to tell if we’ll see anything meaningful to the upside from here, traders are urged to pencil in the 2018 yearly opening level at 24660 as potential resistance. South of 23313, however, research reveals limited support until reaching 18364.
Price action on the daily timeframe continues to trade above support at 23291, though Thursday’s close echoed a fragile tone. Resistance may emerge off the 24442 April 17 high, with a break exposing resistance priced in at 24934, while tunnelling through the current support could invite an approach to support at 21045.
A closer reading of price action on the H4 timeframe had activity rotate lower Thursday, a few points ahead of Quasimodo resistance at 24073. Should the unit maintain a bearish tone, Tuesday’s low at 22934 could enter the fray, followed by support at 22502, which comes together with a potential 127.2% ABCD (red arrows) approach at 22519 (yellow).
Areas of consideration:
Follow-through selling today could see the H4 ABCD pattern complete at H4 support at 22502, which by and of itself, is a reasonably strong platform in terms of reversal zones. Though do remain aware this area holds limited connection with the higher timeframes.
In the event we pop higher, as the higher timeframes suggest, selling H4 Quasimodo resistance at 24073 is chancy, with the possibility of a move higher materialising. This highlights potential buying opportunities north of 24073.
XAU/USD (GOLD):
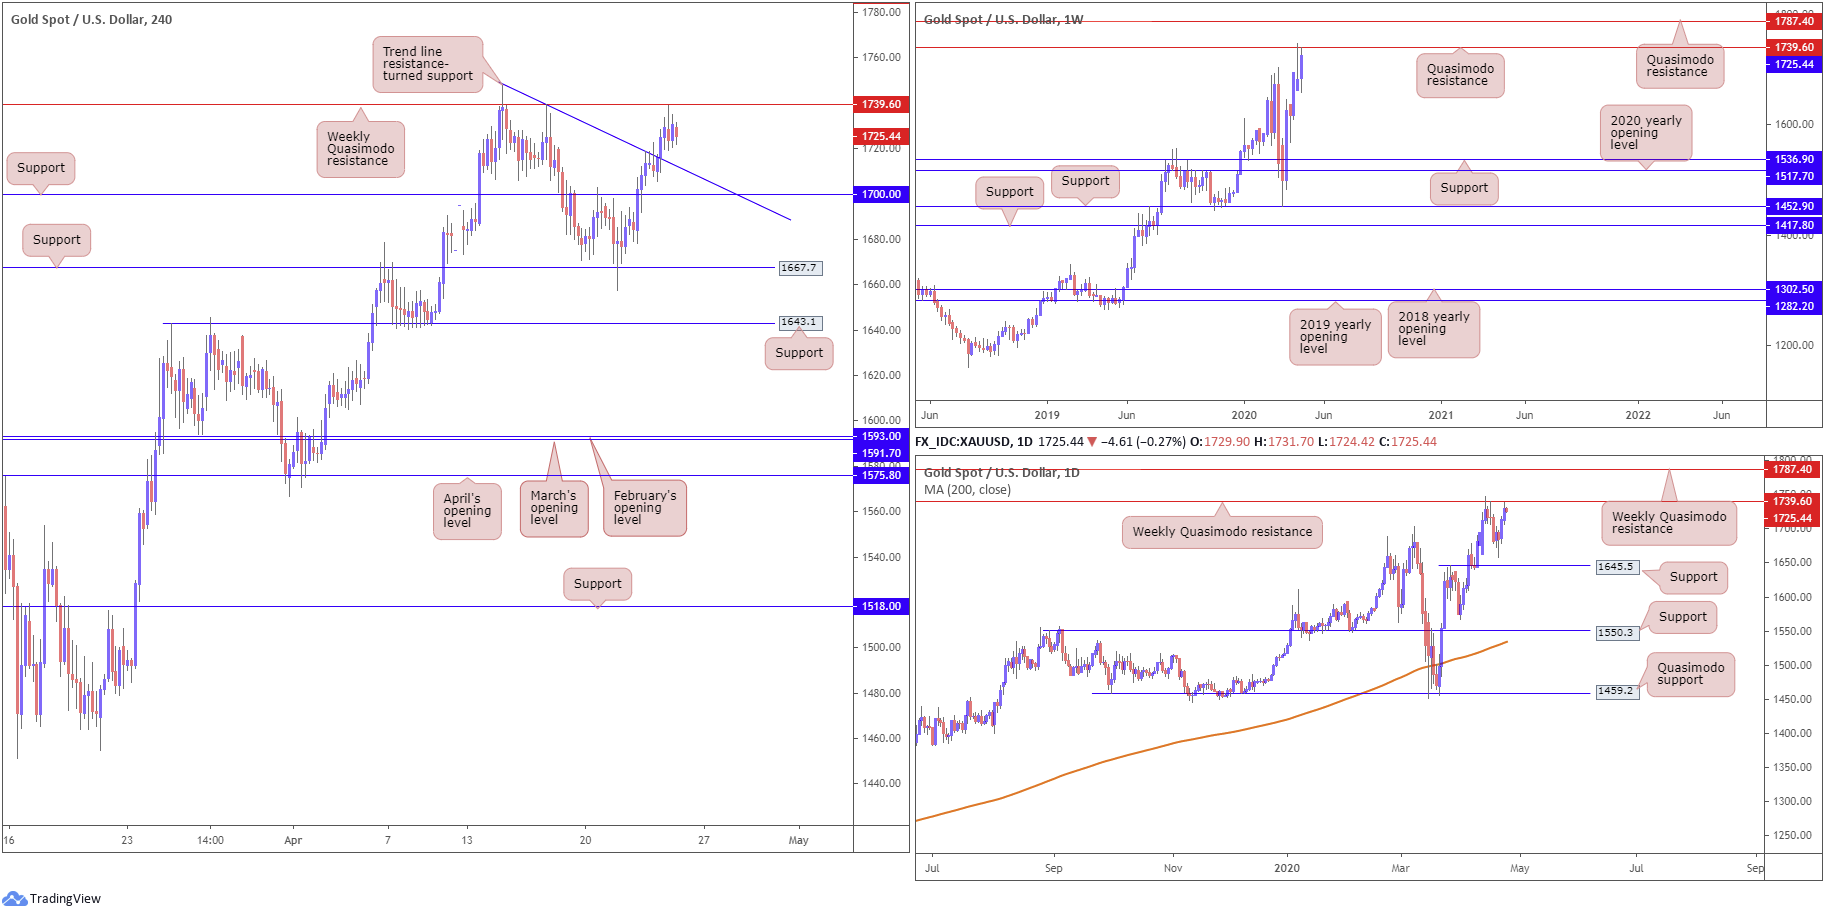
Bullion retained an underlying bid Thursday as disappointing macroeconomic data underpinned the metal’s safe-haven demand. Technically, we crossed above trend line resistance, taken from the high 1747.7, and powered to highs at 1739.1, a touch beneath weekly Quasimodo resistance at 1739.6.
Should price conquer the said weekly Quasimodo, the focus will then likely rest on another layer of Quasimodo resistance, also based on the weekly timeframe, at 1787.4.
Areas of consideration:
A rejection from the current weekly Quasimodo resistance today has H4 trend line resistance-turned support in view as an initial downside target, followed closely by H4 support at 1700.0.
In case of continued upside today, a H4 close above the weekly Quasimodo resistance, may trigger a wave of breakout buying, either entering based on the breakout candle’s close or waiting for a retest setup to develop.
The accuracy, completeness and timeliness of the information contained on this site cannot be guaranteed. IC Markets does not warranty, guarantee or make any representations, or assume any liability regarding financial results based on the use of the information in the site.
News, views, opinions, recommendations and other information obtained from sources outside of www.icmarkets.com.au, used in this site are believed to be reliable, but we cannot guarantee their accuracy or completeness. All such information is subject to change at any time without notice. IC Markets assumes no responsibility for the content of any linked site.
The fact that such links may exist does not indicate approval or endorsement of any material contained on any linked site. IC Markets is not liable for any harm caused by the transmission, through accessing the services or information on this site, of a computer virus, or other computer code or programming device that might be used to access, delete, damage, disable, disrupt or otherwise impede in any manner, the operation of the site or of any user’s software, hardware, data or property.


