
A note on lower timeframe confirming price action…
Waiting for lower timeframe confirmation is our main tool to confirm strength within higher timeframe zones, and has really been the key to our trading success. It takes a little time to understand the subtle nuances, however, as each trade is never the same, but once you master the rhythm so to speak, you will be saved from countless unnecessary losing trades. The following is a list of what we look for:
- A break/retest of supply or demand dependent on which way you’re trading.
- A trendline break/retest.
- Buying/selling tails/wicks – essentially we look for a cluster of very obvious spikes off of lower timeframe support and resistance levels within the higher timeframe zone.
- Candlestick patterns. We tend to only stick with pin bars and engulfing bars as these have proven to be the most effective.
We search for lower timeframe confirmation between the M15 and H1 timeframes, since most of our higher-timeframe areas begin with the H4. Stops are usually placed 5-10 pips beyond confirming structures.
EUR/USD:
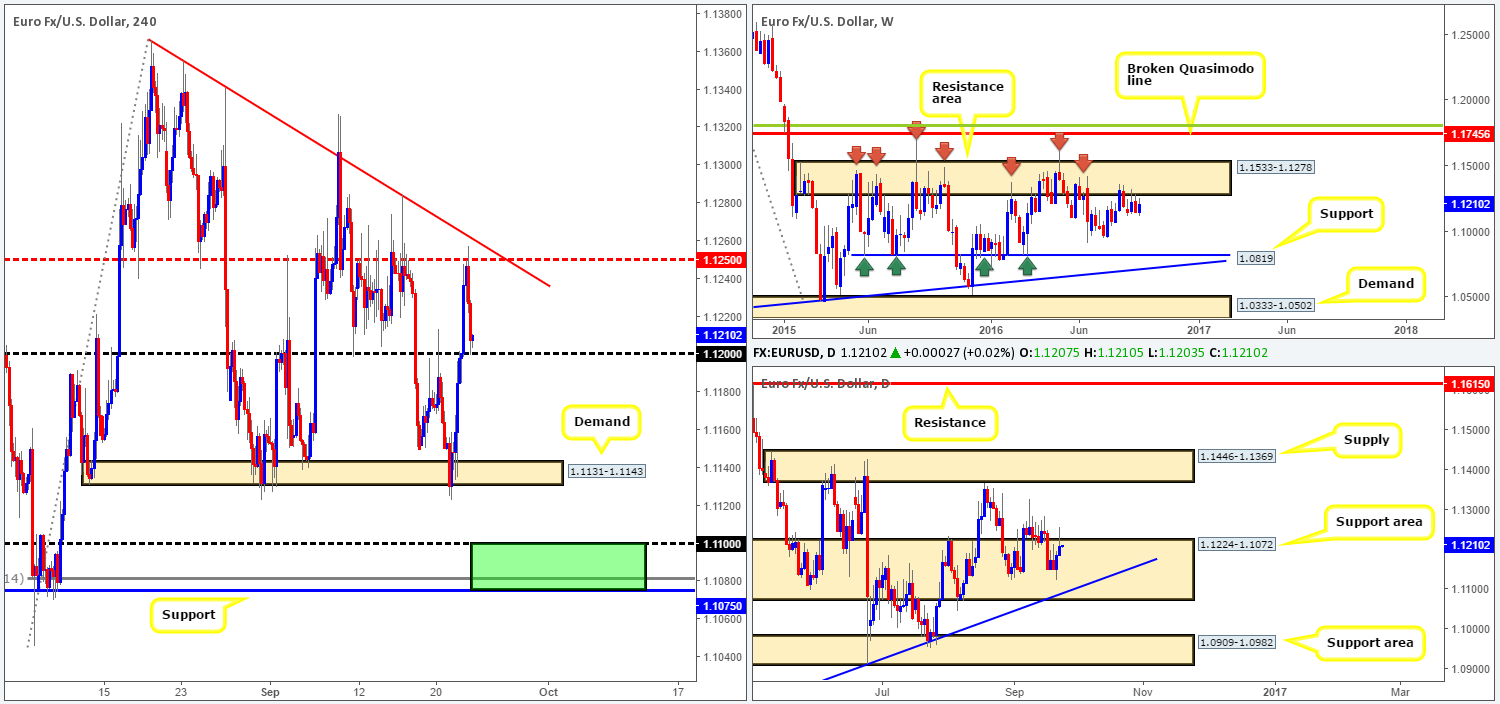
The shared currency was driven higher by an overall weaker dollar yesterday, before finding resistance around the H4 mid-way point 1.1250 going into US trading. On the US dollar index, we can see that the dollar currently shows room for further buying up to the H4 resistance band coming in at 95.60. Meanwhile, yesterday’s rebound from 1.1250 brought the EUR back down to just ahead of the 1.12 handle, where price, as you can see, is currently finding support.
Over on the bigger picture, nevertheless, the weekly candles remain trading around the underside of a major resistance area at 1.1533-1.1278, while daily price is lurking within a support area seen at 1.1224-1.1072. Daily buyers printed a second consecutive bull candle within this zone yesterday, indicating that the bulls may be strengthening, despite being positioned below the above said weekly resistance area.
Our suggestions: In that the US dollar index shows room to continue north today, and the EUR is seen currently lodged around the underside of a rather large weekly resistance area, 1.12 is not somewhere we’d pencil in as a high-probability reversal zone today. With that being the case, should H4 price CLOSE below 1.12 and retest the underside of this number as resistance, followed by a reasonably sized H4 bearish close, we’d likely look to short from here, targeting the H4 demand base seen at 1.1131-1.1143, followed by the H4 support at 1.1075 and the 1.11 band (green zone). Not only is 1.1075/1.11 a good take-profit area for any shorts in this market, it’s also a fantastic barrier to look for longs. It sits within the depths of the aforementioned daily support area, as well as merging with both the daily trendline support taken from the low 1.0516 and a deep H4 88.6% Fib support at 1.1081. Although this H4 buy zone will very likely bounce price, do keep in mind that by entering long from here you’re effectively buying into weekly flow.
Levels to watch/live orders:
- Buys: 1.1075/1.11 [strong-looking buy zone which could, dependent on the time of day and approach, be sufficient enough to condone an entry without waiting for lower timeframe confirmation] (Stop loss: 1.1060).
- Sells: Watch for price to close beyond 1.12 and then look to trade any retest seen thereafter [waiting for a H4 bearish close following the retest is preferred] (Stop loss: beyond the trigger candle).
GBP/USD:
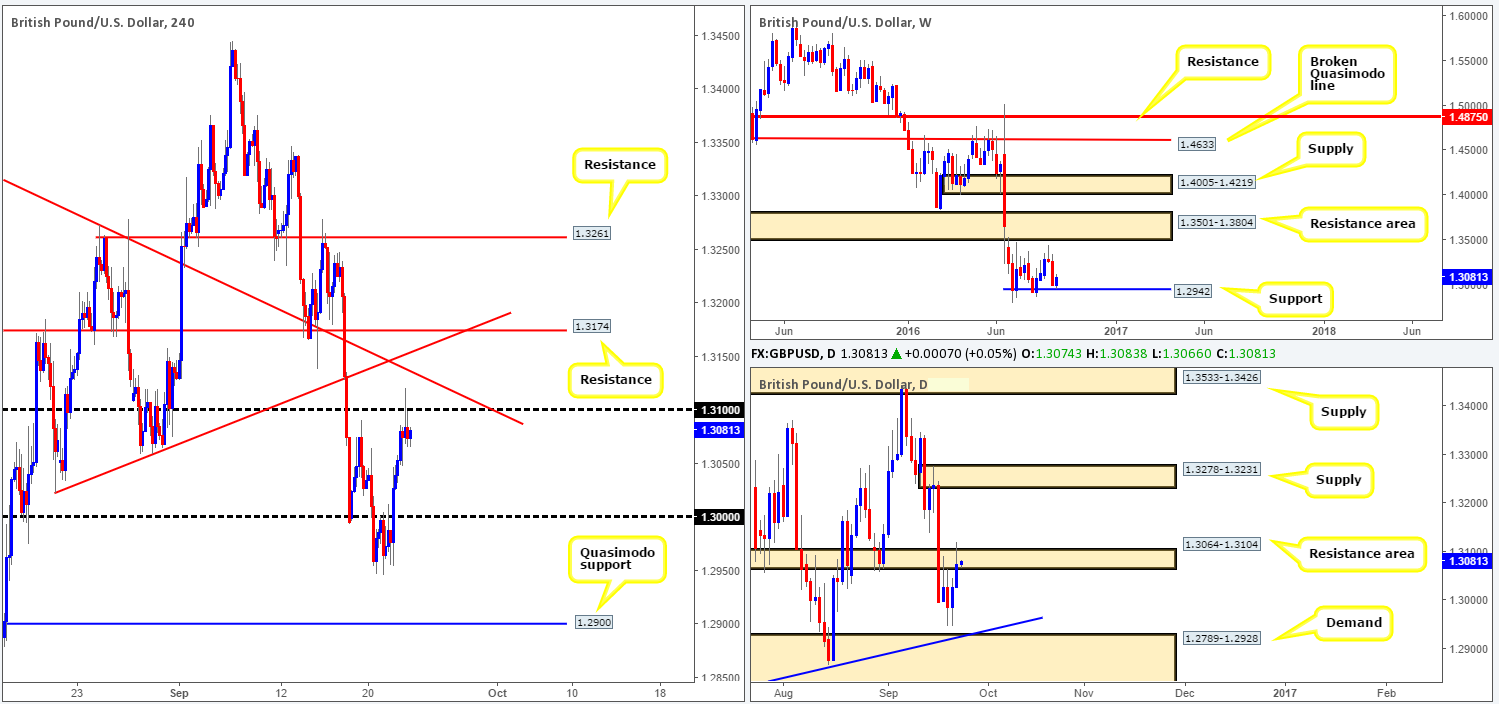
In view of weekly price rebounding from support penciled in at 1.2942, there’s a chance that, despite the trend on this pair favoring further downside, the unit could appreciate back up to the resistance area drawn from 1.3501-1.3804. Meanwhile, lower down the curve on the daily chart, the buyers and sellers are seen battling for position around a resistance area chiseled in at 1.3064-1.3104. Price action would need to breach not only this zone, but also the supply seen overhead at 1.3278-1.3231, before the path looks clear to attack the aforementioned weekly resistance area.
Stepping across to the H4 chart, the 1.31 handle appears well-offered at the moment. And, given that this number is housed within the above said daily resistance area, we could witness further selling from here today, despite weekly price reflecting more of a bullish stance.
Our suggestions: In light of the above notes, we are of the opinion that although prices could selloff from 1.31, we would feel uncomfortable selling here, knowing that weekly price has shown interest around support (see above). Unfortunately for us, however, even if prices do turn north and close above 1.31 today there are a minefield of H4 resistances to plow through (two trendline resistances [1.3371/1.3022] and 1.3174), therefore, not ideal buying conditions.
In the absence of clearer price action, we have decided to remain flat during today’s trade.
Levels to watch/live orders:
- Buys: Flat (Stop loss: N/A).
- Sells: Flat (Stop loss: N/A).
AUD/USD:
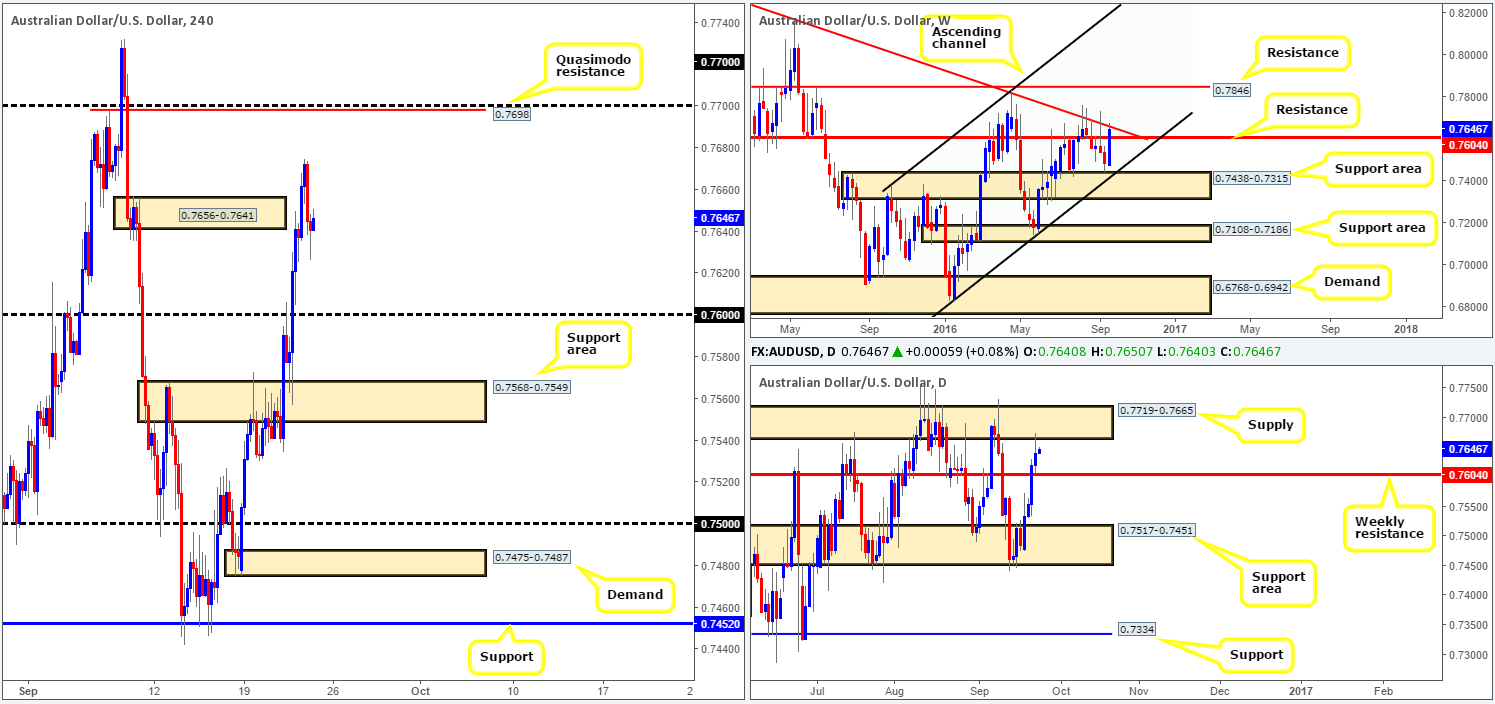
Kicking this morning’s analysis off with a look at the weekly chart, price has breached a resistance level drawn from 0.7604 and is now touching gloves with a trendline resistance taken from the high 0.8295. We saw a similar scenario present itself back in August where price breached resistance here, only to close back below this band following a reaction from the aforementioned trendline resistance. Therefore, is there a chance that we will see history repeat itself here? Turning our attention to the daily chart, supply at 0.7719-0.7665 was recently brought into play. Between this area and the above noted weekly resistance level is where we believe a decision now needs to be made.
Looking across to the H4 chart, yesterday’s action took out supply at 0.7656-0.7641 with relative ease, reaching highs of 0.7674, before collapsing to lows of 0.7626 on the day. To our way of seeing things, there is little resistance seen here until price connects with 0.7698: a Quasimodo resistance level, and little support seen until we reach the 0.76 band.
Our suggestions: Taking all of the above notes on board, our team has only shown interest in the above said H4 Quasimodo resistance level this morning. This barrier, along with its converging higher-timeframe structures is, in our opinion, worthy of a pending sell order, with stops placed above the apex of this formation at 0.7735.
Levels to watch/live orders:
- Buys: Flat (Stop loss: N/A).
- Sells: 0.7697 [pending order] (Stop loss: 0.7735).
USD/JPY:
So, for those who read our previous report on the USD/JPY pair you may recall that we highlighted the 100.00/100.21 range (green zone) as a possible buy zone. Given that it merged beautifully with a H4 88.6% Fib support at 100.07, a H4 AB=CD completion point at 100.21 and was positioned around the top edge of a daily demand base seen at 99.53-100.23, it should not come as too much of a surprise to see price rotated from this area. Well done to any of our readers who managed to lock down a position from here, as price is now seen treading water around a H4 resistance level at 100.82: a very suitable first take-profit range.
For those who missed our call yesterday, you may be given a second chance to join this move today should we see a decisive close above the aforementioned H4 resistance. A retest to the top edge of this boundary followed by a H4 bullish close, would, at least in our book, be enough to permit a long entry, targeting the H4 resistance area at 101.41-101.62, followed by the 102 boundary.

Levels to watch/live orders:
- Buys: Watch for price to close beyond the H4 resistance level at 100.82 and then look to trade any retest seen thereafter [waiting for a H4 bullish close to form following the retest is preferred] (Stop loss: beyond the trigger candle).
- Sells: Flat (Stop loss: N/A).
USD/CAD:
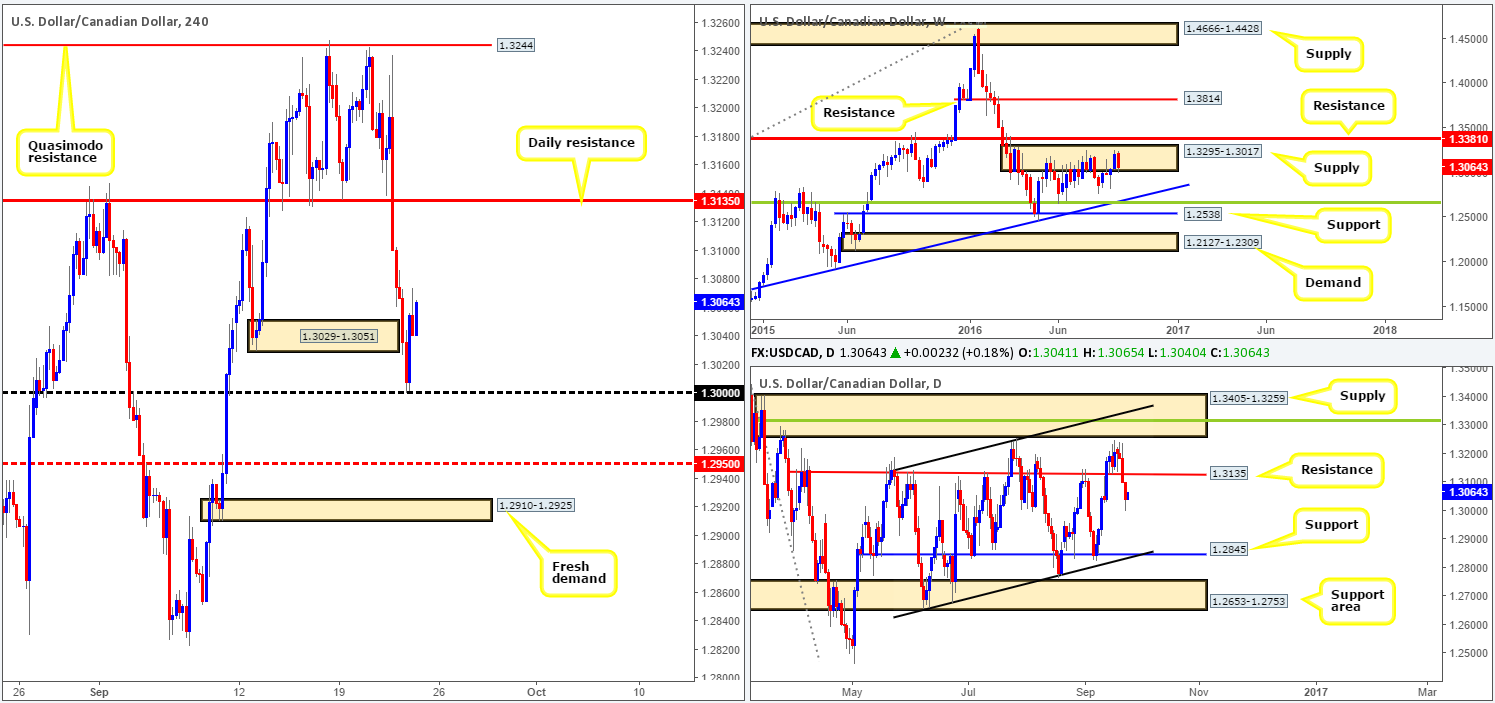
During the course of yesterday’s sessions H4 price aggressively broke through demand seen at 1.3029-1.3051, consequently tagging in bids seen around the key figure 1.30 and reaching a high of 1.3074 by the day’s end. From this angle, there seems to be little standing in the way of prices reaching daily resistance coming in at 1.3135. Here’s the kicker though. Over on the weekly chart, the pair is seen pushing lower from within a supply zone carved in at 1.3295-1.3017. Furthermore, down on the daily chart, there’s room seen for this unit to drop all the way down to support penciled in at 1.2845 (merges with a channel support extended from the low 1.2654).
Our suggestions: Although H4 action shows room for further buying today, we personally would not feel comfortable entering long from here given where price is currently positioned in the bigger picture (see above). To become sellers in this market, nonetheless, a decisive close below/retest of 1.30 would need to be seen, targeting the H4 mid-way support 1.2950, followed closely by another H4 fresh demand sitting at 1.2910-1.2925.
Levels to watch/live orders
- Buys: Flat (Stop loss: N/A).
- Sells: Watch for price to close beyond 1.30 and then look to trade any retest seen thereafter [waiting for a H4 bearish close following the retest is preferred] (Stop loss: beyond the trigger candle).
USD/CHF:
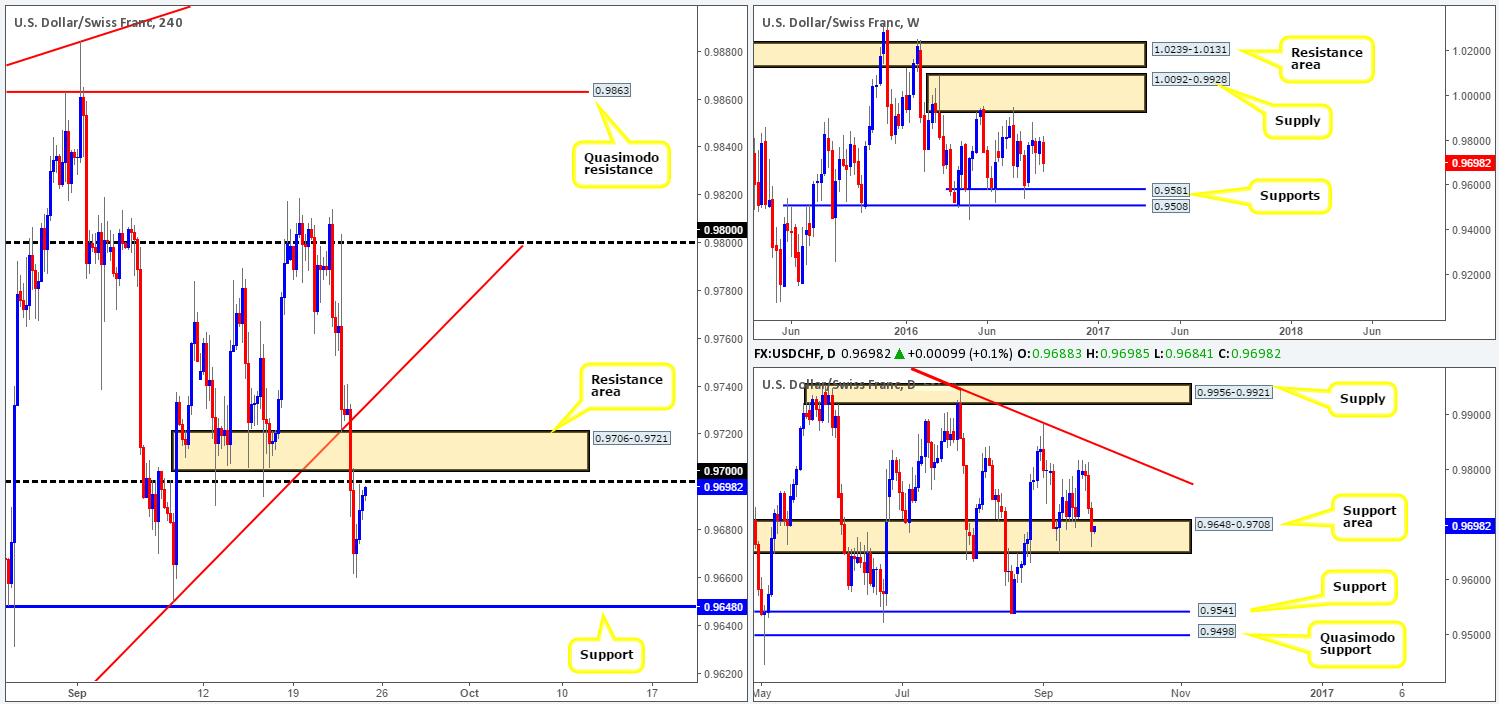
The USD/CHF pair extended losses for a third consecutive day yesterday, breaking through both a H4 support base at 0.9706-0.9721 and the psychological handle 0.97. From here, price managed to reach lows of 0.9659, before reversing back up to just ahead of 0.97 by the close. Now, as you’ll see by looking over at the daily chart, the unit is currently crossing swords with a support area chalked up at 0.9648-0.9708, which is, at least in our view, the technical catalyst for yesterday’s end-of-day correction. Traders may have also noticed that this area, according to the daily chart, is the only zone now stopping prices from reaching the lower edge of the current weekly range at 0.9581: a support level.
Our suggestions: Looking to buy in line with daily flow is probably not the best path to take, due to H4 action lurking just ahead of 0.97 and a nearby H4 resistance area at 0.9706-0.9721. And, of course, selling from this region is also not something we’d recommend unless you fancy going to war with daily buyers!
As you can see, there is not much in the way of a tradable setup on the Swissy at present. As such, we have decided to place this pair on the back burner and we’ll look to reassess structure going into next week.
Levels to watch/live orders:
- Buys: Flat (Stop loss: N/A).
- Sells: Flat (Stop loss: N/A).
DOW 30:
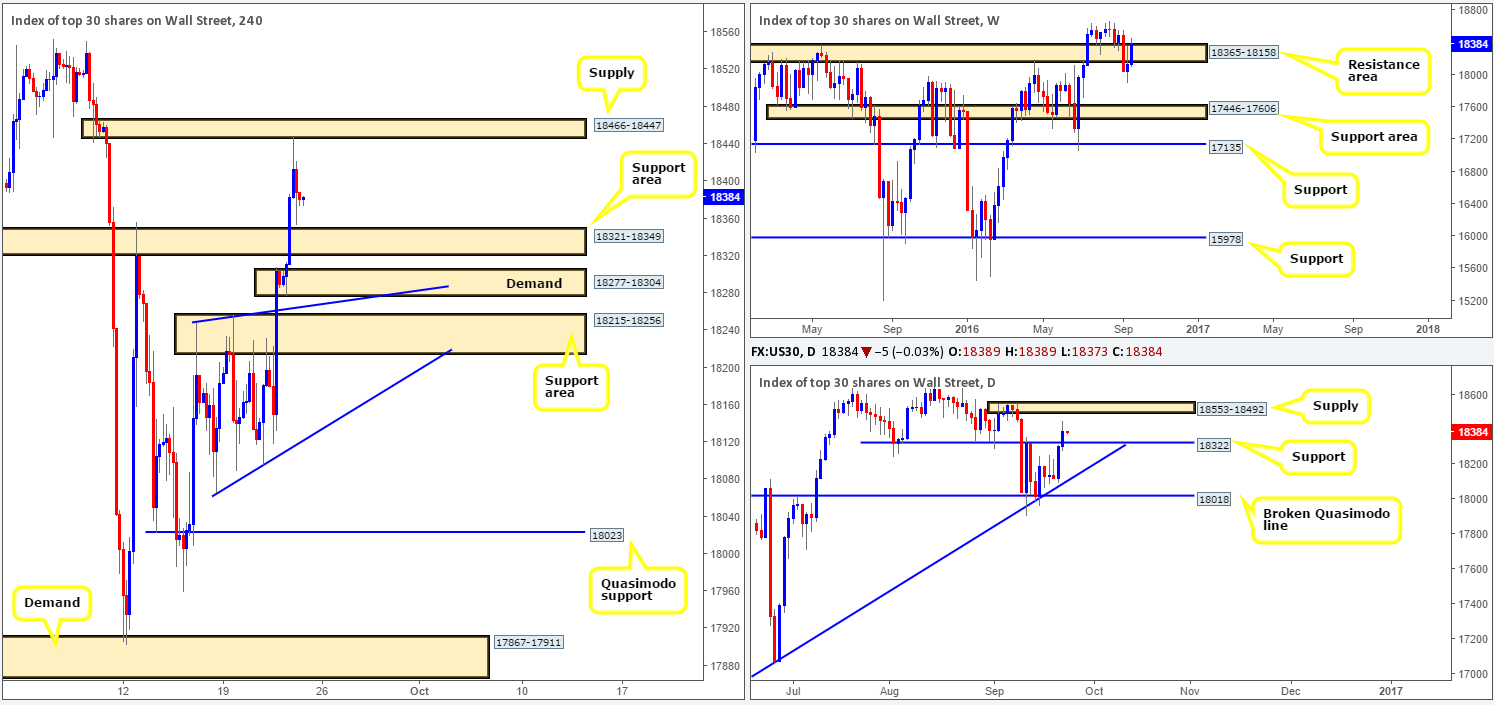
In recent trading, we have seen the US equity market advance for a second consecutive session, forcing price action to attack the underside of a H4 supply zone coming in at 18466-18447. This recent bullish onslaught wiped out daily resistance at 18322, and now, according to the daily timeframe, looks set to extend further north up to supply seen at 18553-18492. In addition to this, we can also see that prices were pushed to the top edge of a weekly resistance area at 18365-18158.
As you can see, it’s a rather challenging market to read at the moment with no clear bias seen. On the one hand, H4 longs appear possible from either: 18215-18256/ 18277-18304/ 18321-18349 (this area contains the recently broken daily resistance – now acting support). And, on the other hand, shorts from the current H4 supply zone seem viable given that its association with the top edge of the aforementioned weekly resistance area.
Our suggestions: Should traders find interest in our above findings, you’ll have to determine which setup best suits your trading plan. We, personally, do not really have a preference here and will very likely remain flat into the week’s end.
Levels to watch/live orders:
- Buys: Flat (Stop loss: N/A).
- Sells: Flat (Stop loss: N/A).
GOLD:
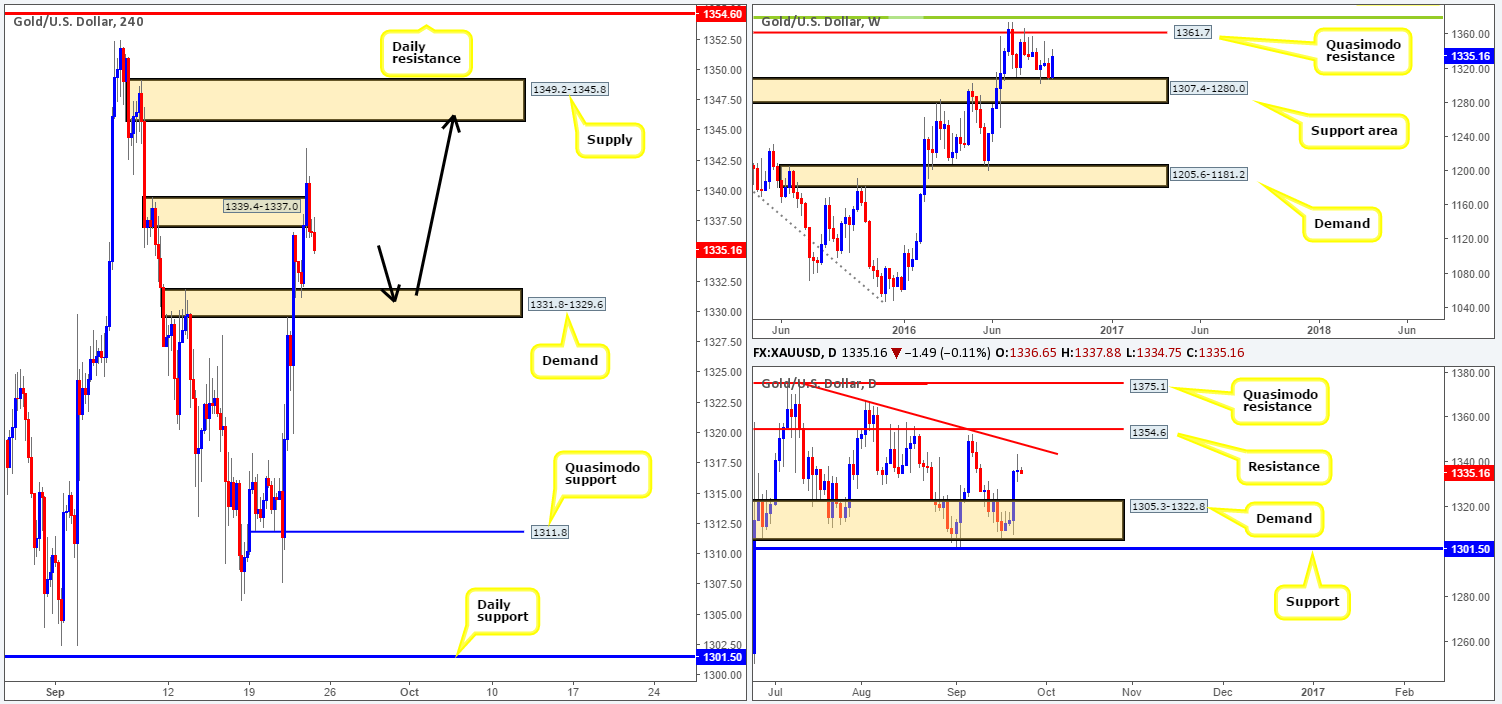
Going into yesterday’s London session, we saw the gold market beautifully retest the top edge of a H4 demand base seen at 1331.8-1329.6. This, as you can see, forced price to aggressively break through H4 supply at 1339.4-1337.0. Unfortunately, the buyers failed to sustain gains beyond this zone, and quickly slipped back below the supply, forming a two-candle whipsaw pattern into the close (seen as a bearish pin bar on the H8 chart).
With weekly bulls still seen on a relatively solid footing above the support area coming in at 1307.4-1280.0, and daily action showing room to continue north up to the trendline resistance extended from the high 1375.0, we still remain firmly within the buyer’s camp in this market.
Our suggestions: Since we know that both the weekly and daily charts show promise to the upside, and stops are more than likely taken out from the above said H4 supply zone, we feel longs from the H4 demand at 1331.8-1329.6 could be something to consider. We would, however, recommend waiting for at least a H4 bullish candle close to form prior to pulling the trigger, since a fakeout through this zone is possible. In regard to targets, we really only have one in mind here and that is the H4 supply zone drawn from 1349.2-1345.8, as it unties beautifully with the aforementioned daily trendline resistance.
Levels to watch/live orders:
- Buys: 1331.8-1329.6 [H4 bullish close required] (Stop loss: beyond the trigger candle).
- Sells: Flat (Stop loss: N/A).


