
Key risk events today:
French Flash Services PMI; French Flash Manufacturing PMI; German Flash Manufacturing PMI; German Flash Services PMI; EUR Flash Manufacturing PMI; EUR Flash Services PMI; UK Manufacturing PMI; UK Flash Services PMI; Canada core Retail Sales m/m; Canada Retail Sales m/m; US Flash Manufacturing PMI.
Market news (Thursday):
- European Central Bank (ECB) Monetary Policy Meeting Accounts: The ECB’s Minutes from its latest policy meeting delivered little by way of shock, essentially resonating the relatively uneventful nature of the meeting itself.
- Philly Fed Manufacturing Index: Manufacturing activity in the region continued to grow, according to results from the November Manufacturing Business Outlook Survey, according to the Federal Reserve Bank of Philadelphia. The diffusion index for current general activity rose 5 points this month to 10.4, after decreasing 6 points in October.
- BoC Governor Poloz made it clear the central bank has monetary conditions ‘about right’. The governor also added the bank has other options, such as forward guidance and LSAP to help weather storms.
- Markets hit by mixed US/China trade headlines – markets undecided.
EUR/USD:
(Italics = previous analysis).
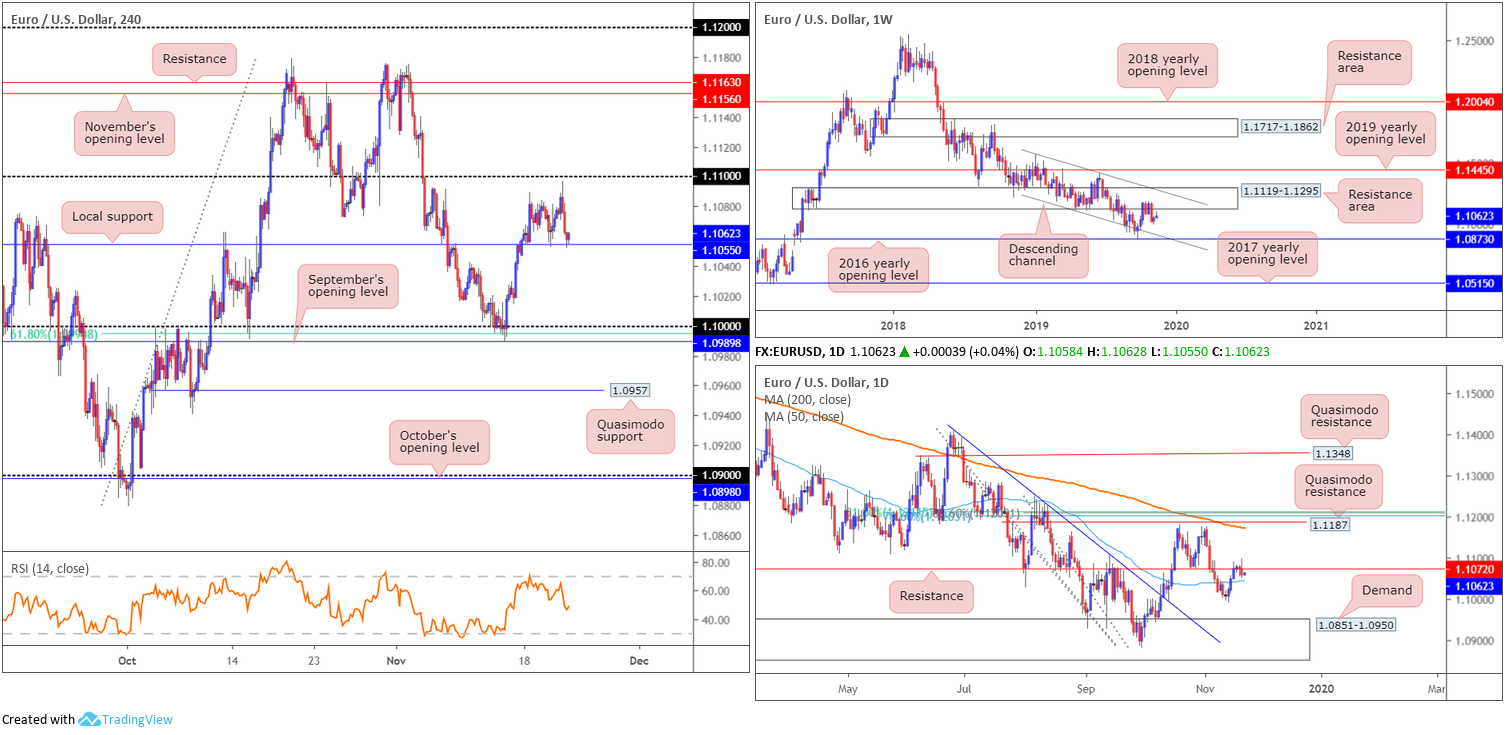
As the US dollar index discovered higher ground Thursday, challenging highs a touch north of 98.00, Europe’s shared currency curved lower. EUR/USD’s H4 price topped a few points south of the 1.11 handle, shortly after the ECB minutes, consequently concluding the session testing local support around the 1.1055ish region. A violation of this level may spur further selling towards the key figure 1.10, which happens to house additional layers of support nearby in the form of a 61.8% Fibonacci retracement at 1.0994 and September’s opening level at 1.0989.
Higher up on the curve, sellers appear to be strengthening their grip around daily resistance coming in at 1.1072. Nearby support in the form of a 50-day SMA (blue – 1.1042), however, is visible, with a break of this line exposing the 1.0989 November 14 low, followed by daily demand at 1.0851-1.0950.
Technical research based on the weekly chart positions the market just south of a long-standing resistance area at 1.1119-1.1295. Further selling has the lower boundary of a descending channel to target (extended from the low 1.1109), set a few points north of the 2016 yearly opening level at 1.0873. Concerning trend direction, the primary downtrend has been in motion since topping in early 2018 at 1.2555.
Areas of consideration:
Local H4 support at 1.1055 holds firm, as we write. This – coupled with the 50-day SMA on the daily timeframe – is likely to discourage many sellers today. A break of these two levels, though, will potentially encourage additional downside to the 1.10 vicinity. Therefore, intraday shorts beyond the 50-day SMA may be a consideration.
In terms of buying, this is chancy considering daily resistance at 1.1072. Beyond this level, however, scope to approach the 1.11 handle on the H4 timeframe is certainly a possibility, closely shadowed by the lower edge of the weekly resistance area at 1.1119.
GBP/USD:
(Italics = previous analysis).
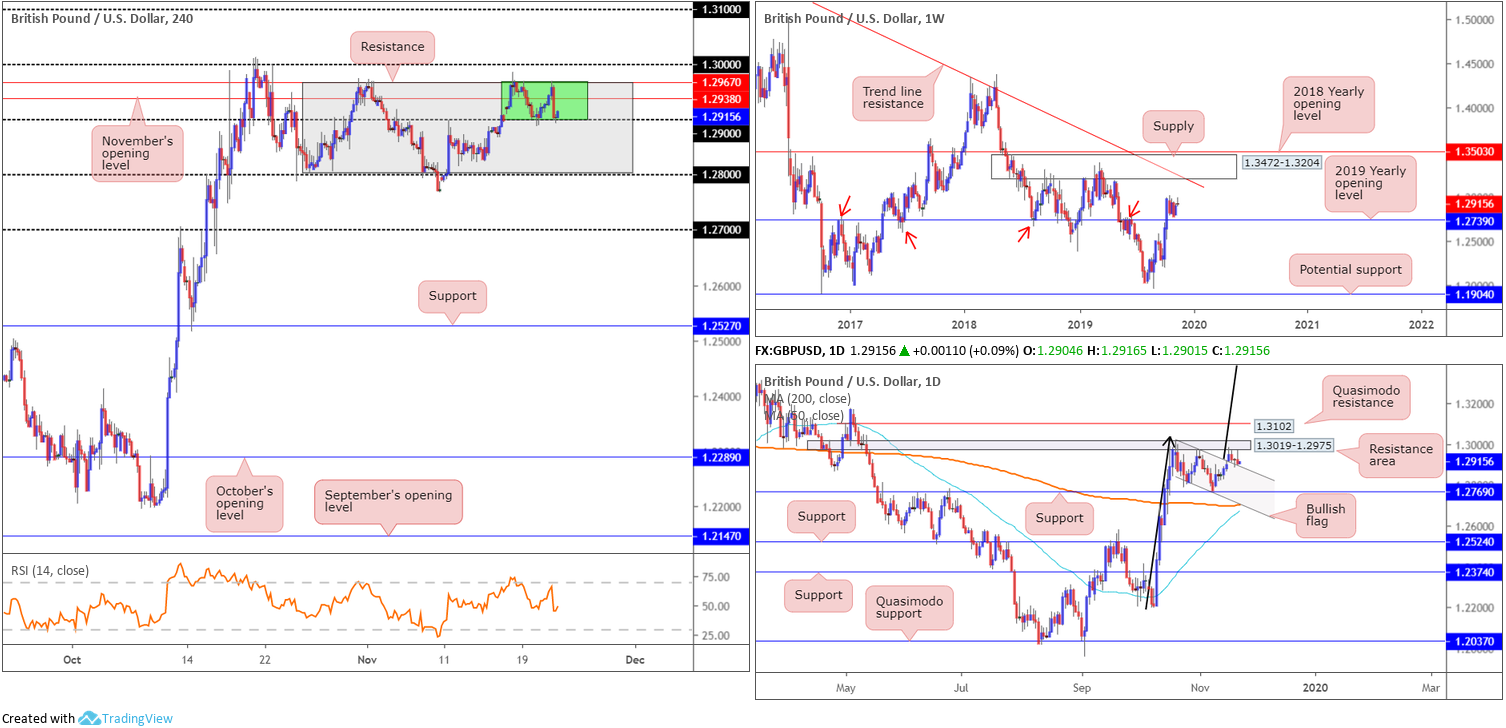
Amidst a firming greenback, GBP/USD wrapped up Thursday’s segment marginally lower. Since late October, the H4 candles have been busy carving out a consolidation between H4 resistance at 1.2967 and the 1.28 handle (grey). Interestingly, an additional range recently formed within the upper limit of the said area between 1.2967/1.29 (green).
Technical research on the daily timeframe reveals a bullish flag pattern (1.3012/1.2804) saw its upper boundary violated at the beginning of the week, in the shape of an opening gap. The resistance area plotted at 1.3019-1.2975, though, continues to cap upside. Between the underside of the daily resistance area and the upper boundary of the recently broken flag support the current H4 ranging motion marked in green.
Interestingly, the view on the weekly timeframe exhibits scope to extend north, at least until crossing swords with
supply at 1.3472-1.3204 and long-term trend line resistance etched from the high 1.5930. The immediate trend, however, faces a downward trajectory from 1.4376, with a break of the 1.1904 low (labelled potential support) confirming the larger downtrend from 1.7191.
Areas of consideration:
Longer-term traders are likely long based on the violated daily bullish flag. The bullish flag’s take-profit target is huge, coming in at 1.3780 (black arrows – measured from the preceding move and added to the breakout point).
An upside violation of 1.30 adds confidence to further buying out of the daily bullish flag, given limited resistance is visible until 1.31. In fact, this could serve as an additional entry point: a retest at 1.30 as support, following a decisive close higher.
A decisive break beneath the current H4 green range potentially offers an early cue we’re likely headed back into the current bullish flag on the daily chart, which implies a retest of daily support at 1.2769 may be in store.
AUD/USD:
(Italics = previous analysis).
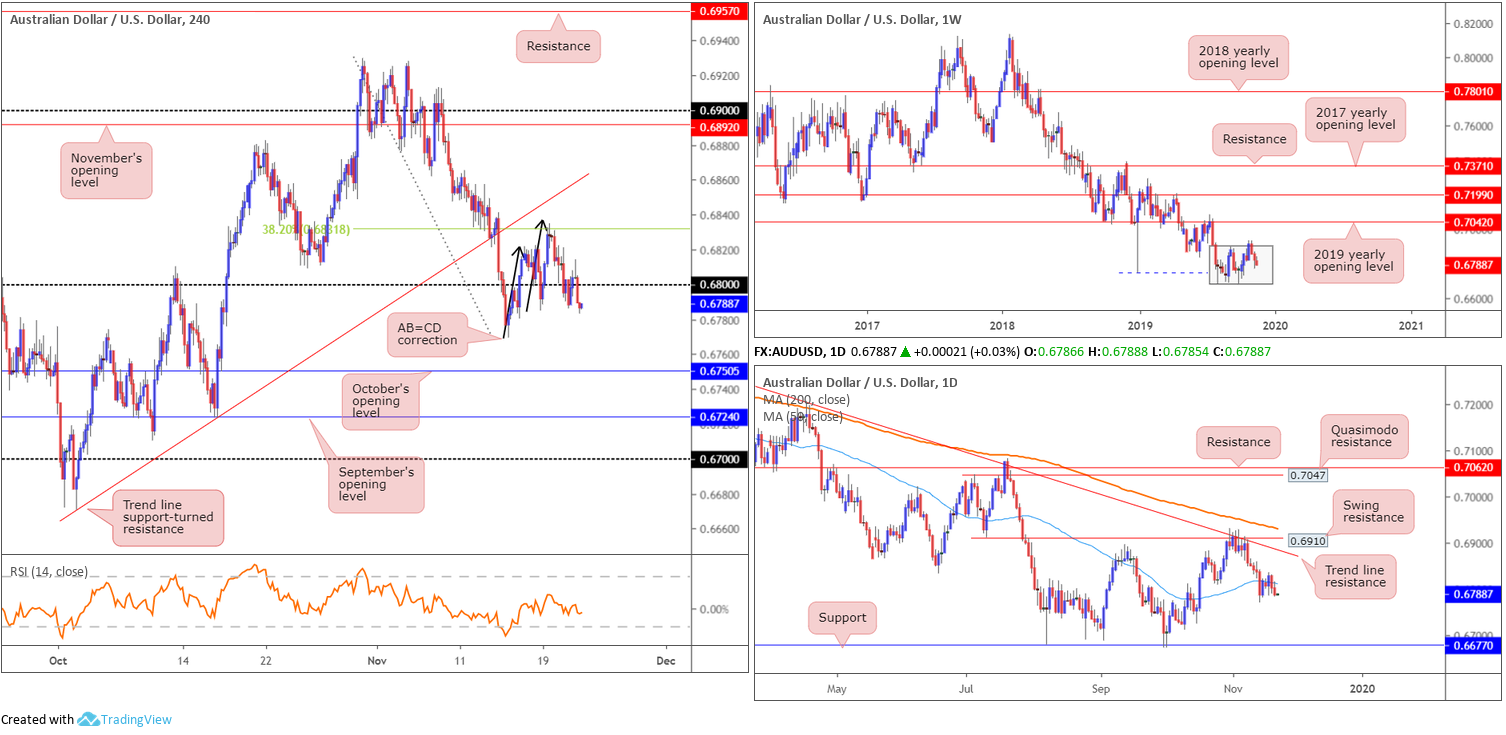
The Australian dollar ceded further ground to its US counterpart Thursday, shedding more than 16 points, or 0.24%. Weighed on largely by USD bidding on the back of upbeat manufacturing (see above), H4 shifted below its 0.68 threshold and ended the session closing at its lows.
Traders who remain short the H4 AB=CD bearish pattern (black arrows)/38.2% Fibonacci retracement ratio at 0.6831 likely reduced risk to breakeven and liquidated a portion of the position, based on Thursday’s close.
In conjunction with the break of 0.68, daily price overthrew its 50-day SMA (blue – 0.6810) in recent trade. Although support may develop around the 0.6728ish region on the daily timeframe, traders likely have their crosshairs fixed on support pencilled in from 0.6677. Traders short the current move also have the backing of weekly flow, stationed mid-range within its current 3-month long consolidation zone between 0.6894/0.6677 (light grey), following a 2-candle fakeout through the upper limit.
Areas of consideration:
Those who read Thursday’s analytical report may recall the following piece:
With buyers and sellers squaring off around the 0.68 handle this morning, as well as daily price nudging back beneath its 50-day SMA and weekly flow demonstrating scope to explore lower levels within its current range, further selling is a possibility today. A decisive H4 close beneath 0.68 that’s followed up with a retest, preferably in the shape of a H4 bearish candlestick configuration (entry and risk can [trader dependent] be set according to this structure), would likely be viewed as a potential short, targeting October’s opening level at 0.6750 on the H4 scale as an initial take-profit zone.
In light of the strong close sub 0.68, the research team’s outlook remains unchanged.
USD/JPY:
(Italics = previous analysis).
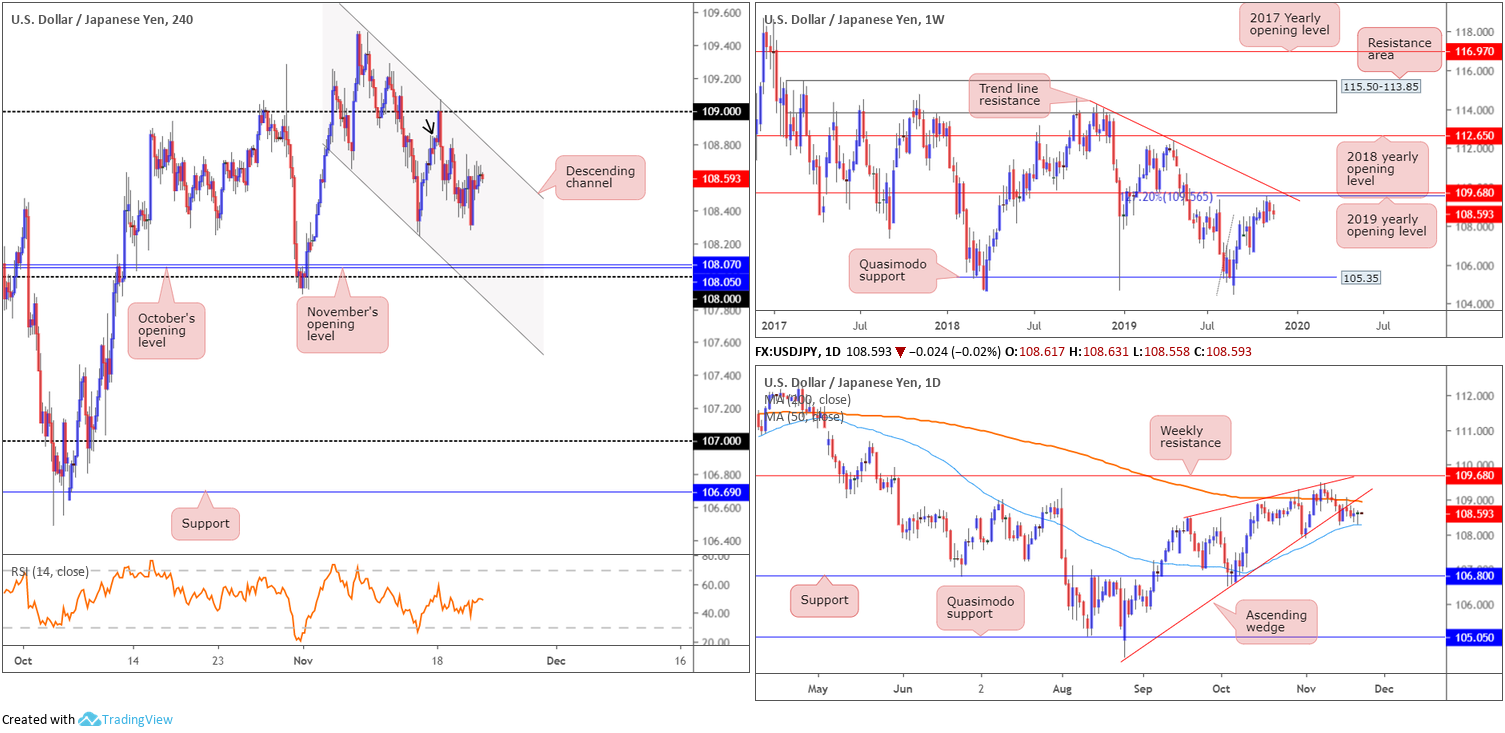
By all counts, the US dollar advanced against the majority of its G10 peers Thursday, with the dollar index nudging beyond the 98.00 threshold. US Treasuries also fared well, with the 10-year Treasury yield recovering more than 2.00% on the day. USD/JPY action clocked session lows of 108.27, though found strong support off the 50-day SMA (blue – 108.29) applied to the daily timeframe.
H4 price is currently chalking up a descending channel formation (109.47/108.64), with last Thursday’s low priced in as the next support at 108.24, closely shadowed by the 108 handle, along with November and October’s opening levels at 108.05 and 108.07, respectively.
Supporting the market’s downbeat tone is the 200-day SMA (orange – 108.95) and the lower edge of an ascending wedge formation (104.44), which has been unfolding since early September. Last week ended with the unit retesting the underside of the broken wedge. We essentially have the daily candles battling for position between the said resistances and the 50-day SMA value highlighted above.
Technical research based on the weekly timeframe has the unit meandering south of resistance in the form of the 2019 yearly opening level at 109.68 and a 127.2% Fibonacci ext. point at 109.56 (taken from the low 104.44). Also sited nearby is trend line resistance extended from the high 114.23. In regards to the market’s primary trend, the pair has been entrenched within a range since March 2017, spanning 115.50/105.35.
Areas of consideration:
For those who read Thursday’s analysis you may recall the following:
Traders short from the 109 handle, a noted level for possible shorting opportunities at the beginning of the week, remain in a healthy position. In terms of downside targets, see above in bold; however, traders are also urged to take into account the 50-day SMA (blue – 108.27), which may also serve as support.
With the 50-day SMA making a stand as support yesterday, this may encourage profit taking for those short 109. Nevertheless, leaving a portion of the position open is certainly an option, given the higher-timeframe position.
USD/CAD:
(Italics = previous analysis).
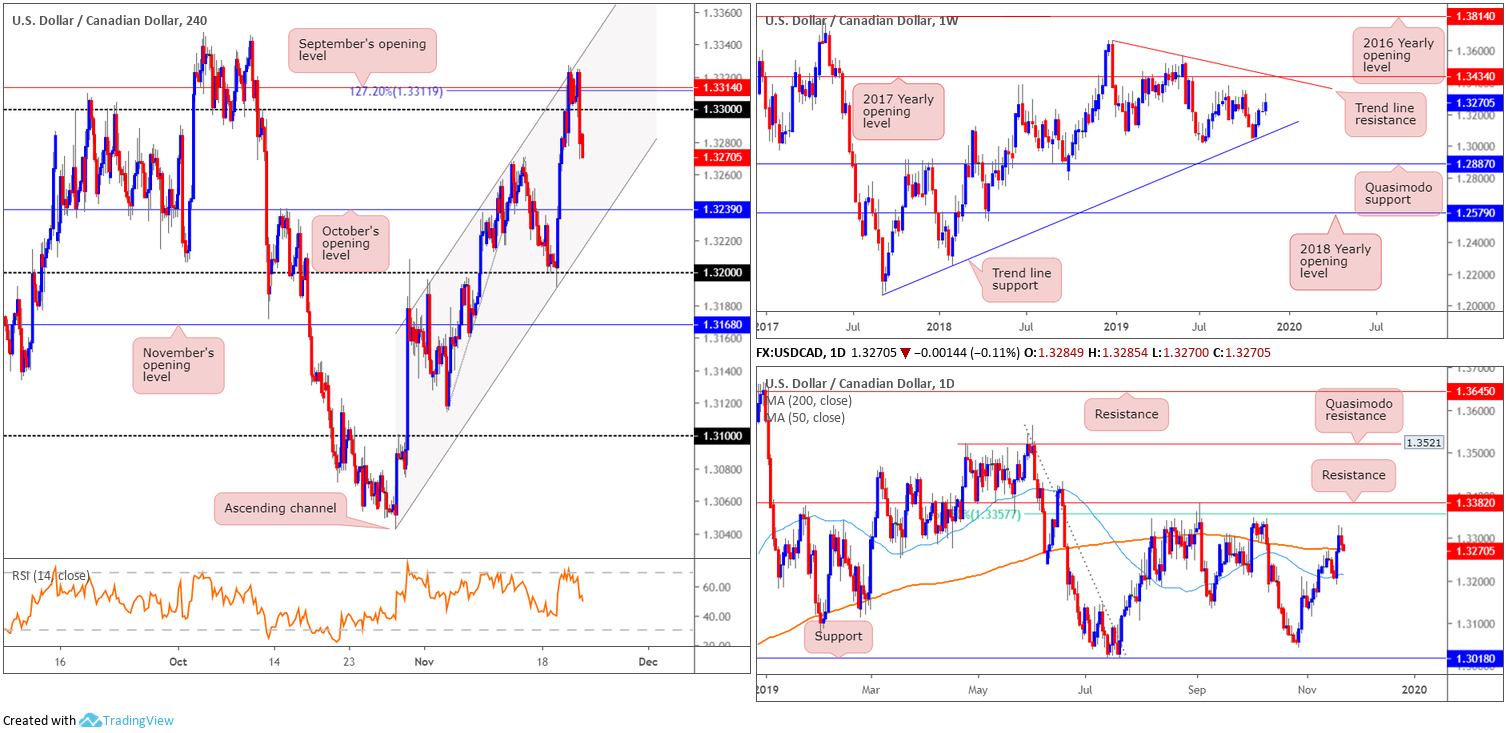
USD/CAD movement, despite recording strong highs the day prior, fell sharply Thursday following the Bank of Canada (BoC) Governor Poloz’s hawkish comments and advancing crude oil prices.
H4 dethroned 1.33, settling at 1.3284. Technical selling also likely played a role here, having seen the candles shake hands with channel resistance extended from the high 1.3267, September’s opening level at 1.3314 and a 127.2% Fibonacci extension point at 1.3311. The next downside target, according to H4 structure, resides around October’s opening level at 1.3239, which happens to align with channel support taken from the low 1.3051.
On more of a broader perspective, daily price is seen retesting the 200-day SMA (orange – 1.3275), with a break of this level exposing the nearby 50-day SMA (blue – 1.3214). A rally from this point has resistance around the 1.3382 neighbourhood/61.8% Fibonacci retracement ratio at 1.3357 in sight.
According to the weekly timeframe, the unit is nearing tops around 1.3342, closely followed by the 2017 yearly opening level at 1.3434 and trend line resistance taken from the peak at 1.3661.
Areas of consideration:
The point October’s opening level at 1.3239 merges with H4 channel support is likely of interest for many buyers. However, this entails breaking through the current 200-day SMA. In addition to this, traders may want to consider waiting for additional candlestick confirmation (entry/risk can then be set according to this pattern) to form off 1.3239 before pulling the trigger, due to the possibility of a fakeout to the 50-day SMA currently hovering around 1.3215.
USD/CHF:
(Italics = previous analysis).
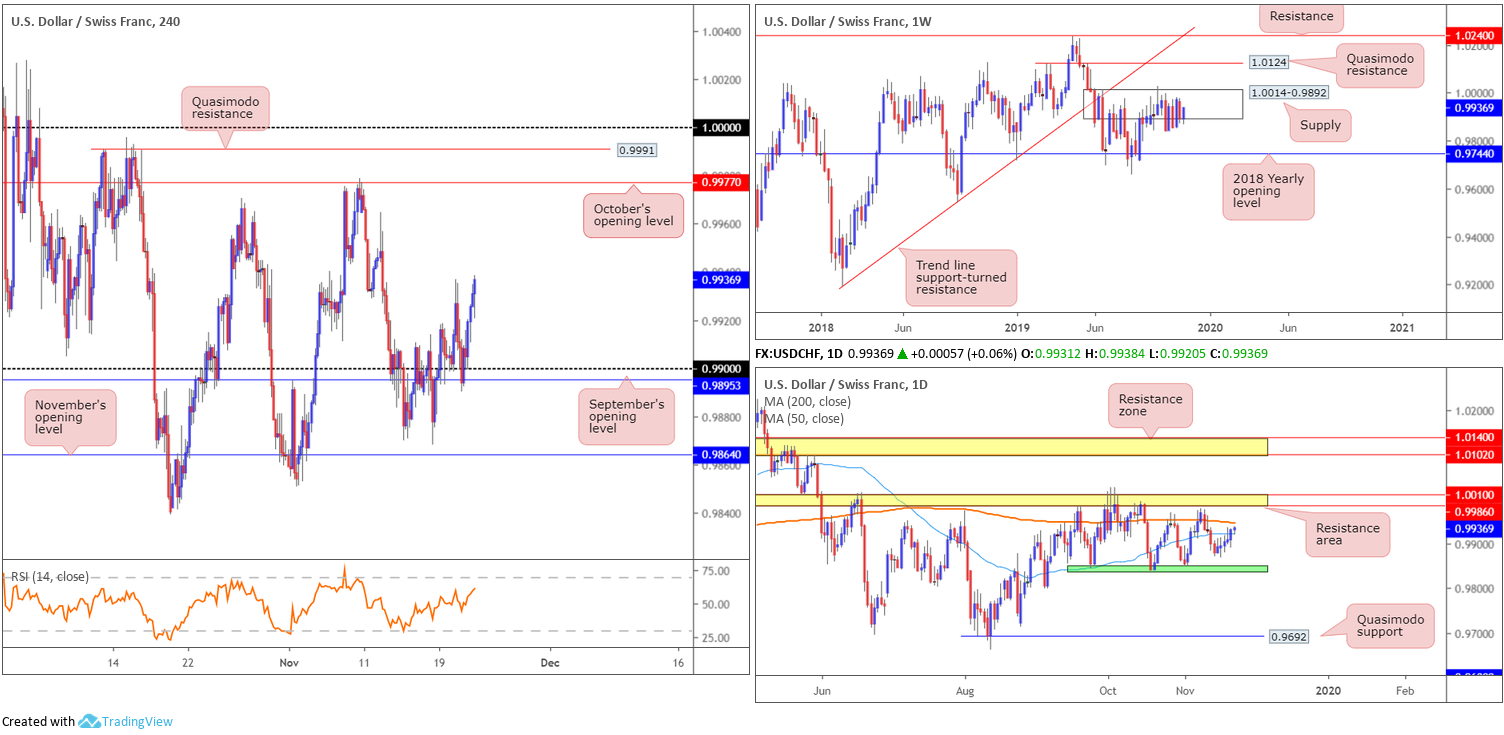
USD/CHF bulls entered a healthy offensive phase Thursday, adding 0.23%. H4 price retested September’s opening level at 0.9895/the 0.99 handle in the early hours of the session, and reached highs at 0.9935. The next upside objective on this scale can be seen around October’s opening level at 0.9977, closely shadowed by a Quasimodo resistance at 0.9991 and key figure 1.0000 (parity).
As evident from the daily timeframe, recent buying absorbed the 50-day SMA (blue – 0.9923) on the daily timeframe, consequently exposing the nearby 200-day SMA (orange – 0.9947). Traders may also want to acknowledge daily action, since mid-September, has been busy carving out a consolidation between support around the 0.9845ish region (green) and a resistance area coming in at 1.0010/0.9986.
Weekly price remains nestled around the underside of supply at 1.0014-0.9892. As highlighted in previous reports, the beginning of October witnessed a penetration to the outer edge of the supply area’s limit, possibly tripping a portion of buy stops and weakening sellers. An upside move out of the said supply may draw in Quasimodo resistance at 1.0124, while downside has the 2018 yearly opening level at 0.9744 in sight. According to the primary trend, price also reflects a slightly bullish tone; however, do remain aware we have been rangebound since the later part of 2015 (0.9444/1.0240).
Areas of consideration:
While bulls trade in a healthy spot this morning, entering long on the back of recent momentum is chancy, knowing the unit nears the underside of its 200-day SMA. Further to this, traders are reminded longer-term price remains within supply.
Dow Jones Industrial Average:
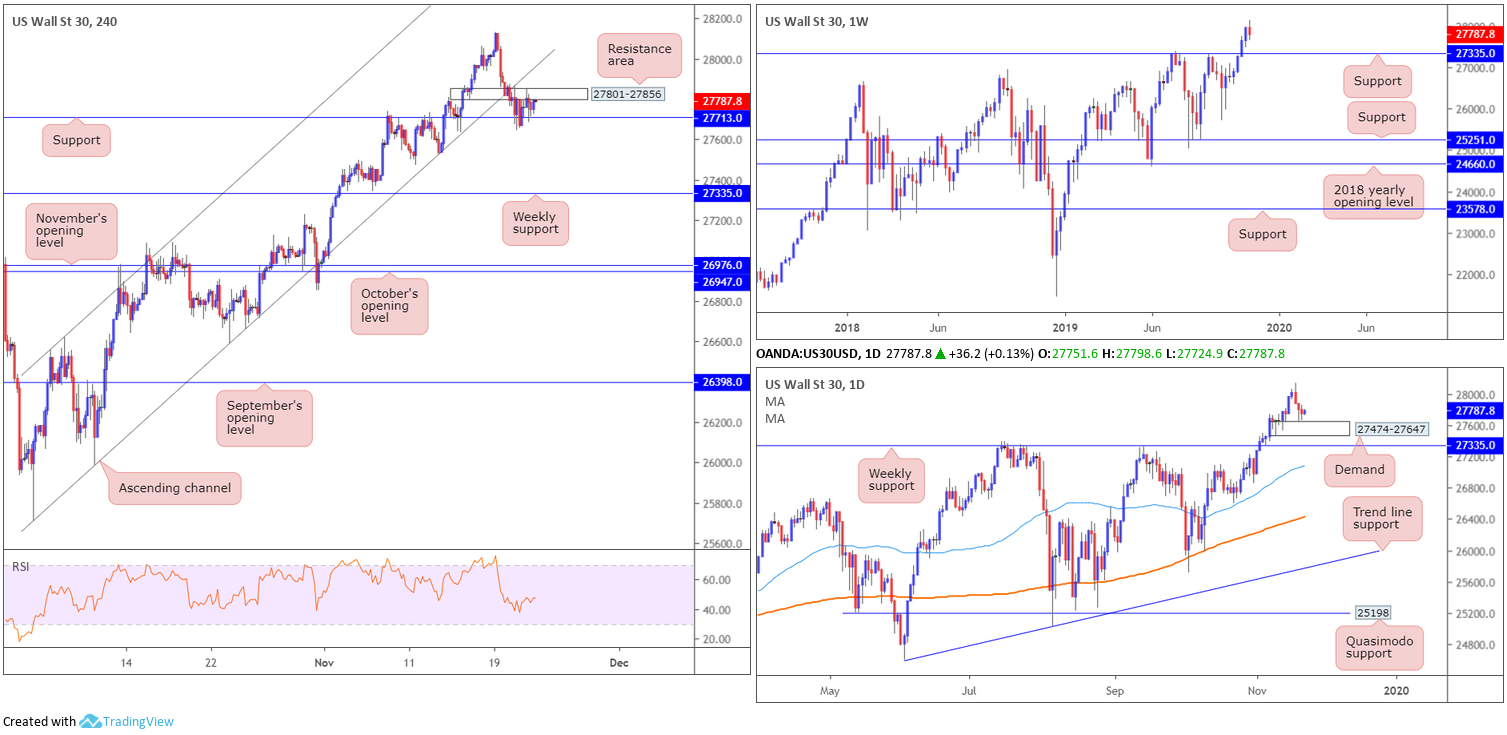
Major equity indexes slumped Thursday as markets digested mixed US/China trade headlines. The Dow Jones Industrial Average erased 54.80 points, or 0.20%; the S&P 500 lost 4.92 points, or 0.16% and the tech-heavy Nasdaq 100 declined 18.14 points, or 0.22%.
Technically speaking, H4 price remains narrowly confined between support at 27713 and a resistance area drawn from 27801-27856. Earlier in the week, price action drove through channel support taken from the low 25710, suggesting a temporary pause in the uptrend. A break of the current support has a number of ‘local’ lows to contend with, though major support rests around 27335, a weekly base.
Research based on the daily timeframe reveals demand at 27474-27647, sited a few points north of the aforementioned weekly support, remains intact.
Areas of consideration:
The break of H4 channel support is likely a concern for swing traders. However, with daily demand holding ground, buyers are unlikely to close out longs just yet. New buyers, nonetheless, are unlikely to trade long with conviction until we break back into the current H4 channel.
Sellers considering a position on a break of 27713 face support off the current daily demand, therefore, this is considered a low-probability setup.
XAU/USD (GOLD):
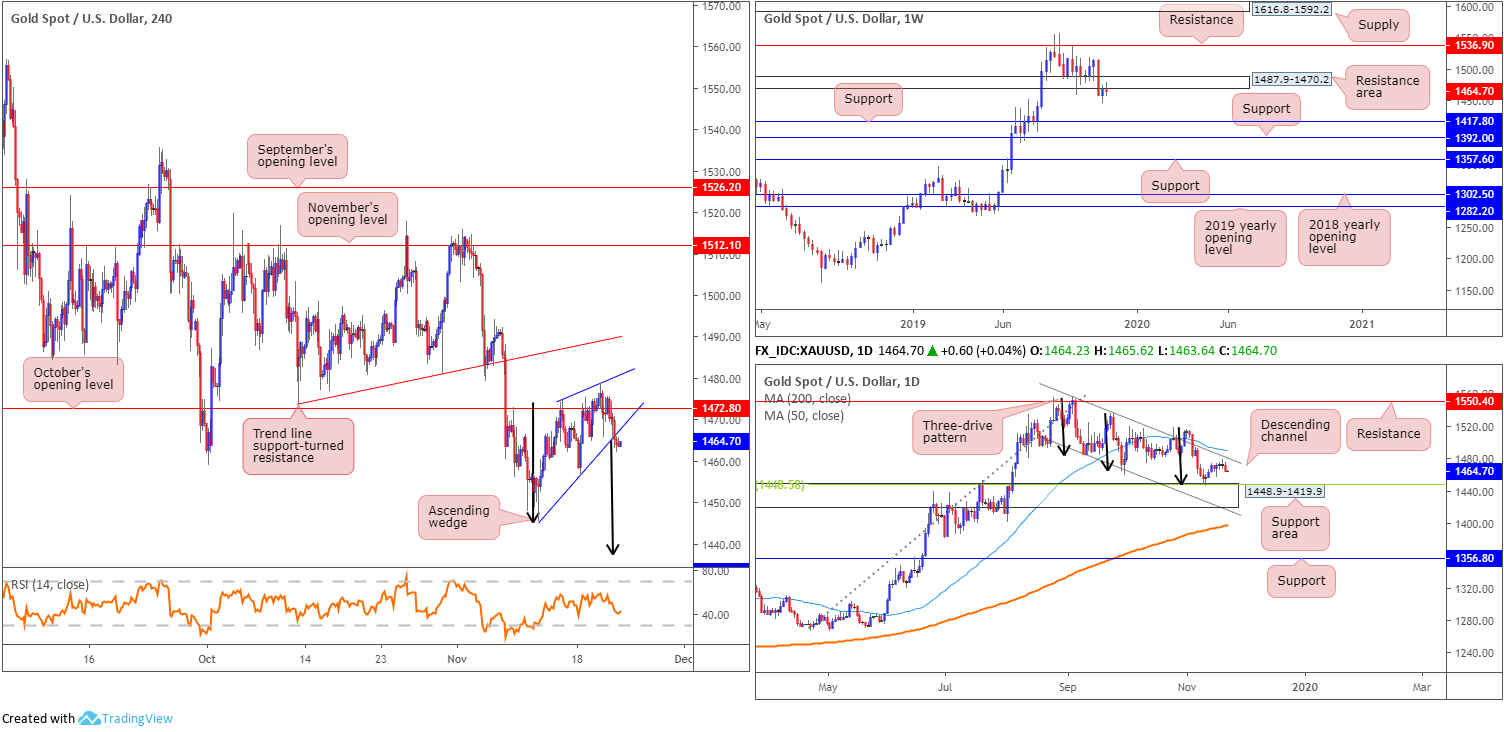
Thursday witnessed the price of gold decline against the US dollar, erasing more than $7, or 0.50%. What’s notable from a technical standpoint is the H4 ascending channel, formed since bottoming at 1445.5. Typically considered a bearish configuration, the lower edge of the pattern gave way in recent trade, suggesting a run lower may be on the cards. The take-profit target for an ascending wedge can be measured by taking the size of the base and applying this value to the breakout point (black arrows); in this case, 1437.7.
Couple the break of the H4 ascending wedge with weekly price testing a resistance area at 1487.9-1470.2, the move lower could be notable. In addition, although leaving channel resistance (1557.1) unchallenged, room to move lower is visible on the daily timeframe until reaching a support area at 1448.9-1419.9, which aligns with a 38.2% Fibonacci retracement ratio.
Areas of consideration:
Shorts at current price are certainly an option this morning. Stop-loss placement, however, is dependent on risk appetite. Aggressive sellers may be content with a stop-loss order positioned above the upper shadow of the breakout candle at 1470.2; others may feel more comfortable with a stop-loss order above October’s opening level at 1472.8.
The accuracy, completeness and timeliness of the information contained on this site cannot be guaranteed. IC Markets does not warranty, guarantee or make any representations, or assume any liability regarding financial results based on the use of the information in the site.
News, views, opinions, recommendations and other information obtained from sources outside of www.icmarkets.com.au, used in this site are believed to be reliable, but we cannot guarantee their accuracy or completeness. All such information is subject to change at any time without notice. IC Markets assumes no responsibility for the content of any linked site.
The fact that such links may exist does not indicate approval or endorsement of any material contained on any linked site. IC Markets is not liable for any harm caused by the transmission, through accessing the services or information on this site, of a computer virus, or other computer code or programming device that might be used to access, delete, damage, disable, disrupt or otherwise impede in any manner, the operation of the site or of any user’s software, hardware, data or property.


