
Key risk events today:
BoJ Monetary Policy Statement and Press Conference; UK Retail Sales m/m; ECB Monetary Policy Meeting Accounts; Canada Core Retail Sales m/m.
(Previous analysis as well as outside sources – italics).
EUR/USD:
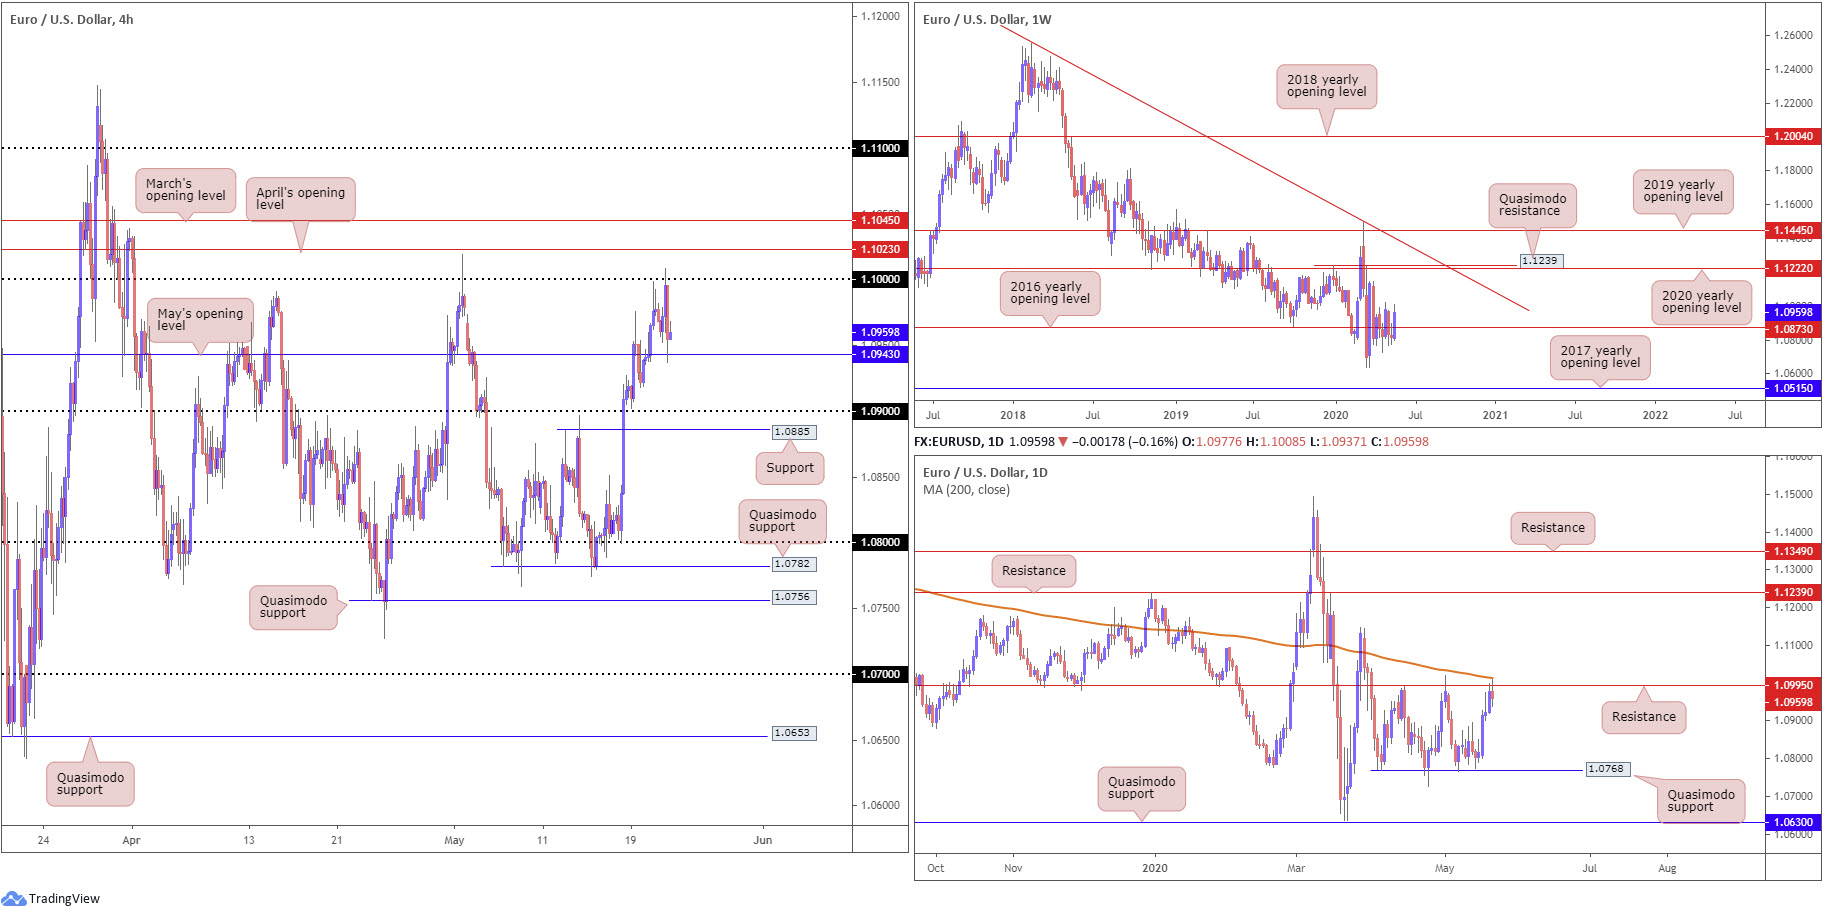
Europe’s shared currency concluded lower against the US dollar Thursday, unwinding from the key figure 1.10, a move reaching as far south as May’s opening level coming in at 1.0943 on the H4 timeframe.
On the data front, the Eurozone shows signs of easing as lockdowns lift.
Markit noted:
The Eurozone economy remained stuck in its deepest downturn ever recorded in May due to ongoing measures taken to control the coronavirus disease 2019 (COVID-19) outbreak, according to provisional PMI survey data. However, the rate of decline eased as parts of the economy started to emerge from lockdowns.
In addition, 2.4 million Americans filed jobless claims last week, bringing the nine-week total to nearly 40 million.
According to the US Department of Labour:
In the week ending May 16, the advance figure for seasonally adjusted initial claims was 2,438,000, a decrease of 249,000 from the previous week’s revised level. The previous week’s level was revised down by 294,000 from 2,981,000 to 2,687,000. The 4-week moving average was 3,042,000, a decrease of 501,000 from the previous week’s revised average. The previous week’s average was revised down by 73,500 from 3,616,500 to 3,543,000.
From a technical perspective, beyond May’s opening level coming in at 1.0943 the 1.09 handle calls for attention as potential support, sited just north of another layer of support from 1.0885 (a prior Quasimodo resistance level). Chart studies also indicate additional resistance above 1.10 plotted by way of April and March’s opening levels at 1.1023 and 1.1045, respectively.
Further afield, weekly price is regaining a footing above the 2016 yearly opening level at 1.0873, with additional buying theoretically setting the stage for a run to the 2020 yearly opening level at 1.1222. A bump lower from here, though, could have multi-year lows enter at 1.0635. It’s also worth reminding ourselves the pair has remained in a long-term downtrend since topping in early 2018.
Meanwhile, daily price crossed swords with resistance at 1.0995 in recent trading, with Thursday attempting to draw in the nearby 200-day SMA (orange – 1.1013). Traders may also want to note between the said resistance and Quasimodo support at 1.0768 has, since early April, witnessed a consolidation form.
Areas of consideration:
Despite H4 price displaying signs of resilience off May’s opening level at 1.0943, daily selling off resistance at 1.0995 could be a problem for buyers. A breakout sub 1.0943, therefore, is possible, targeting 1.09 as the initial port of call.
In the event of a climb, however, we could be looking at a possible scenario involving 1.10, highlighted in Thursday’s technical briefing (italics):
Owing to round numbers being prone to fakeouts, a whipsaw through 1.10 could be in store to April’s opening level at 1.1023 (and the 200-day SMA at 1.1013). The theory is buy-stops above 1.10, when filled, become liquidity to sell into off 1.1023. Conservative traders will likely want to see a H4 close.
GBP/USD:
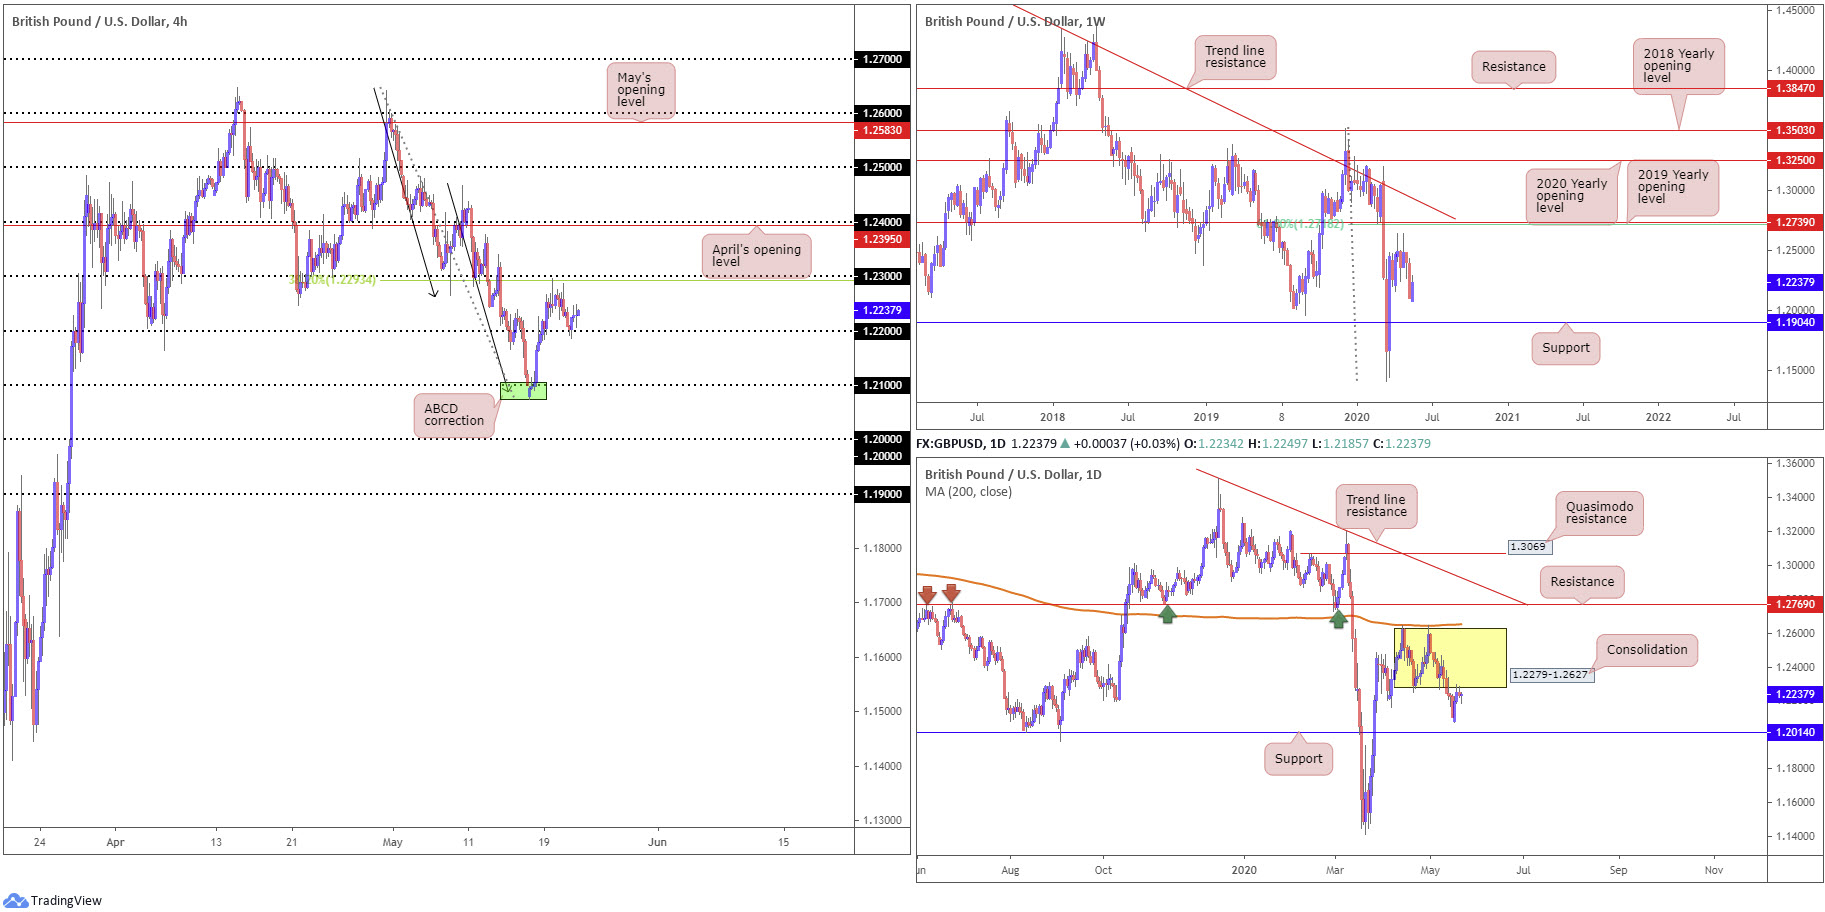
Sterling derived fresh impetus on the back of better-than-anticipated UK PMIs Thursday, containing downside sub 1.22, based on the H4 timeframe. To the upside, chart studies has 1.23 in sight, along with a 38.2% Fibonacci retracement ratio at 1.2293. As highlighted in Thursday’s technical briefing, this Fibonacci level marks the first take-profit target out of the recently completed H4 ABCD completion (black arrows) from 1.2085.
Violating 1.22 today frees the path south to approach 1.21, while above 1.23, April’s opening level at 1.2395 could enter view, closely shadowed by 1.24.
Higher up on the curve, we can see from the weekly timeframe support is positioned at 1.1904, whereas resistance is found at 1.2739, the 2019 yearly opening level, closely intersecting with a 61.8% Fibonacci retracement ratio at 1.2718. Movement on the daily timeframe, however, locates price action at the underside of recently broken daily range lows at around 1.2279.
Areas of consideration:
Having noted daily price tackling the underside of a feasible resistance base (1.2279), buyers off 1.22 could be fragile. This may lead to a break of 1.22 today, underlining breakout strategies in favour of a drop to 1.21. Conservative traders may seek a pullback/retest scenario off 1.22 should we see a break lower, preferably shaped in the form of a H4 bearish candlestick pattern.
AUD/USD:
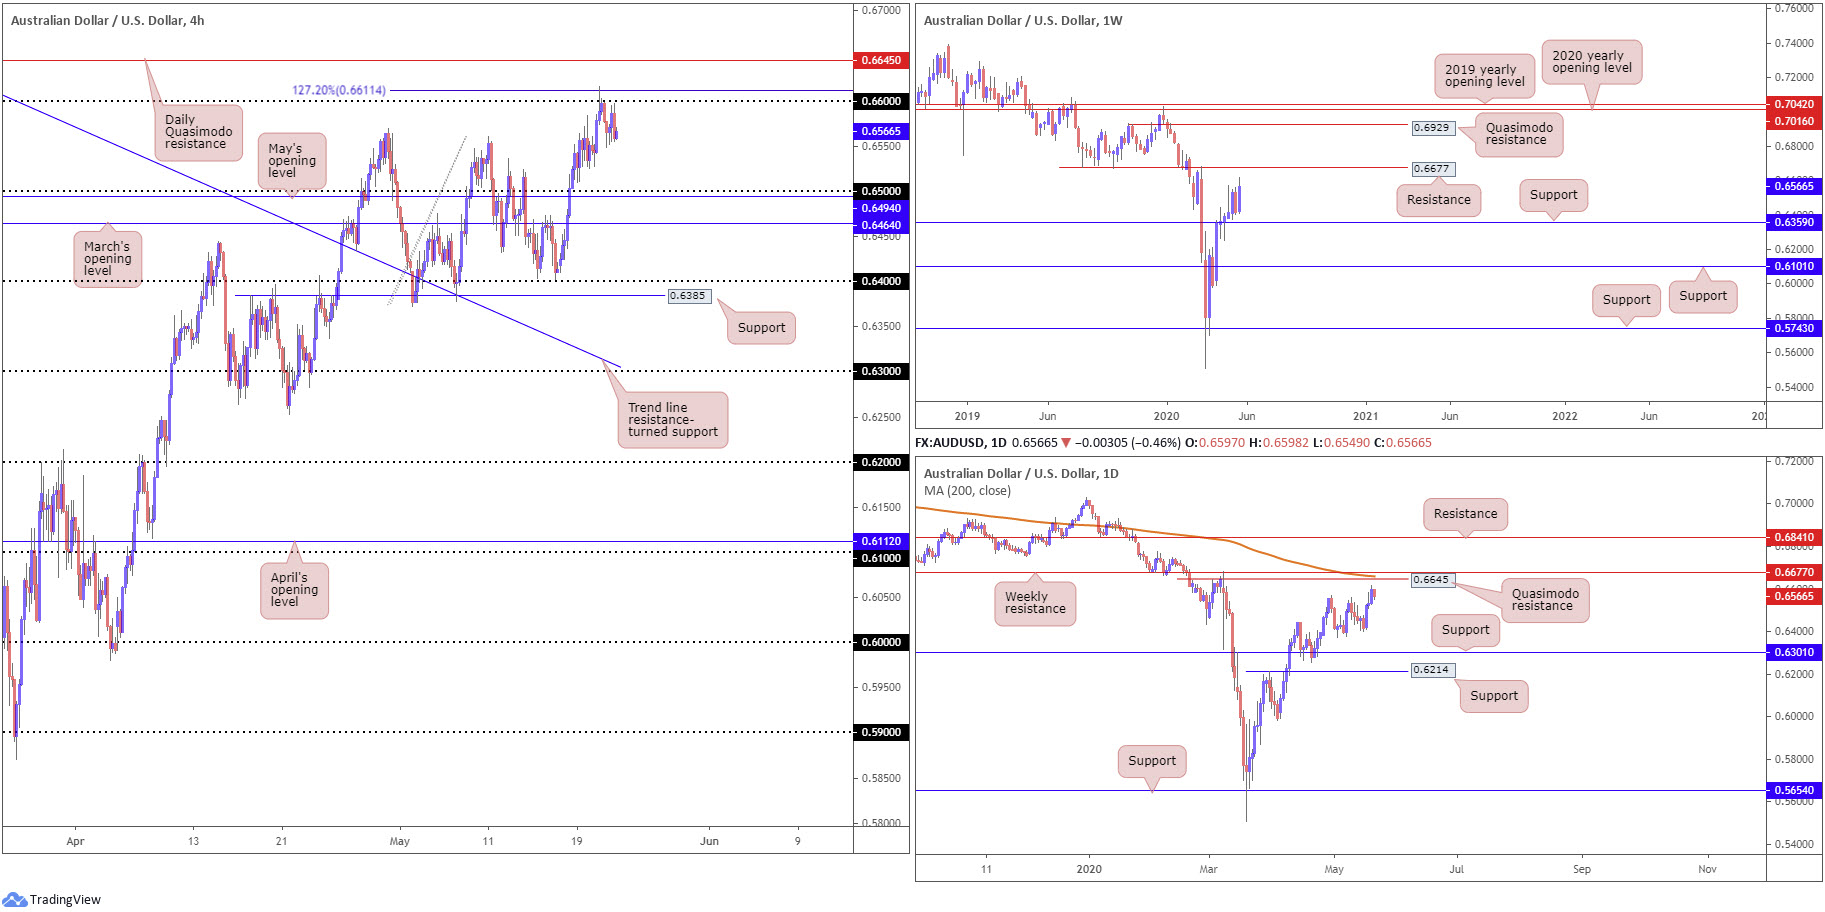
Risk sentiment took a mild hit Thursday amid heightened US/China tensions, consequently strengthening AUD/USD resistance on the H4 timeframe from 0.66 and a closely sited 127.2% Fibonacci extension point at 0.6611. Snapping a three-day bullish phase, H4 candles may welcome 0.65 to the floor today, which, as you can see, comes together with May’s opening level at 0.6494. Rotating higher, nonetheless, could draw in daily Quasimodo resistance plotted at 0.6645.
With price reclaiming all of the prior week’s losses this week, the weekly timeframe suggests scope for further buying, targeting resistance coming in at 0.6677.
A closer reading of price action on the daily timeframe has the unit topping just ahead of a Quasimodo formation mentioned above at 0.6645, parked just ahead of the noted weekly resistance level at 0.6677 and a 200-day SMA (orange – 0.6659).
Areas of consideration:
The following was aired in Thursday’s technical briefing (italics):
Attempting shorts off 0.66 may interest countertrend traders today, particularly as we have a H4 127.2% Fibonacci extension point nearby at 0.6611.
While 0.66 is holding firm, it’s difficult to say whether sellers have enough oomph to carry the currency pair to 0.65, given room seen to nudge higher on the bigger picture.
The research team also noted the following in Thursday’s report (italics):
0.66 may come under fire, as the daily Quasimodo resistance at 0.6645, 200-day SMA at 0.6659 and weekly resistance at 0.6677 appeals, technically speaking, as the stronger resistance area for short sellers.
USD/JPY:
Despite government data showing 2.4 million Americans filed unemployment claims last week and US equities dipped lower across the board on Thursday, USD/JPY concluded the session pretty much unchanged.
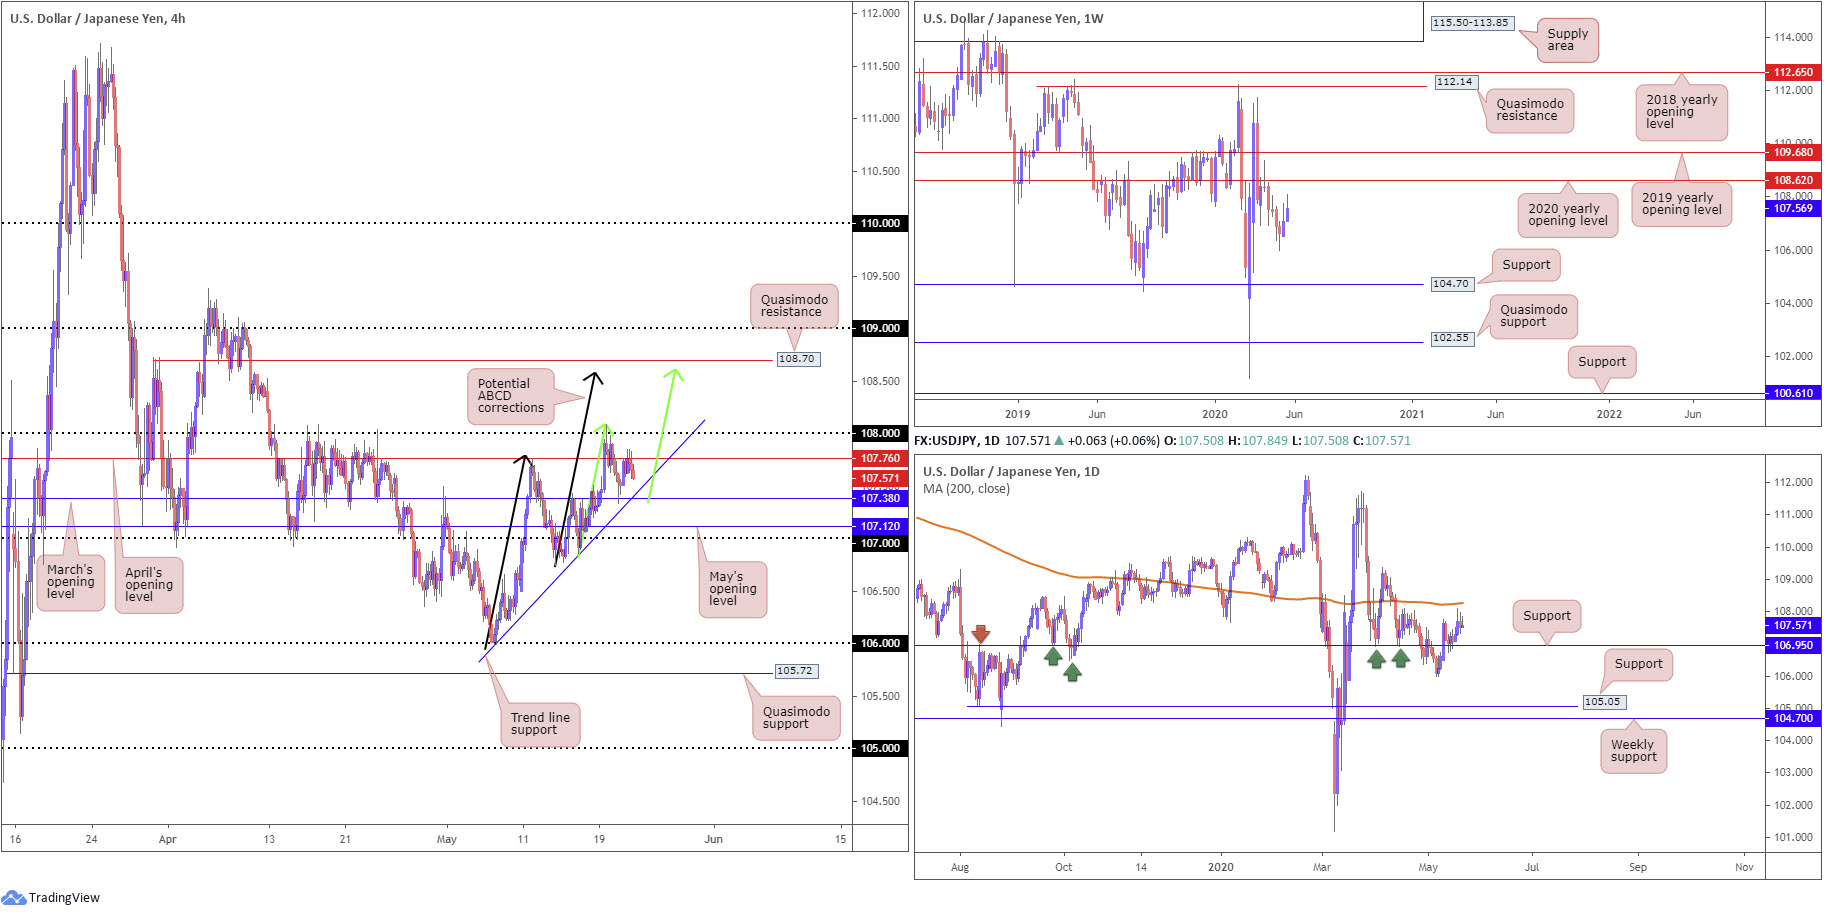
Intraday action latched onto a bid off March’s opening level from 107.38 in recent trading, a level converging closely with trend line support, taken from the low 105.98. The move drew the action towards April’s opening level at 107.76, with a break exposing the 1.08 round number as feasible resistance, owing to the number of times the level capped upside since mid-April. Also of interest, above 1.08 we have two ABCD bearish patterns (black/green arrows) merging around 108.60ish, sited just ahead of Quasimodo resistance at 108.70.
On the weekly timeframe, we can see price action hovering beneath the 2020 yearly opening level at 108.62. A rotation to the downside from current price, however, has support at 104.70 to target.
Technical action on the daily timeframe recently shook hands with support at 106.95, after dipping from three-week tops at 107.76. Current movement, as you can see, trades within striking distance of the 200-day SMA (orange – 108.26).
Areas of consideration:
H4 flow is relatively tight at the moment, with little room to manoeuvre between April’s opening level at 107.76 and March’s opening level at 107.38.
A fakeout through 108 into the 200-day SMA at 108.26 is a potential scenario today, possibly interesting sellers. Buy-stops contained above 108 will likely provide enough fuel to sell. Conservative traders, though, may seek a H4 close back beneath 108 before committing.
The H4 ABCD corrections at 108.60 also marks an interesting reversal zone, an area boasting a close relationship with H4 Quasimodo resistance at 108.70 and weekly resistance at 108.62 (the 2020 yearly opening level).
USD/CAD:
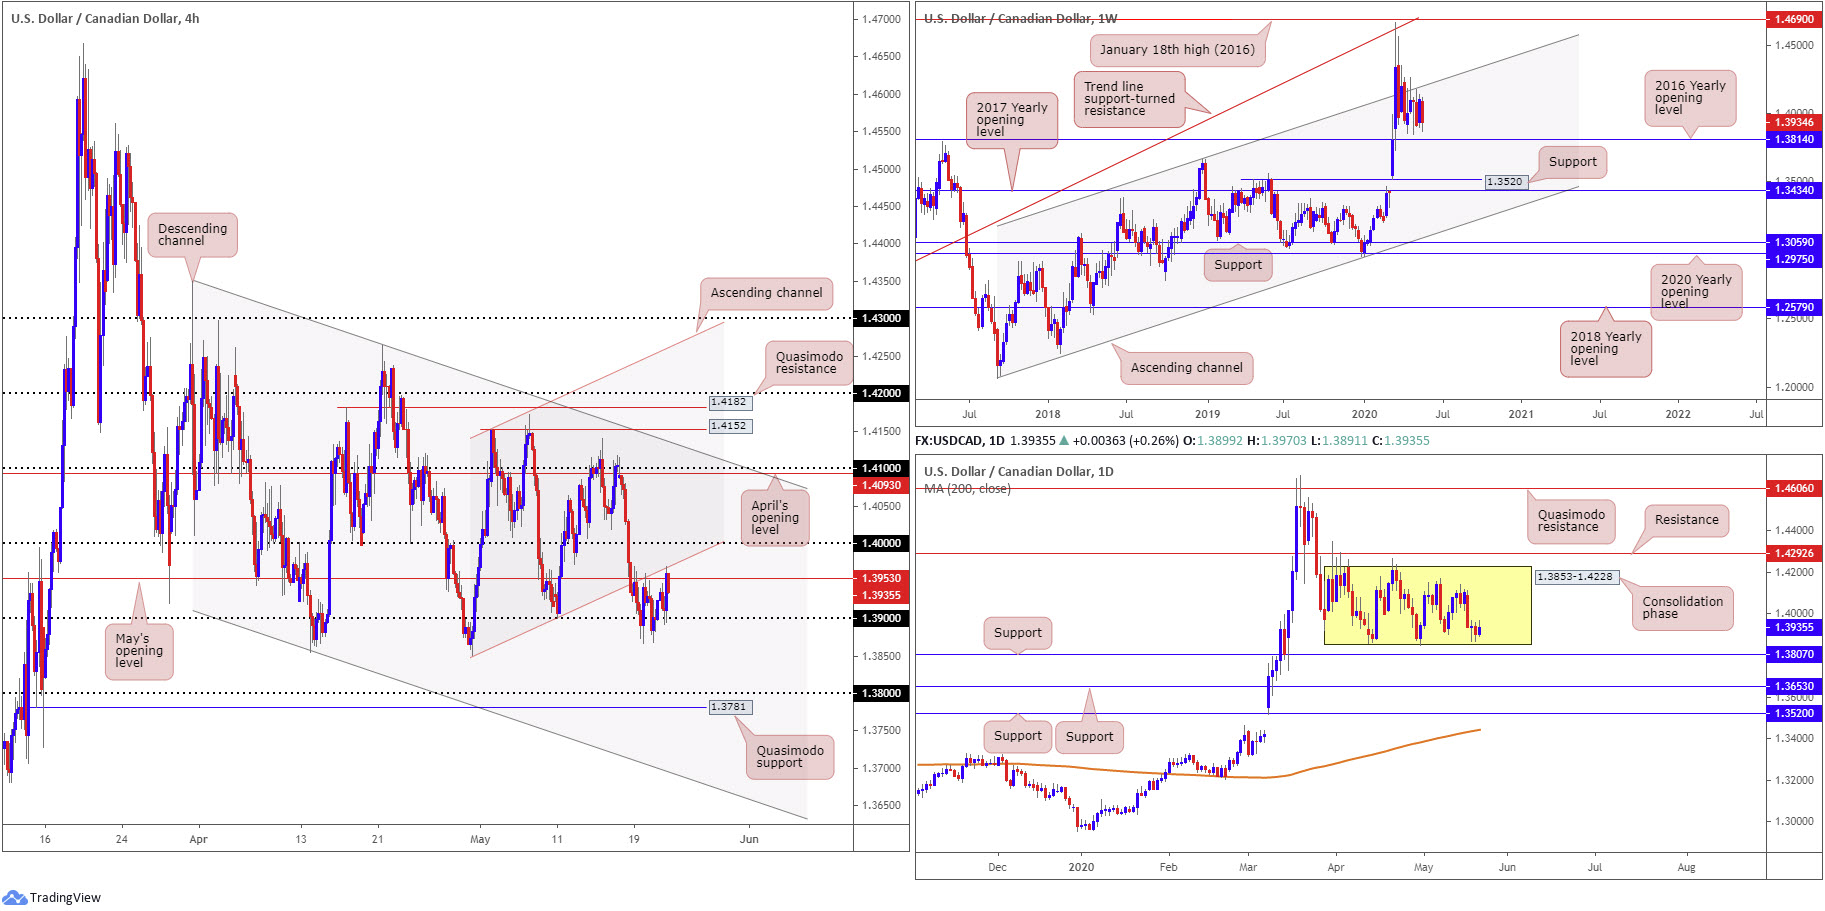
Since Tuesday, buyers and sellers have been battling for position between the 1.39 handle and May’s opening level at 1.3953 (and channel support-turned resistance, taken from the low 1.3850) on the H4 timeframe. Sustained downside below 1.39 shifts focus towards the 1.38 handle and Quasimodo support from 1.3781, while above the said resistances we have the key figure 1.40.
The story on the daily timeframe has seen price action carve out a consolidation between 1.3853-1.4228 since April – current price trades within close proximity of range lows. Areas outside of the base can be found at resistance drawn from 1.4292 and support at 1.3807. In addition, traders will note the 200-day SMA (orange – 1.3442) has been drifting northbound since March.
The daily range is also visible on the weekly timeframe, forming mid-way between a long-standing channel resistance, taken from the high 1.3661, and support at the 2016 yearly opening level from 1.3814. The said base stands in a reasonably healthy position as, overall, we’ve been trending higher since September 2017.
Areas of consideration:
Lower-timeframe traders will likely have eyes on the current H4 range between 1.3953 and the 1.39 handle today. 1.40 is also likely a watched level of resistance.
Above 1.40, nonetheless, may appeal to breakout buyers, with an upside target resting around May’s opening level from 1.4093, followed by 1.41.
If 1.39 gives way, reaching daily range lows at 1.3853 and maybe, with a little oomph, the daily support at 1.3807 and 1.38 handle is possible. Conservative sellers below 1.39 may seek additional bearish candlestick confirmation before taking action. Not only does this help confirm seller intent under 1.39, it provides structure to position entry and risk levels.
USD/CHF:
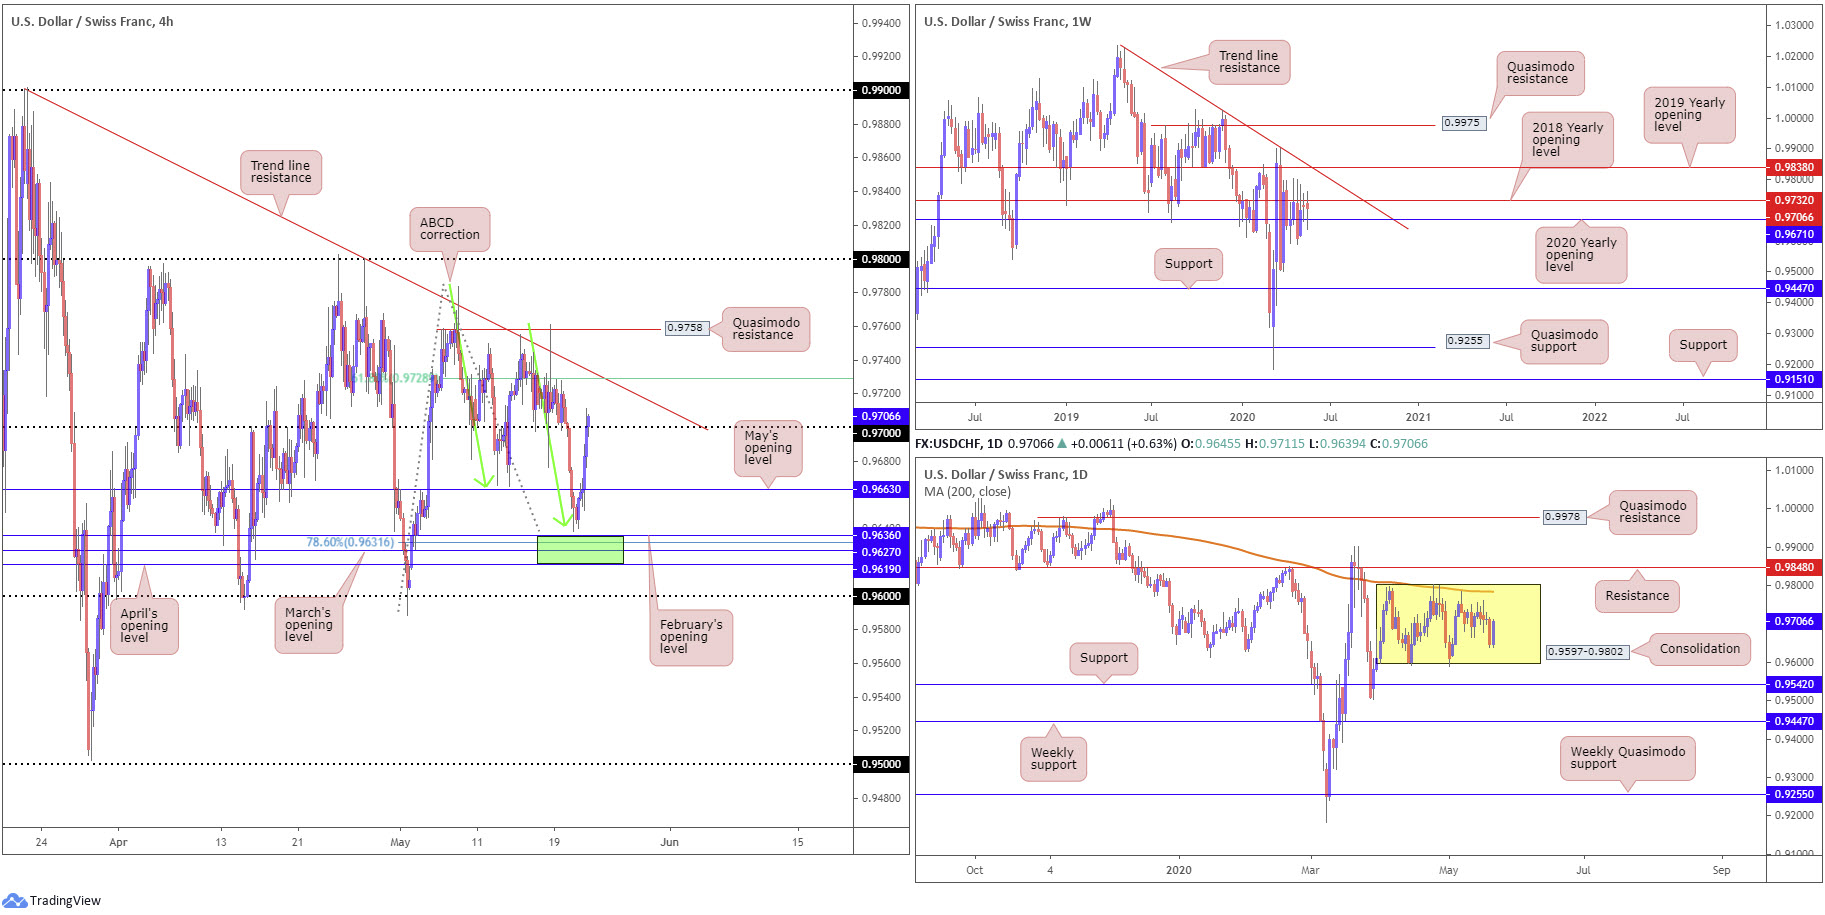
Responding to a H4 ABCD correction (green arrows) at 0.9641 and leaving 0.9619/0.9636 (green) unchallenged, an area made up of April, March and February’s opening levels, the US dollar pencilled in a firm recovery against the Swiss franc Thursday amid risk-off trade. H4 price climbed above May’s opening level at 0.9663 and shook hands with 0.97, with the unit currently threatening further upside to trend line resistance, extended from the high 0.9900 and a 61.8% Fibonacci retracement ratio at 0.9728 (note this is traditionally considered a take-profit target out of ABCD scenarios).
Since early April, price action on the daily timeframe has seesawed between 0.9802/0.9597, with current price trading mid-range. Traders may also want to acknowledge the 200-day SMA (orange – 0.9784) circles the upper boundary of the aforesaid range. Outside of the base, traders will note resistance rests at 0.9848 and support from 0.9542.
Shifting focus to the weekly timeframe reveals price action sandwiched between the 2020 yearly opening level at 0.9671, and the 2018 yearly opening level at 0.9732.
Areas of consideration:
Intraday traders today, having seen H4 price attempting to conquer 0.97, may make their way towards trend line resistance, taken from the high 0.9900, and 61.8% Fibonacci retracement ratio at 0.9728. These two levels, coupled with weekly resistance seen plotted at 0.9732, will likely be viewed as reasonably strong resistance, healthy enough to withstand upside attempts and perhaps force moves back to 0.97.
Dow Jones Industrial Average:
US equities finished lower Thursday after markets digested corporate earnings and economic data – data that revealed 2.4 million Americans filed jobless claims last week, bringing the nine-week total to nearly 40 million. The Dow Jones Industrial Average dropped 101.78 points, or 0.41%; the S&P 500 erased 23.10 points, or 0.78%, and the tech-heavy Nasdaq 100 concluded lower by 107.03 points, or 1.13%.
Although dipping into lower territory yesterday, technical structure remains unchanged going into Friday’s session. Therefore, much of Thursday’s outlook will be echoed in the following piece.
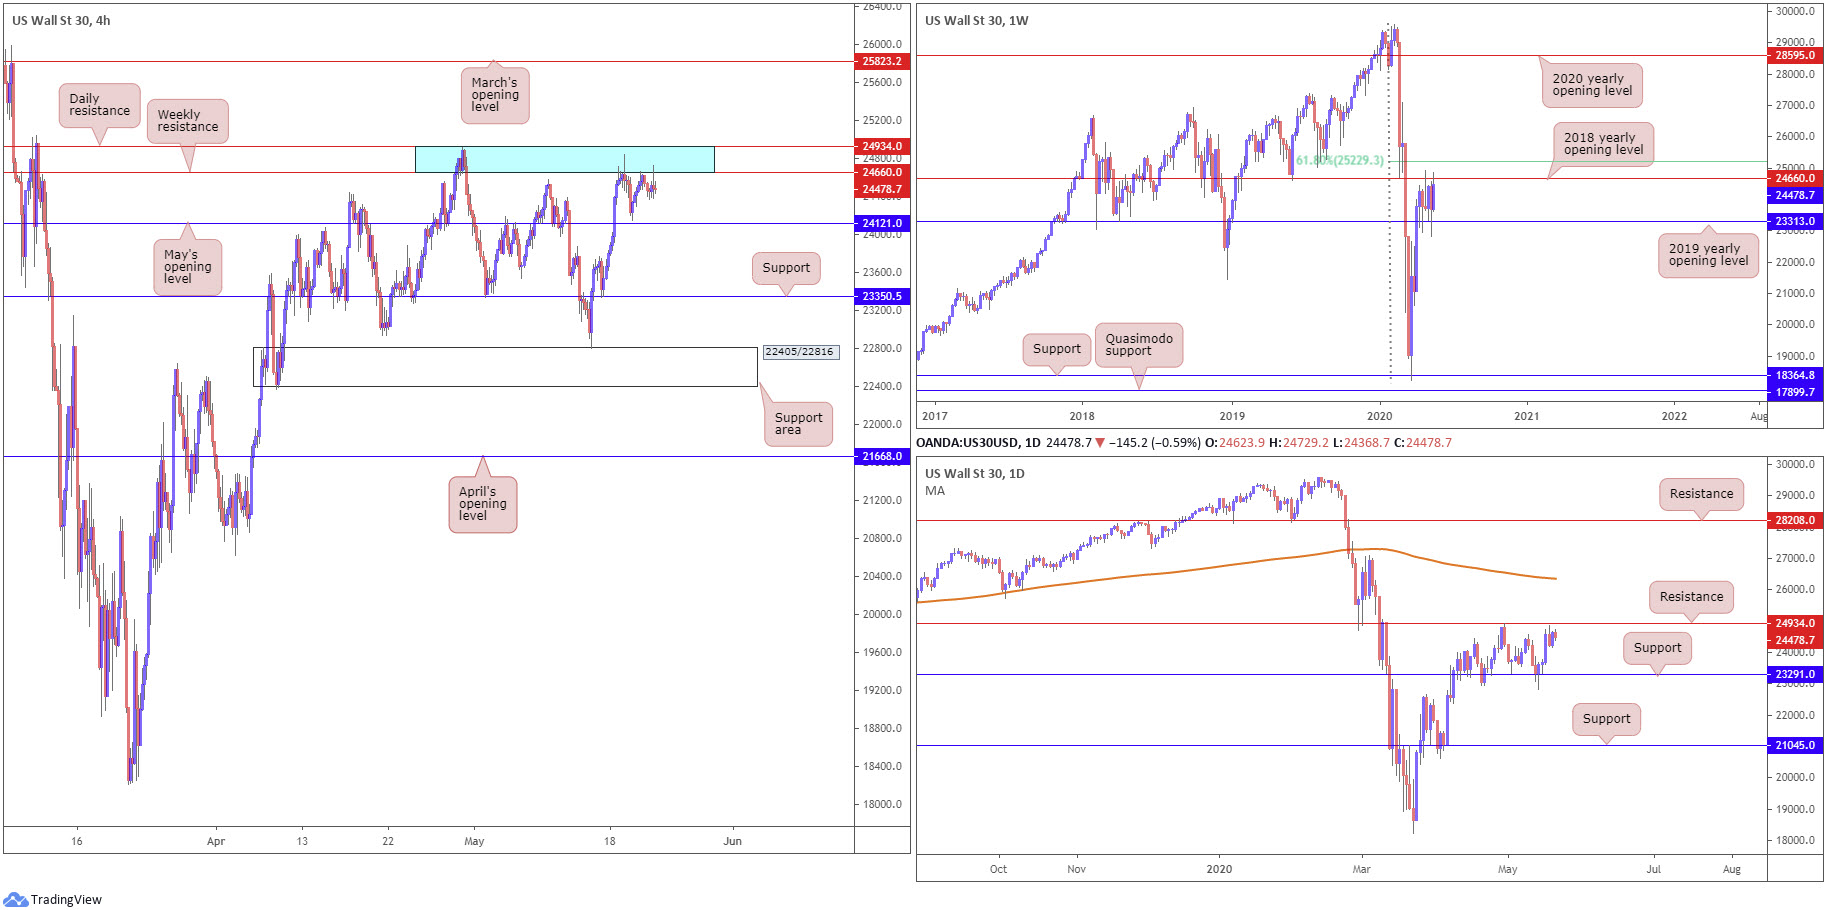
A familiar area of resistance elbowed its way into the spotlight in recent trading, a zone comprised of a daily resistance level at 24934 and weekly resistance, by way of the 2018 yearly opening level, at 24660 (blue). May’s opening level at 24121 is visible as the next downside target on the H4 timeframe, while a break above the higher-timeframe base could eventually land March’s opening level at 25823.
Since mid-April on the weekly timeframe, price has been crammed between 23313 (2019 yearly opening level) and 24660, closely shadowed by a 61.8% Fibonacci retracement ratio at 25229. A violation of 23313 shines light on support from 18364, whereas the sky above 25229 is reasonably clear back to the 2020 yearly opening level at 28595.
A similar picture is present on the daily timeframe, only resistance rests at 24934 and support at 23291. Beyond resistance we have the 200-day SMA (orange – 26348) lurking close by, whereas through support we may find another layer of support emerge at 21045.
Areas of consideration:
In light of where we’re trading from on the higher timeframes, between 24934/24660, a violation of May’s opening level at 24121 is still possible.
24934/24660, therefore, is a platform to consider shorts from today, with conservative traders likely waiting on H4 bearish candlestick confirmation. A break beneath 24121 underlines H4 support at 23350, followed by H4 support at 22405/22816.
Should buyers remain in the driving seat, nevertheless, we could see a move above 24934, rattling breakout buyers. However, do be aware, the weekly 61.8% Fibonacci retracement ratio at 25229 could hamper upside.
XAU/USD (GOLD):
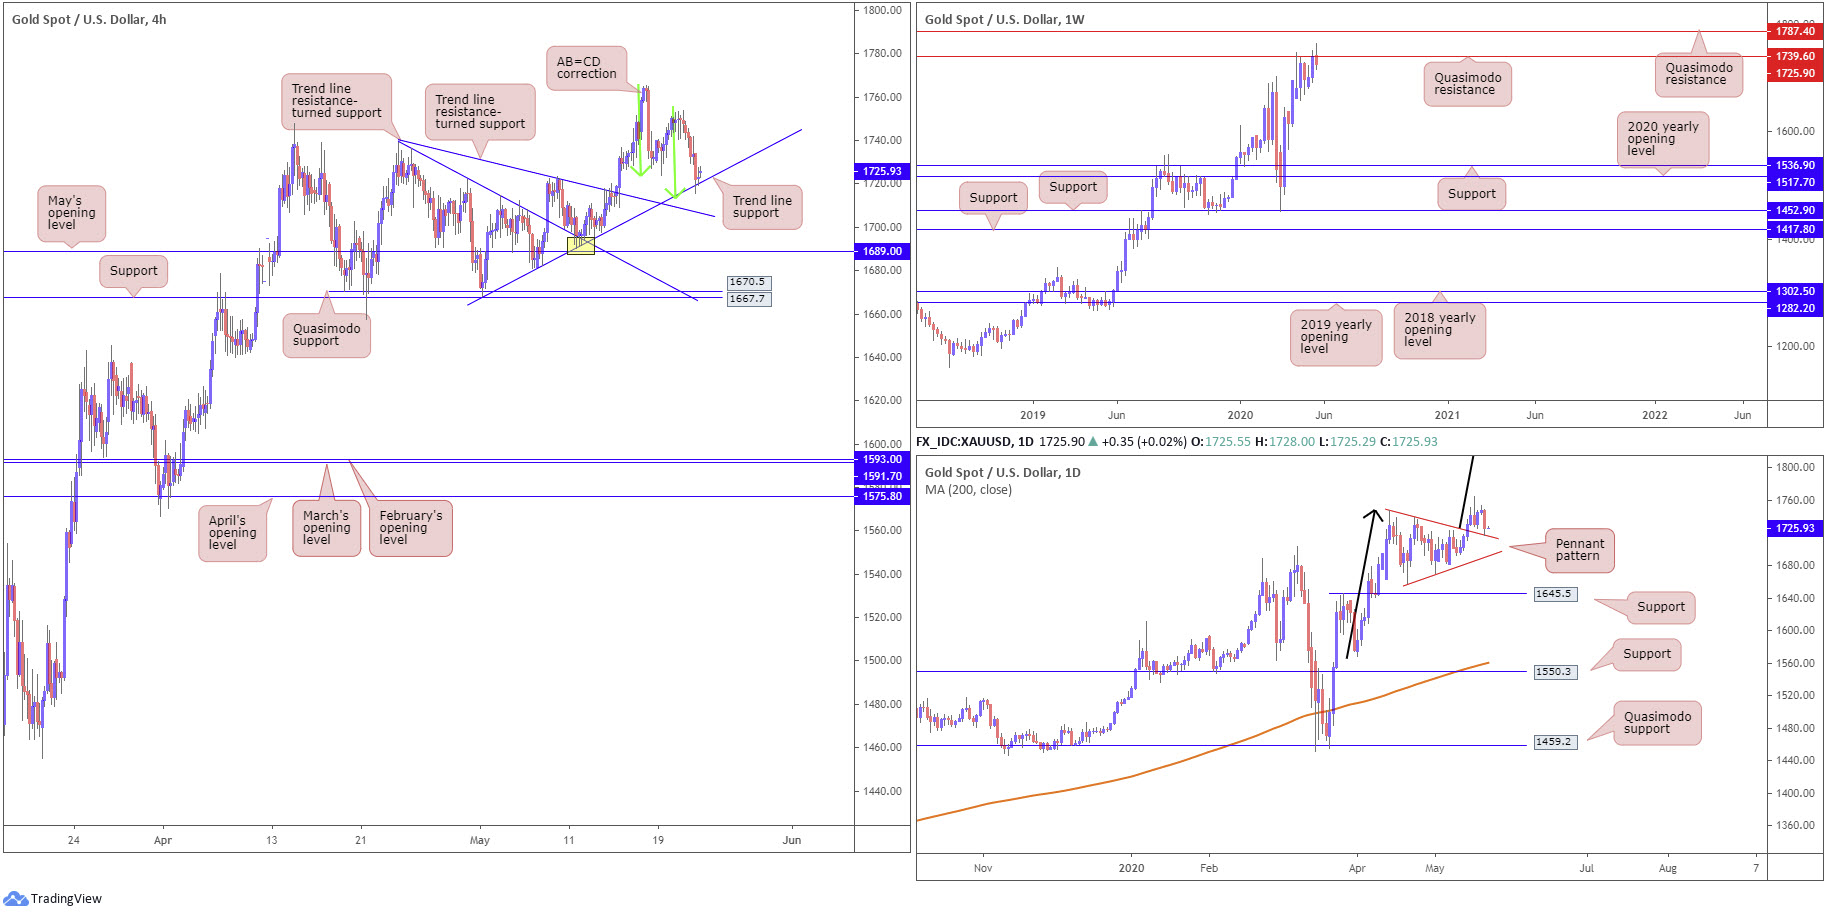
Down 1.2% against the greenback, bullion slam dunked into H4 trend line support, taken from the low 1668.0, amid a USD recovery Thursday. The recent descent also formed a D-leg to an AB=CD bullish correction (green arrows) at 1712.8. This, given the trend on gold has faced a northerly trajectory since 2016, will likely grip buyers today.
In conjunction with H4 price forming an AB=CD correction, we can also see daily price retesting the recently broken pennant resistance as support, established from a high of 1747.7. Take-profit targets out of these patterns are measured by taking the preceding move (black arrows) and adding the value to the breakout point. As you can see, this is a sizeable take-profit, coming in at 1909.4.
The picture on the weekly timeframe, nevertheless, shows price mildly fading Quasimodo resistance at 1739.6. Clearance of this level perhaps places another layer of Quasimodo resistance on the hit list at 1787.4.
Areas of consideration:
Testing trend line support, based on the H4 timeframe, in the shape of an AB=CD approach, along with daily price retesting the top edge of a bullish pennant formation, is likely enough to excite buyers, despite weekly price tackling resistance as we’re essentially with the trend here.
Traders long the H4 AB=CD configuration may have protective stop-loss orders set around 1700.8, under a trend line resistance-turned support, taken from the high 1739.1, targeting a H4 close above weekly Quasimodo resistance at 1739.6.
The accuracy, completeness and timeliness of the information contained on this site cannot be guaranteed. IC Markets does not warranty, guarantee or make any representations, or assume any liability regarding financial results based on the use of the information in the site.
News, views, opinions, recommendations and other information obtained from sources outside of www.icmarkets.com.au, used in this site are believed to be reliable, but we cannot guarantee their accuracy or completeness. All such information is subject to change at any time without notice. IC Markets assumes no responsibility for the content of any linked site.
The fact that such links may exist does not indicate approval or endorsement of any material contained on any linked site. IC Markets is not liable for any harm caused by the transmission, through accessing the services or information on this site, of a computer virus, or other computer code or programming device that might be used to access, delete, damage, disable, disrupt or otherwise impede in any manner, the operation of the site or of any user’s software, hardware, data or property.


