
Key risk events:
French Flash Services PMI; French Flash Manufacturing PMI; German Flash Manufacturing PMI; German Flash Services PMI; EUR Flash Manufacturing PMI; EUR Flash Services PMI; US Flash Manufacturing PMI; FOMC Member Brainard Speaks; UK Public Sector Net Borrowing; MPC Member Tenreyro Speaks; Canadian Core Retail Sales m/m; Canadian Retail Sales m/m.
EUR/USD:
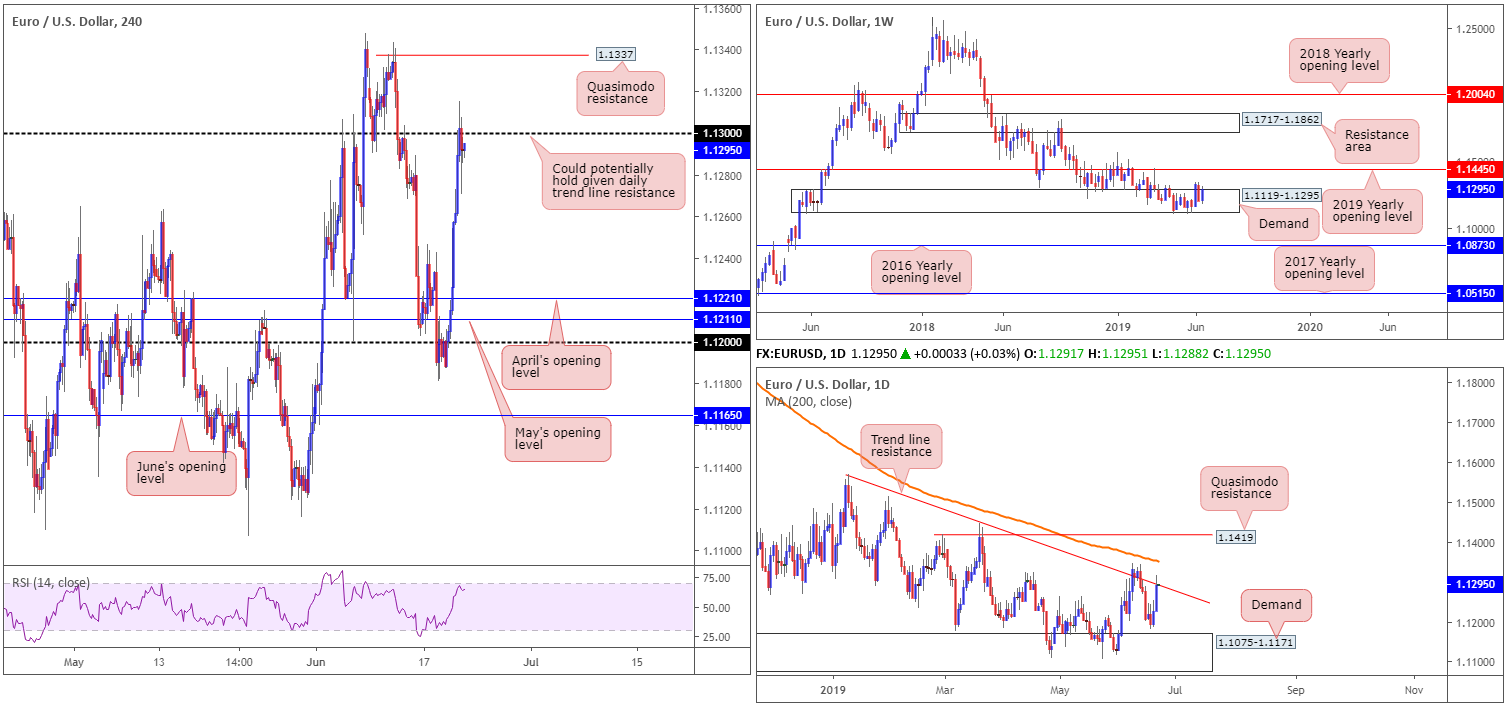
Firmly establishing ground sub 97.00, the US dollar index continued its decline Thursday as market participants digested the recent dovish FOMC. The EUR/USD peaked at 1.1317, adding 0.58% and likely tripping stop-loss orders through the 1.13 handle on the H4 timeframe. Assuming sellers are cleared here, Quasimodo resistance at 1.1337 is seen as the next upside barrier in the firing range. Should a rotation be observed, nevertheless, there’s a chance we may revisit April’s opening level plotted at 1.1221.
Bolstering the 1.13 region, as you’ll see on the daily timeframe, is a trend line resistance extended from the high 1.1569. It may also interest some traders to note the 200-day SMA is also seen just north of the trend line resistance around 1.1351.
Weekly price remains pretty much unchanged, with Thursday’s briefing having the following to say:
Weekly movement continues to occupy a long-standing demand area at 1.1119-1.1295. Traders may also wish to acknowledge the overall trend remains facing a southerly bearing since topping in early 2018, and thus places a bold question mark on the demand’s life expectancy.
Areas of consideration:
In view of the overall trend pointing south and daily price testing a notable trend line resistance, the 1.13 handle, despite yesterday’s move to 1.1317, may entice sellers into the market. H4 candlestick structure recently chalked up a Doji formation, suggesting indecision. Therefore, it might be an idea to wait and see if H4 price is able to print a bearish candlestick pattern from 1.13 before pulling the trigger (entry and risk can be determined according to the pattern’s structure).
GBP/USD:
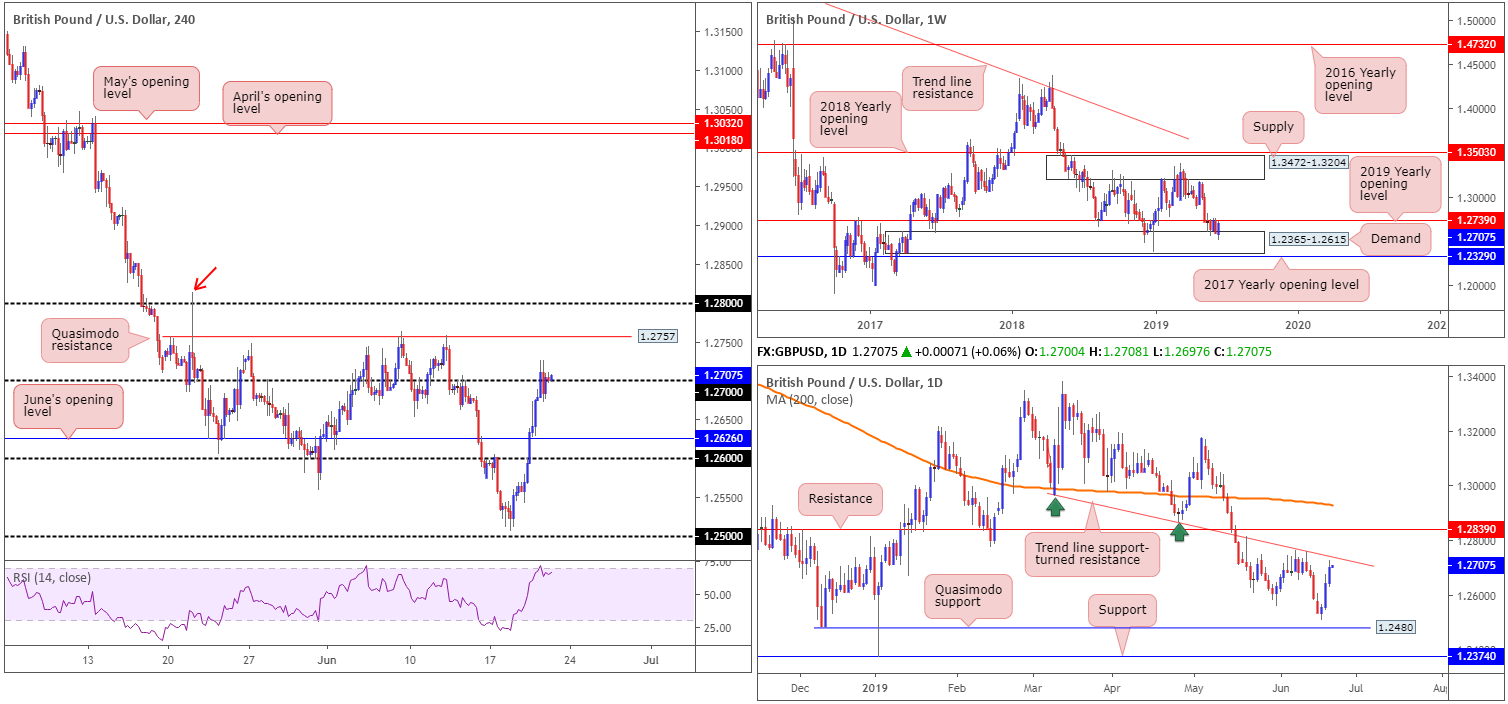
With FOMC out of the way, though still weighing on the dollar, focus shifted to the Bank of England (BoE) Thursday. The central bank maintained its hiking bias, though the minutes came across dovish, particularly when compared with recent comments from Saunders, Haldane and Carney. This weighed on sterling, pulling the unit sub 1.27 on the H4 timeframe from a session high of 1.2727.
Technically speaking, buy stops have likely been tripped above 1.27, potentially unlocking the door to a nearby Quasimodo resistance at 1.2757, and maybe even the 1.28 neighbourhood. 1.2757 is an interesting resistance, not only due to it capping upside on two occasions in June, but also because it merges closely with a daily trend line support-turned resistance (taken from the low 1.2960) and also a weekly resistance by way of the 2019 yearly opening level at 1.2739. However, traders should note weekly price is coming from notable demand priced in at 1.2365-1.2615.
Areas of consideration:
In Thursday’s briefing, the piece had the following to say:
While 1.27 may offer the market a bounce lower, traders are encouraged to include the H4 Quasimodo resistance at 1.2757 in their analysis. Not only has it held price action lower on two occasions in June, it also, as highlighted above, converges closely with higher-timeframe resistances. However, traders should also be prepared for a fakeout through this level to take shape, as the market may want to bring in additional sellers from 1.28 positioned nearby.
On account of the above the area between 1.28 and 1.2757 is of interest. Safe stop-loss placement, according to our technical studies, is beyond the 1.2813 May 21 high (red arrow), with the initial downside target placed at 1.27.
AUD/USD:
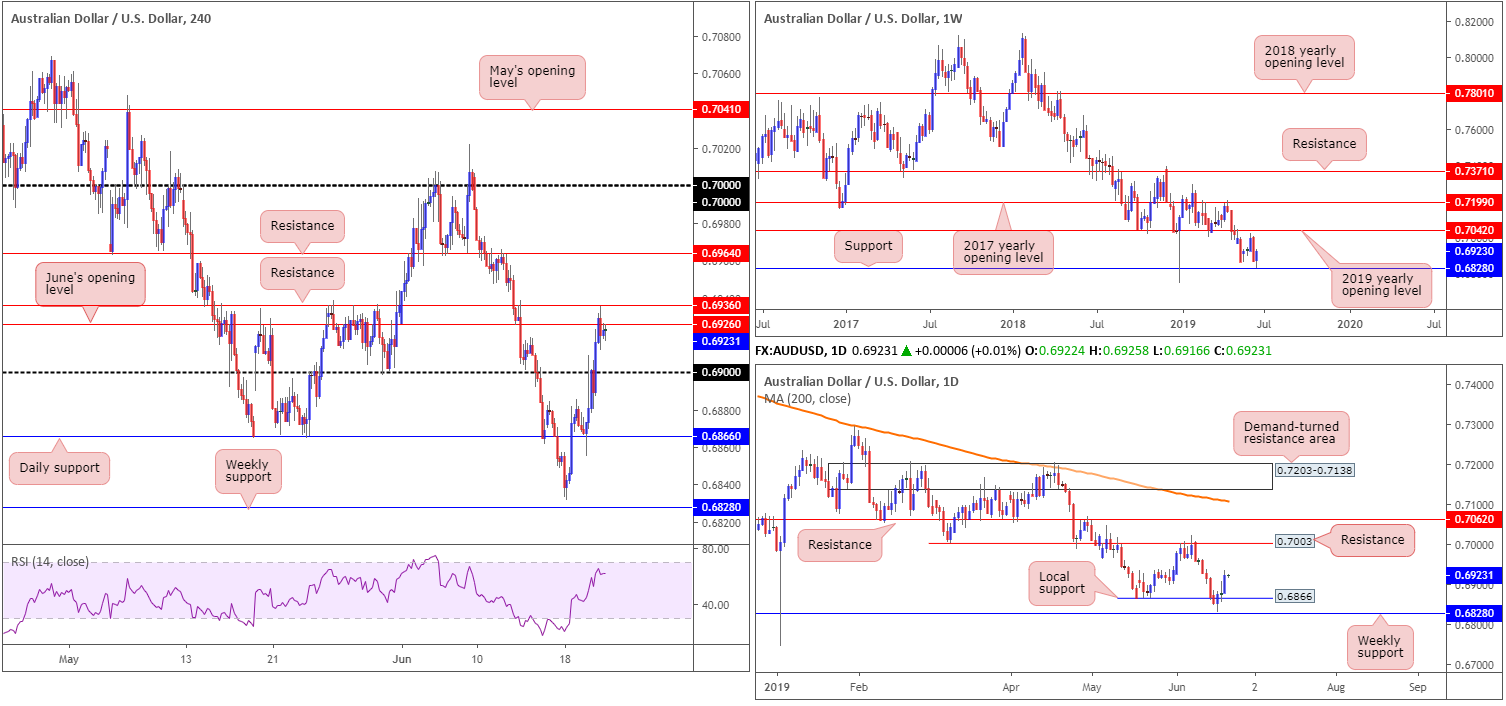
After retesting daily support priced in at 0.6866 by way of a H4 hammer formation, the Australian dollar continued to extend gains against its US counterpart Thursday.
Advancing north, largely on the dollar’s demise and improved optimism for a US/China trade deal, the AUD/USD’s H4 candles overthrew the 0.69 handle and tested resistance at 0.6936 to the point. Note we also have June’s opening level still in motion at 0.6926 as well.
In regard to the higher timeframes, Thursday’s piece highlighted the following:
In terms of where we stand on the higher timeframes, weekly price continues to hover north of support at 0.6828, with a possible run towards the 2019 yearly opening level in view at 0.7042. Similarly, on the daily timeframe, the pair exhibits scope to press as far north as resistance at 0.7003.
Areas of consideration:
Having seen higher-timeframe support recently enter the mix, and the next upside objective on the bigger picture not entering the fray until at least 0.7003, H4 resistance at 0.6936 may be fragile, potentially setting the stage for a run towards another layer of resistance at 0.6964, or maybe even the key figure 0.70.
In light of the above reading, instead of looking to fade the current H4 resistance, the research team feels a break above this barrier may be in store. A H4 close higher, followed up with a retest, offers traders the chance to buy this market, ultimately targeting 0.70 (entry and risk can be structured according to the rejection candle’s parameters).
USD/JPY:
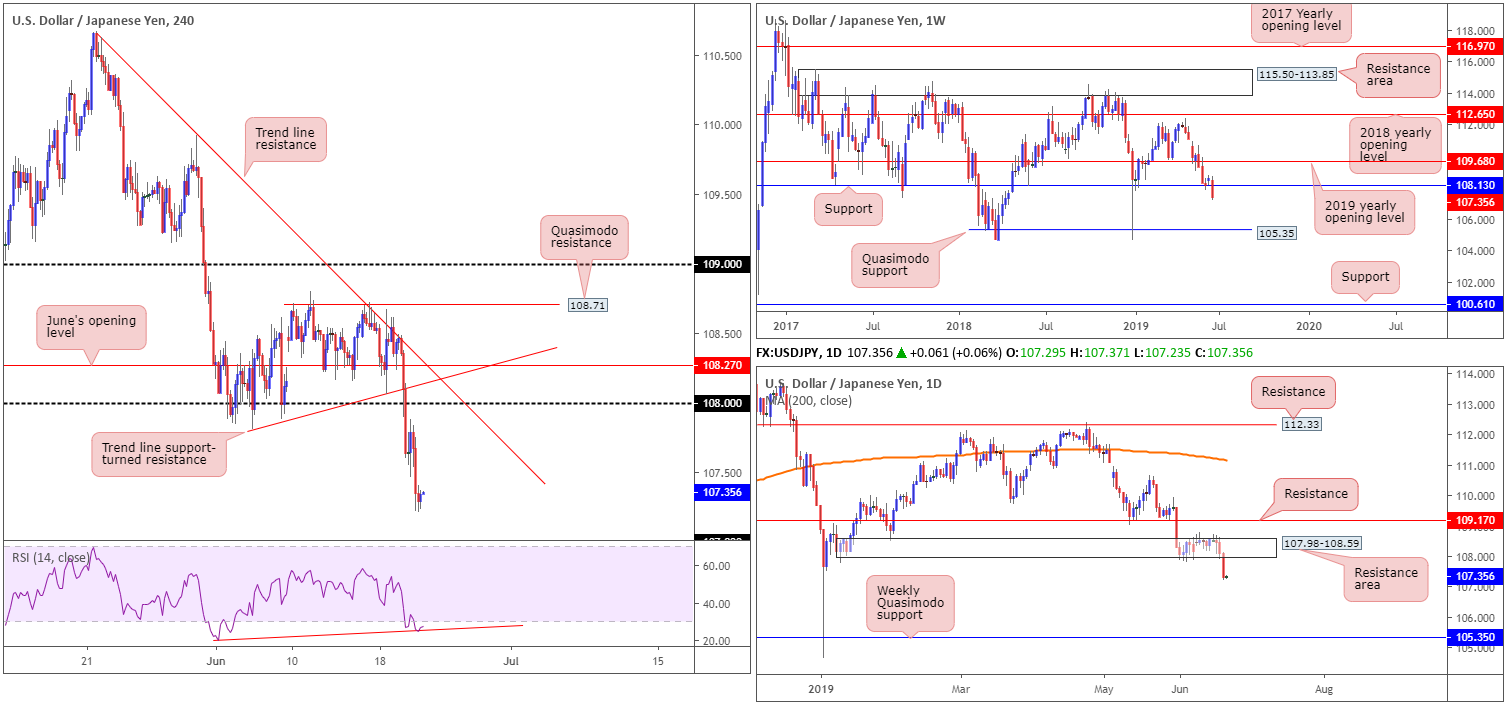
The USD/JPY was largely unaffected by the BoJ Thursday who opted to stand pat, and traded much more as a function of the weakening dollar and global risk appetite. Down 0.74%, the pair dethroned the 108 handle and now appears poised to test 107 (not visible on the H4 chart’s screen). Indicator-based traders may also wish to note the RSI is testing oversold territory and producing positive divergence (red line).
A broader perspective has the current weekly candle testing deep waters beneath support at 108.13, with the next downside target not expected to emerge until shaking hands with a Quasimodo formation at 105.35. A closer reading on the daily timeframe witnessed the unit sink a long-suffering demand at 107.98-108.59 yesterday in the shape of a near-full-bodied bearish candle. Similar to the weekly timeframe, the research team sees limited support until connecting with weekly Quasimodo support at 105.35.
Areas of consideration:
Although the technical picture portends a downside bias this morning that’ll likely bring in 107 buyers on the H4 timeframe, limited resistance is in view to take advantage of this potential move. An ideal scenario would be for the H4 candles to pullback to the 108 region, which happens to align with the lower edge of the recently engulfed daily demand at 107.98 and a H4 trend line resistance extended from the high 110.67. From here, traders have the opportunity to consider selling, with the first downside target likely best set at any demand formed on the approach. However, do keep in mind both the weekly and daily timeframes show room to press as far south as the weekly Quasimodo support at 105.35.
USD/CAD:
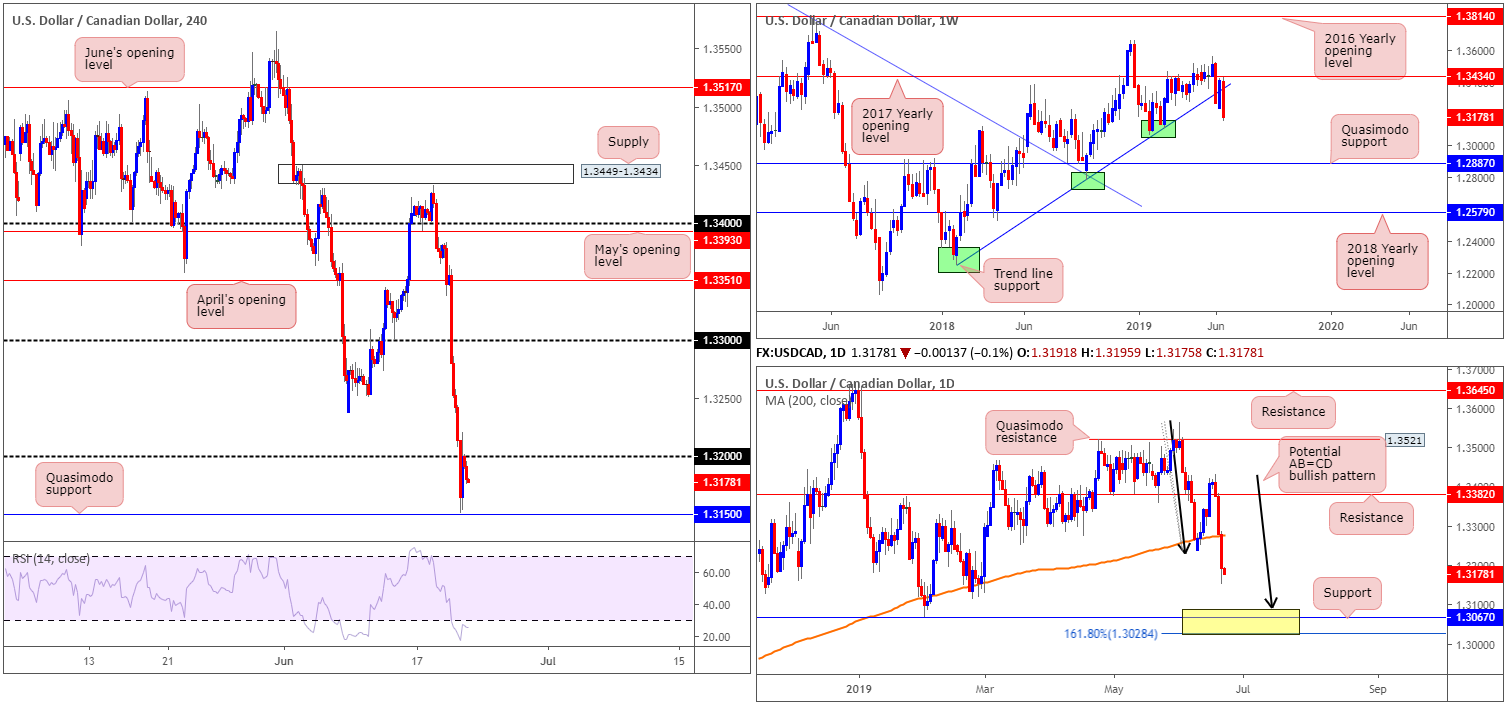
Bolstered by rising WTI prices – closed above $57/bbl – and a waning dollar as market participants digested the recent dovish FOMC, the USD/CAD lost more than 0.66% and registered its third consecutive daily loss. The USD/CAD steadied just north of a H4 Quasimodo support at 1.3150 and is now retesting the underside of 1.32, which, as of writing, is holding firm.
Thursday’s briefing had the following to write about the weekly timeframe:
Since recently coming within two points of the 2017 yearly opening level at 1.3434 (resistance), the pair reclaimed trend line support (extended from the low 1.2247) and is on track to push for lower ground.
A closer reading of price action on the daily timeframe recently observed a definitive close beneath the 200-day SMA and opened the door for a possible run to a support area fixed between 1.3028/1.3089 (yellow). Comprised of an AB=CD (black arrows) formation at 1.3089, a support at 1.3067 and a 161.8% Fibonacci extension at 1.3028 (forms part of the AB=CD structure), this area likely has enough confluence to hold price.
Areas of consideration:
The reaction at the underside of 1.32 on the H4 timeframe is, according to our reading on the higher timeframes, expected to hold and run an approach to the H4 Quasimodo support at 1.3150. On the whole, though, the research team expects 1.3150 to give way, allowing a move to develop towards 1.31 (not visible on the H4 chart), which sits just north of the daily support area mentioned above at 1.3028/1.3089.
In essence then, shorts appear worthwhile until 1.31 and longs are worthy of consideration within the current daily support area, positioned just beneath this psychological band.
USD/CHF:
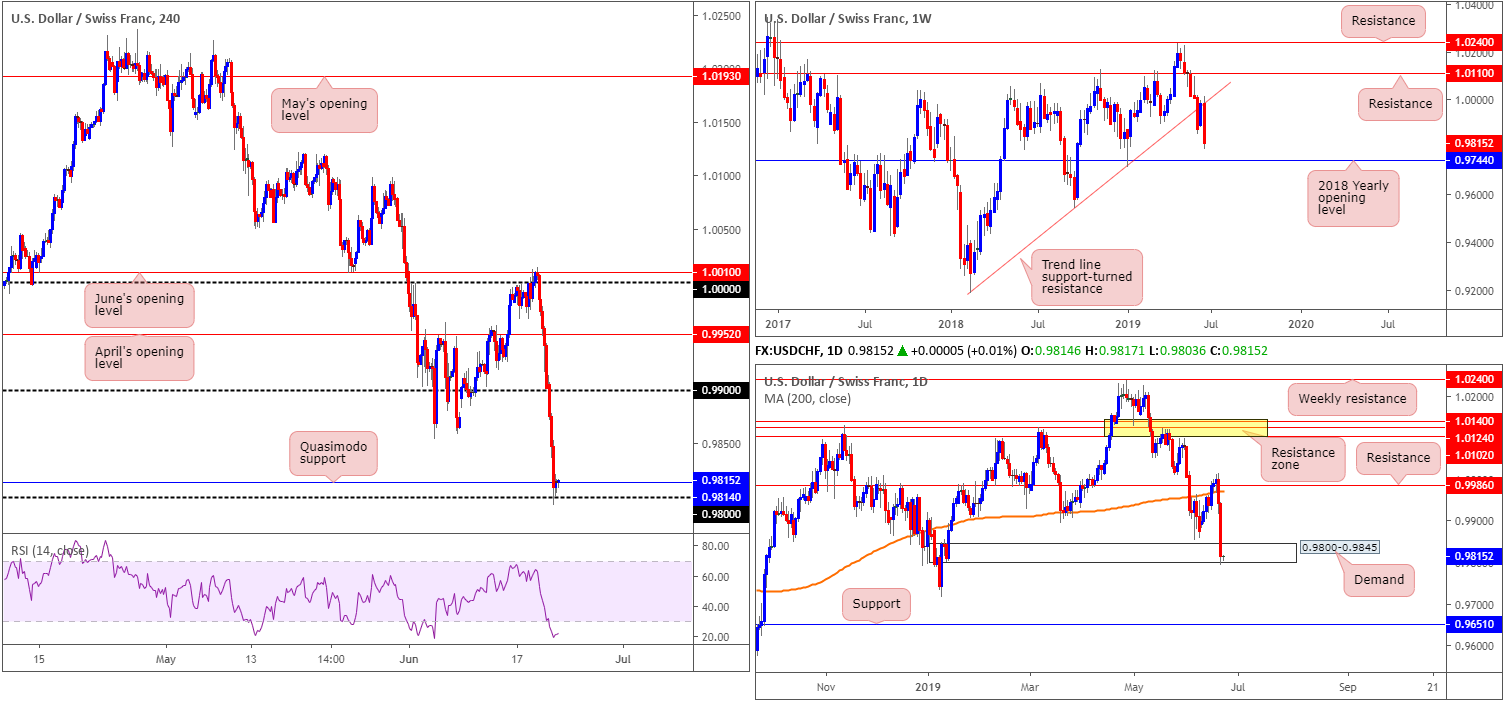
The safe-haven Swiss franc rose sharply across the board Thursday, strengthening in wake of the latest FOMC meeting. the Fed left rates unchanged between 2.25-2.50%, as expected, though did tweak the language in its statement to reflect a more dovish stance.
Although declining more than 1.20% yesterday, the USD/CHF pair mildly pared losses off the 0.98 handle (H4) into the close, with the help of a Quasimodo support at 0.9814. Beneath 0.98, the research team notes limited support until connecting with the 2018 yearly opening level plotted on the weekly timeframe at 0.9744. As you can see, 0.9744 is a notable support, and therefore is likely to hold price should we dip this far south.
The technical structure on the daily timeframe displays demand at 0.9800-0.9845, which came under pressure yesterday and had its lower edge clipped. Though not ideal for buyers of this zone, the move beneath its base was unlikely enough to trip a large portion of stop-loss orders.
Areas of consideration:
Given weekly action suggests room to move towards the 2018 yearly opening level at 0.9744, and daily price emphasising a fragile tone within demand at 0.9800-0.9845, the 0.99 handle on the H4 timeframe is perhaps in trouble.
For that reason, instead of looking to fade the psychological barrier, traders may want to consider selling beneath it. A H4 close below 0.99 allows traders to either sell the breakout candle and place the protective stop-loss order above its upper shadow, or simply wait and see if a retest at 0.99 develops and enter on the back of the rejection candle’s structure.
Beyond 0.99, as highlighted above, traders’ crosshairs are likely fixed on the 2018 yearly opening level at 0.9744 as the initial downside target.
Dow Jones Industrial Average:
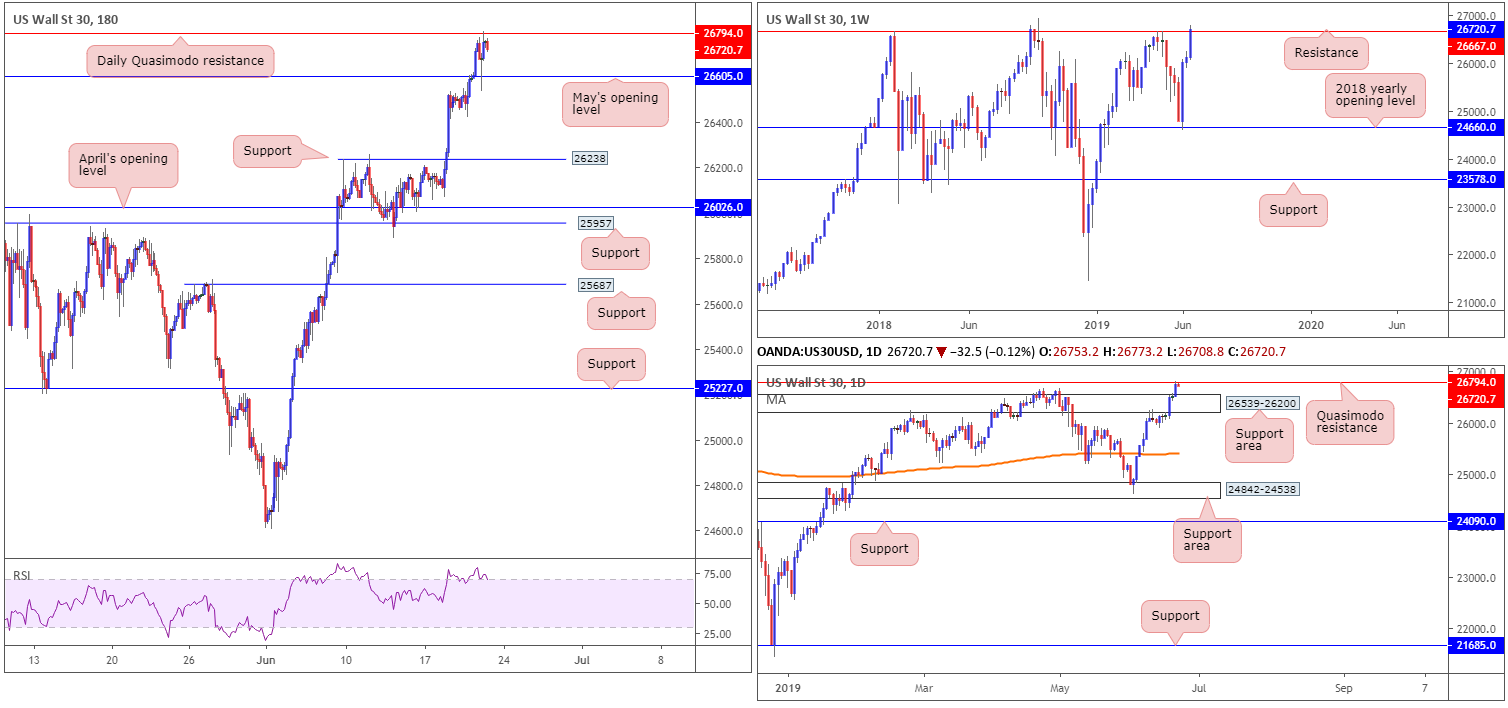
The Dow Jones Industrial Average advanced into the market close and the S&P 500 set a new closing record Thursday, one day after the Federal Reserve indicated it could cut interest rates soon. The Dow rose 0.94%, while the S&P 500 gained 0.95%. The Nasdaq 100 also added 0.92%.
The technical side of things reveals the DJIA is fast approaching the all-time high at 26939, after recently dethroning weekly resistance at 26667. The last defence, according to our technical studies, can be seen in the form of a daily Quasimodo resistance level coming in at 26794, following an engulf of a resistance area (now acting support) at 26539-26200.
H4 movement, similar to the daily timeframe, is seen testing the aforementioned daily Quasimodo resistance level after retesting May’s opening level at 26605.
Areas of consideration:
With H4 price in the process of chalking up a bearish engulfing candle, follow-through selling may emerge towards at least May’s opening level at 26605 today, followed closely by the top edge of a daily support area at 26539. Conservative stop-loss placement is likely best set above yesterday’s high 26803, with entry taking shape at the close of the H4 bearish engulfing candle.
XAU/USD (GOLD):
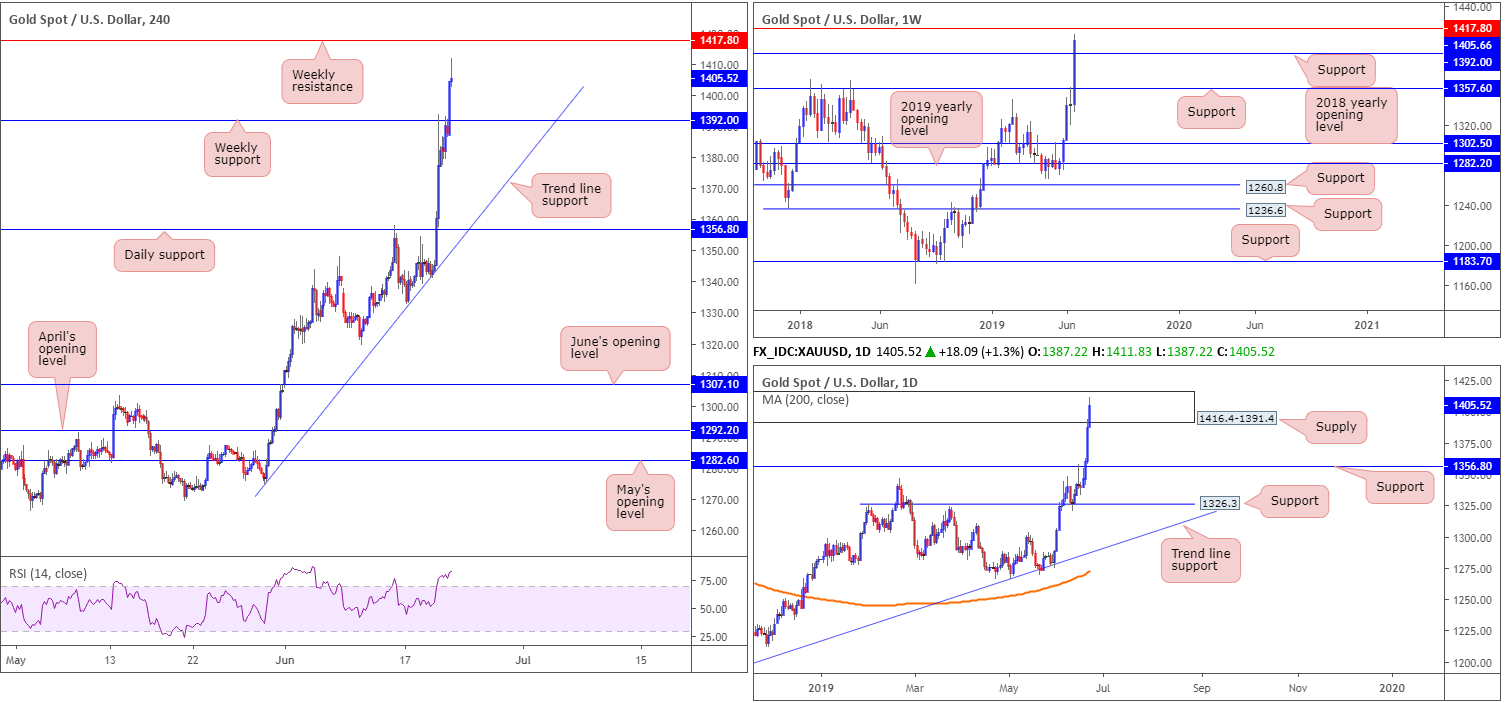
As we head into Asia Pac hours, the price of bullion is up nearly 5.00% vs. the dollar. Strengthening in wake of the latest FOMC meeting and US dollar index declining sub 97.00, the weekly timeframe shows price action is now within striking distance of resistance at 1417.8, after engulfing resistance at 1392.0 (now acting support).
Interestingly, the weekly resistance mentioned above at 1417.8 is positioned just north of a daily supply zone at 1416.4-1391.4, which, as you can see, is in play. A rotation south from this area has support coming in at 1356.8 to target.
Areas of consideration:
In the event we test weekly support at 1392.0 today and produce a H4 bullish candlestick configuration, a long from this base may be worth considering, targeting weekly resistance at 1417.8 (entry and risk can be adjusted according to the bullish candlestick’s structure).
The accuracy, completeness and timeliness of the information contained on this site cannot be guaranteed. IC Markets does not warranty, guarantee or make any representations, or assume any liability with regard to financial results based on the use of the information in the site.
News, views, opinions, recommendations and other information obtained from sources outside of www.icmarkets.com.au, used in this site are believed to be reliable, but we cannot guarantee their accuracy or completeness. All such information is subject to change at any time without notice. IC Markets assumes no responsibility for the content of any linked site. The fact that such links may exist does not indicate approval or endorsement of any material contained on any linked site.
IC Markets is not liable for any harm caused by the transmission, through accessing the services or information on this site, of a computer virus, or other computer code or programming device that might be used to access, delete, damage, disable, disrupt or otherwise impede in any manner, the operation of the site or of any user’s software, hardware, data or property.


