
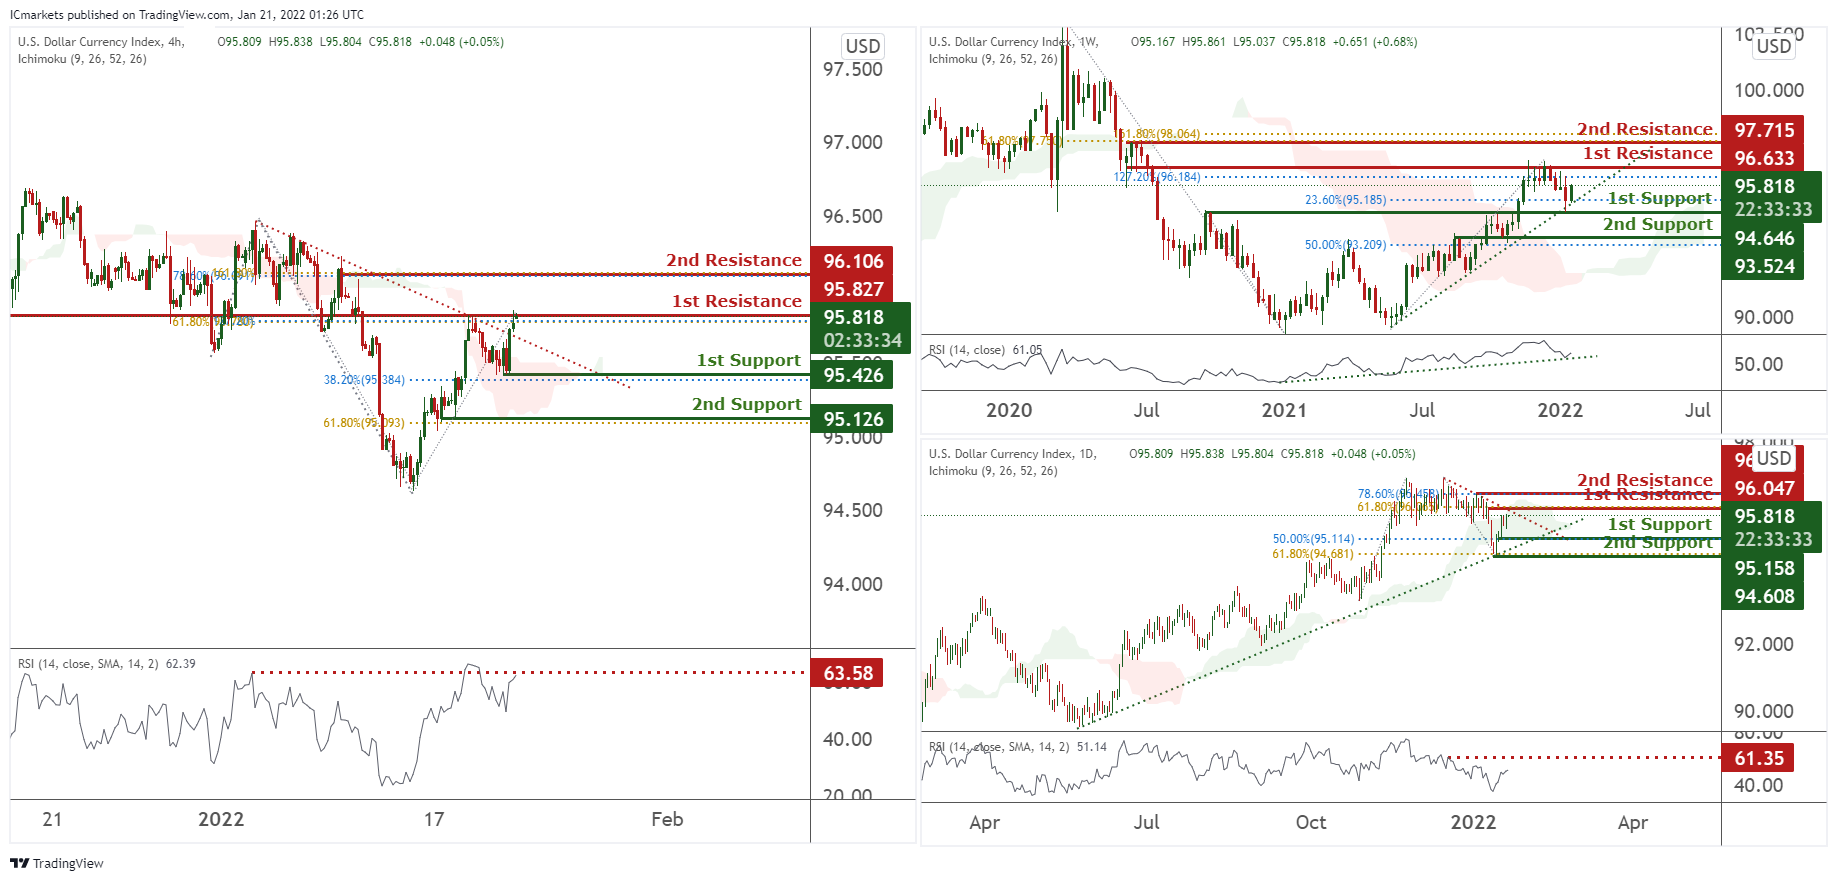
DXY:
On the weekly, prices have recently broken out of our descending trendline. We are expecting prices to dip from our 1st resistance at 95.818 in line with 61.8% Fibonacci extension and 50% Fibonacci retracement towards our 1st support at 95.426 in line with 38.2% Fibonacci retracement. RSI is at a level where dips previously occurred.
On the daily, prices are consolidating in a triangle pattern. We see potential for prices for a drop from our 1st resistance at 95.818 in line with 61.8% Fibonacci extension towards our 1st support at 95.158 in line with 50% Fibonacci retracement. Our bearish bias is further supported by RSI being close to levels where dips occurred previously and also prices passing through our ichimoku cloud support.
On the H4 timeframe, prices are abiding to a descending trendline and are on bearish momentum. We would expect a dip from our 1st resistance at 95.818 in line with 61.8% and 78.6% Fibonacci retracement towards our 1st support at 95.426 in line with 38.2% Fibonacci retracement. RSI is at a level where dips occurred previously and also ichimoku clouds are showing further bearish momentum.
Areas of consideration:
H4 time frame, 1st resistance at 95.827
H4 time frame, 1st support at 95.426
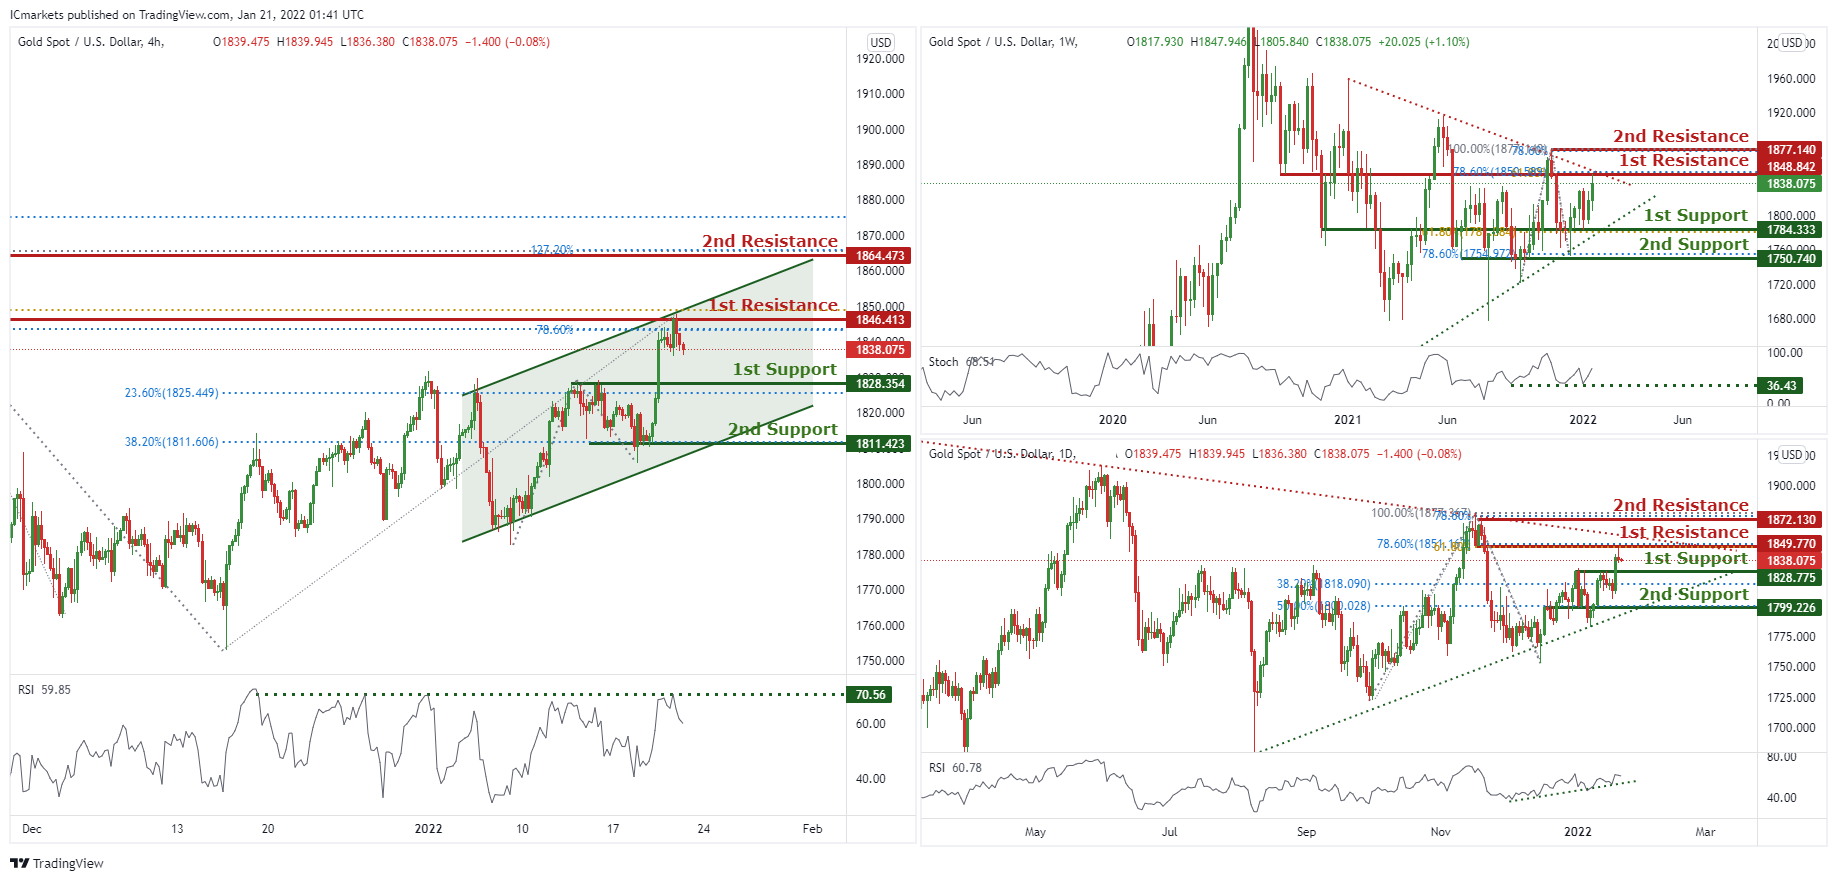
XAU/USD (GOLD):
On the weekly, prices are consolidating in a triangle and have the potential to dip from our 1st resistance at 1848.842 in line with 61.8% Fibonacci extension and 78.6% Fibonacci retracement towards our 1st support at 1784.333 in line with 61.8% Fibonacci retracement. RSI are at levels where dips previously occurred.
On the daily, prices are consolidating in a triangle. We see potential for further bullish continuation from 1st support at 1828.775 in line with 38.2% Fibonacci retracement towards our 1st resistance at 1849.77 in line with 61.8% Fibonacci extension and 78.6% Fibonacci retracement. Our bias is further supported by the RSI at a level where bounces previously occurred.
On the H4 chart, prices are consolidating in a parallel channel. We see potential for prices to dip from our 1st support at 1828.354 in line with the area of Fibonacci confluences towards our 1st support at 1828.354 in line with 23.6% Fibonacci retracement. RSI is at a level where dips previously occurred. Alternatively, breaking our 1st resistance will find prices climbing further towards our 2nd resistance at 1864.473 in line with 127.2% Fibonacci extension which is our next level of strong resistance.
Areas of consideration:
4h 1st support at 1828.354
4h 1st resistance at 1811.423
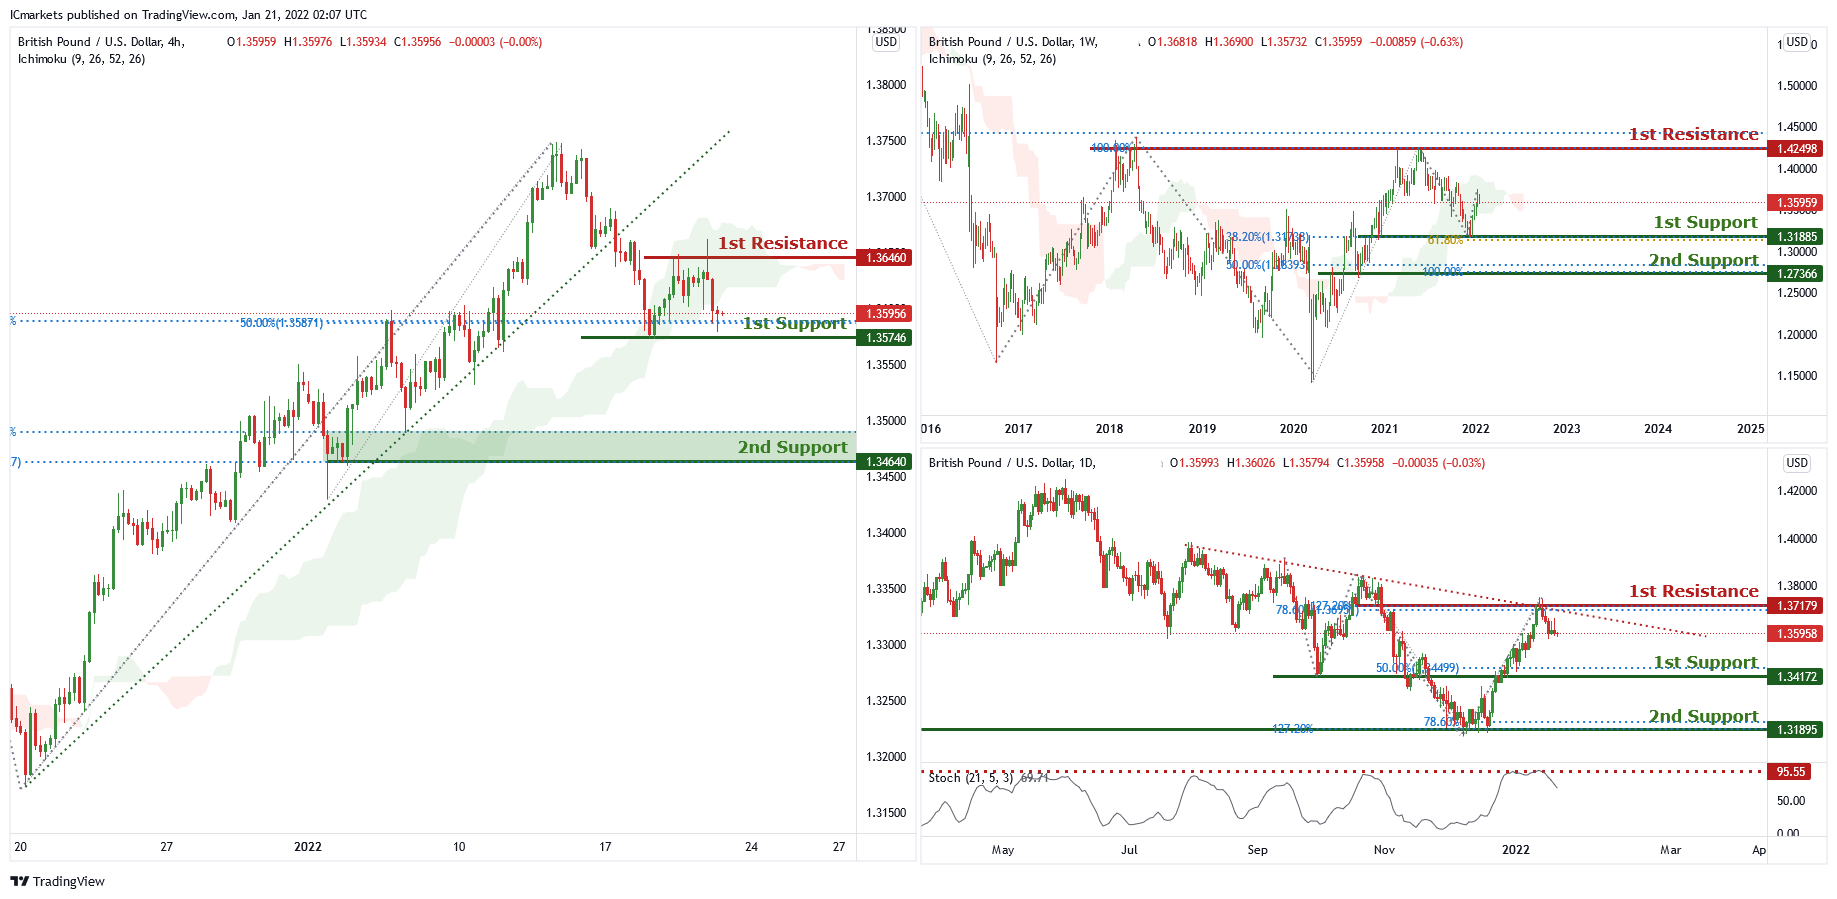
GBP/USD
On the weekly chart price in between 1st resistance of 1.42498 which is in line with 100% Fibonacci projection, 50% Fibonacci retracement and 1st support of 1.31885 which is in line with 38.2% Fibonacci retracement and 61.8% fibonacci projection. Price can potentially go to the 1st resistance level of 1.42498 which is the graphical swing high level. Our bullish bias is supported by the ichimoku cloud indicator.
On the daily chart , price is abiding by the descending trendline and near 1st resistance level of 1.37179 which is also 127.2% Fibonacci projection and 78.6% Fibonacci retracement. Price can potentially dip to the 1st support of 1.34172 which is also 50% Fibonacci retracement. Our bearish bias is supported by the stochastic indicator as it is near resistance level.
On the H4 chart, price has recently broken out of the ascending trendline and near 1st support level of 1.35746 which is also 50% Fibonacci retracement and 78.6% Fibonacci projection. Price can potentially dip to the 2nd support of 1.34640 which is 127.2% Fibonacci projection and 50% Fibonacci retracement. Our bearish bias is supported by the ichimoku cloud indicator as price is trading below it.
Areas of consideration
- 1st resistance at 1.36049
- 1st support at 1.35289
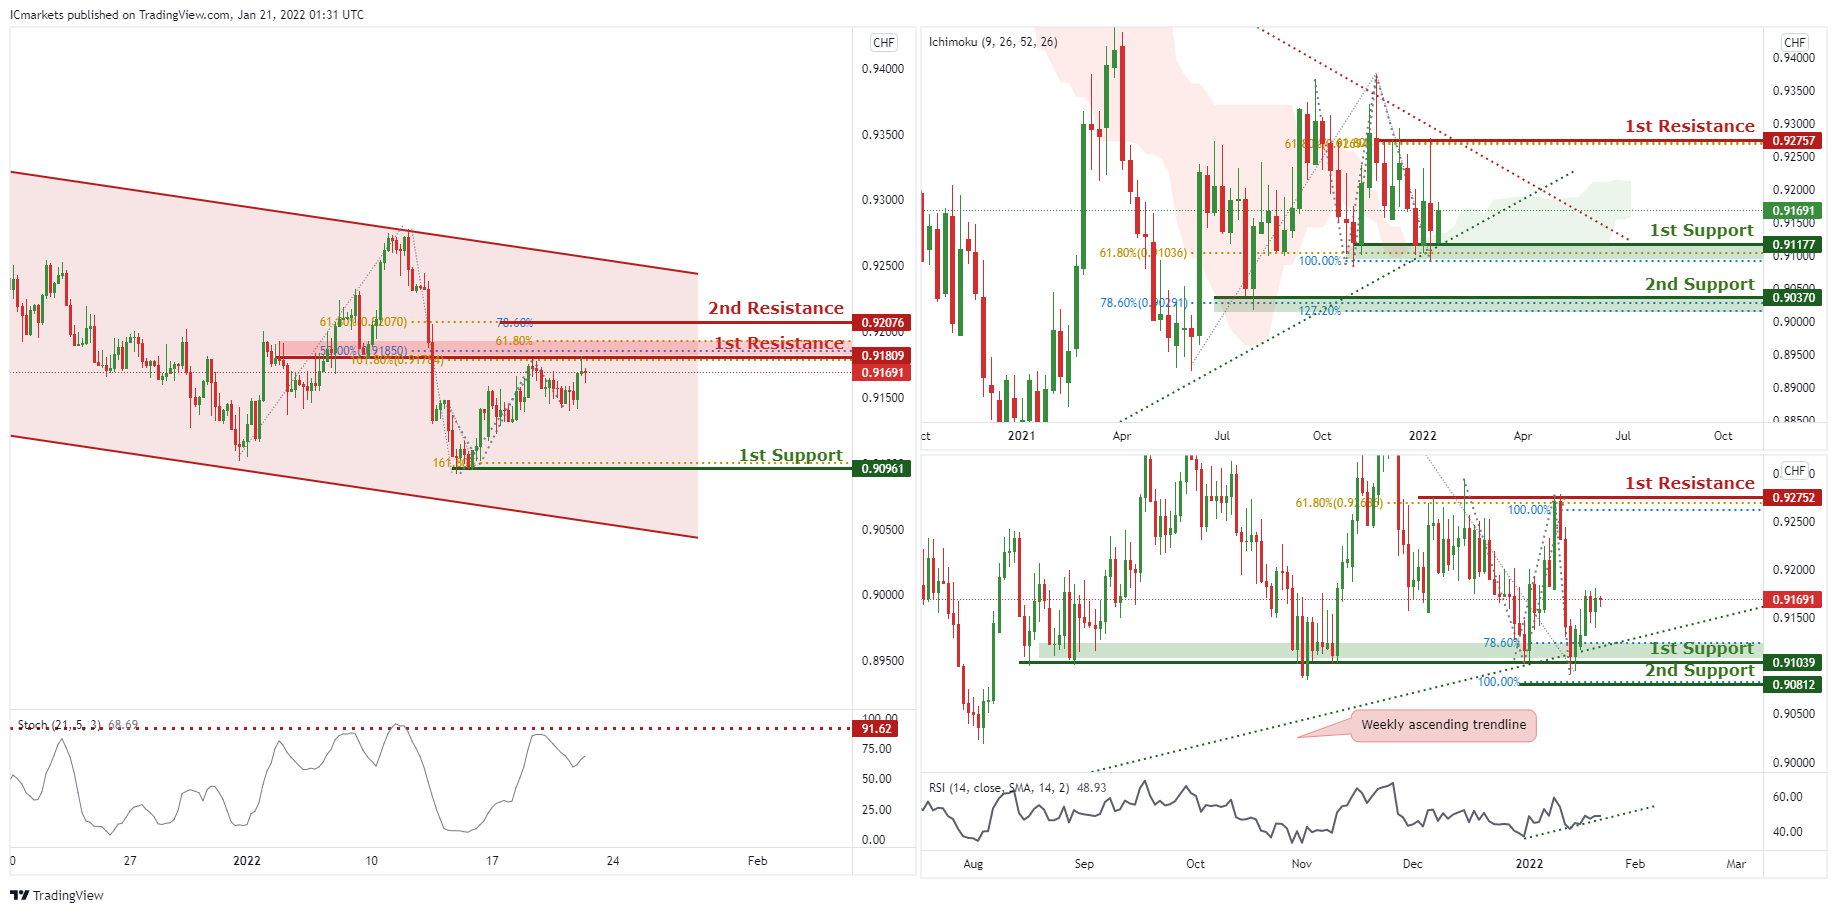
USD/CHF:
On the Weekly timeframe, price is reacting in a triangle pattern. Price is currently reacting at the 1st Support in line with ascending trendline support, 61.8% Fibonacci retracement and 100% Fibonacci projection. We can expect price to bounce from 1st Support towards 1st Resistance in line with 61.8% Fibonacci projection, 61.8% Fibonacci retracement and descending trendline resistance. On the Daily timeframe, price is abiding to the ascending trendline support on the weekly,we can expect an overall bullish momentum. Price could bounce from 1st Support in line with 78.6% Fibonacci retracement and 78.6% FIbonacci projection towards 1st Resistance in line with 61.8% Fibonacci retracement and 100% Fibonacci projection. Our bullish bias is further supported by the RSI indicator which is abiding to the ascending trendline.
On the H4 timeframe, price is abiding to a descending channel, signifying a bearish momentum. Price dropped from the 1st Resistance in line with 50% Fibonacci retracement, 161.8% Fibonacci extension and graphical overlap resistance. We can expect the price to drop to 1st Support in line with the previous swing low and 161.8% Fibonacci projection. Our bearish bias is further supported by the stochastic indicator where the %K Line dropped from the resistance level.
Areas of consideration:
- Watch 1st Support at 0.90961
- Watch 1st Resistance at 0.91809
EUR/USD :
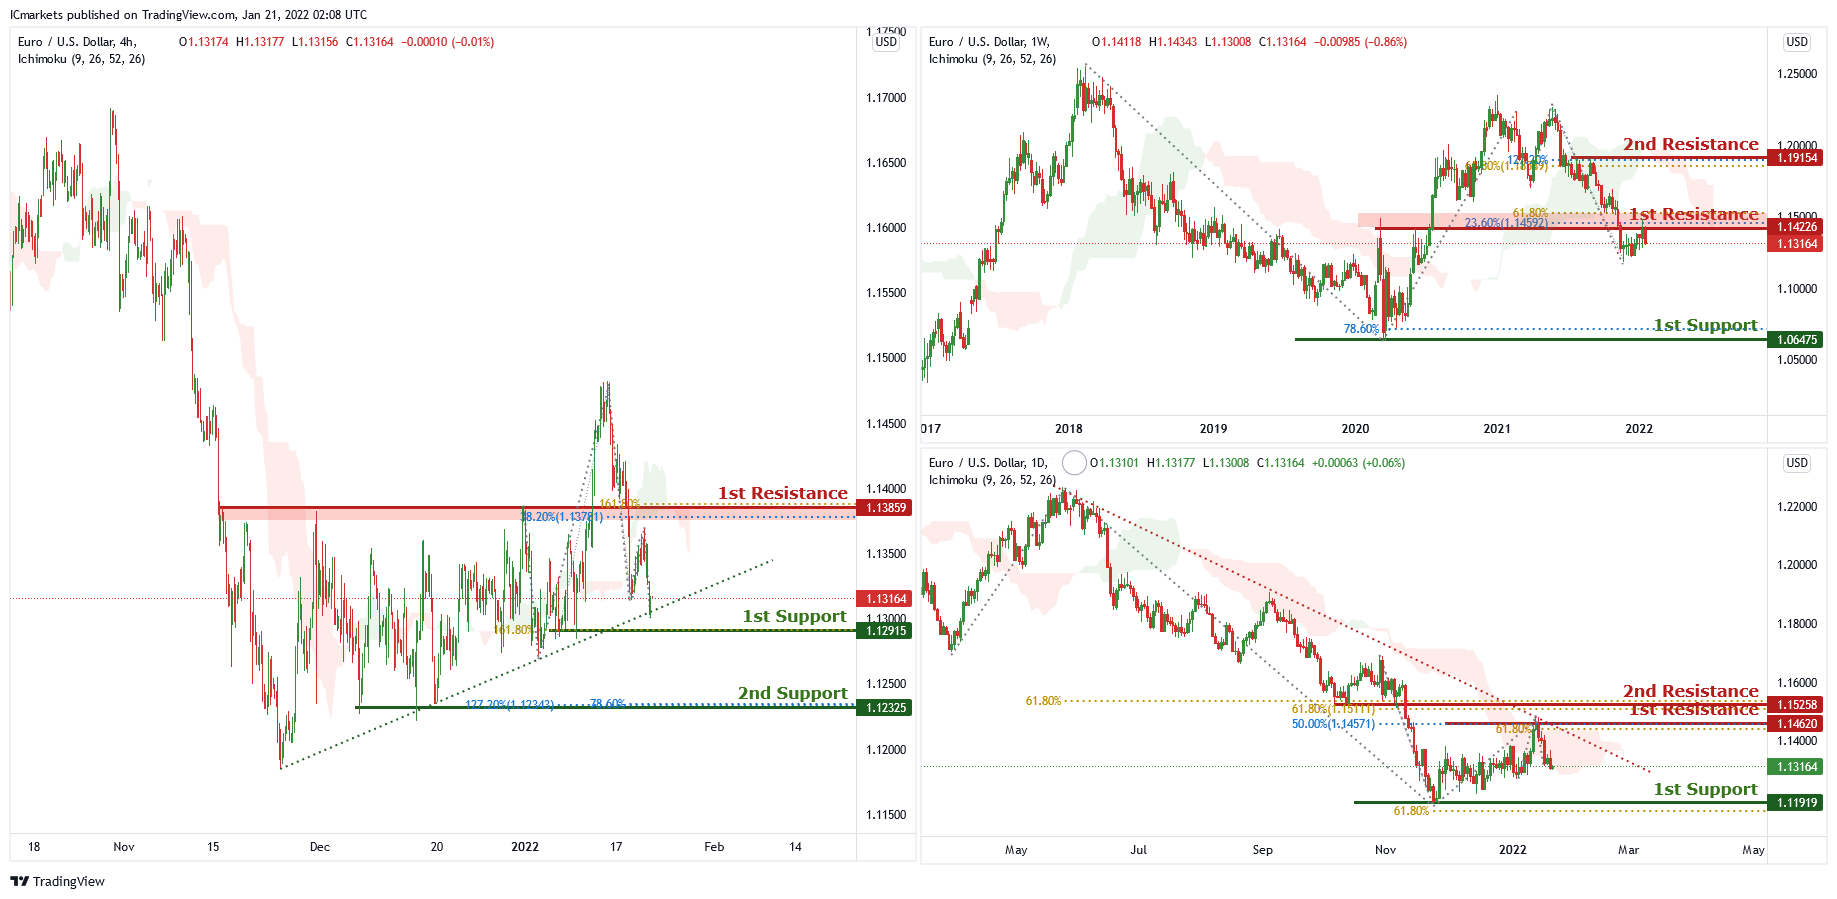
On the weekly chart, price is near the 1st resistance level of 1.14226 which is also 23.6% Fibonacci resistance and 61.8% Fibonacci projection. Price can dip to the 1st support of 1.06475 which is also 78.6% Fibonacci projection. Our bearish bias is supported by the ichimoku cloud indicator as price is trading below it.
On the daily chart, price is abiding by a descending trendline and near 1st resistance level of 50% Fibonacci retracement and 61.8% Fibonacci projection. Price can potentially dip to the 1st support level of 1.11919 which is also 61.8% Fibonacci projection. Our bearish bias is supported by the ichimoku cloud indicator as price is trading below it.
On the H4 chart , price is trading in an ascending trendline, and is near 1st support level of 1.12915 which is also 161.8% Fibonacci projection. Price can potentially go to the 1st resistance level of 1.13895 which is 161.8% Fibonacci projection and 38.2% Fibonacci retracement. Our bullish bias is supported by the stochastic indicator as it is near support level.
USD/JPY:
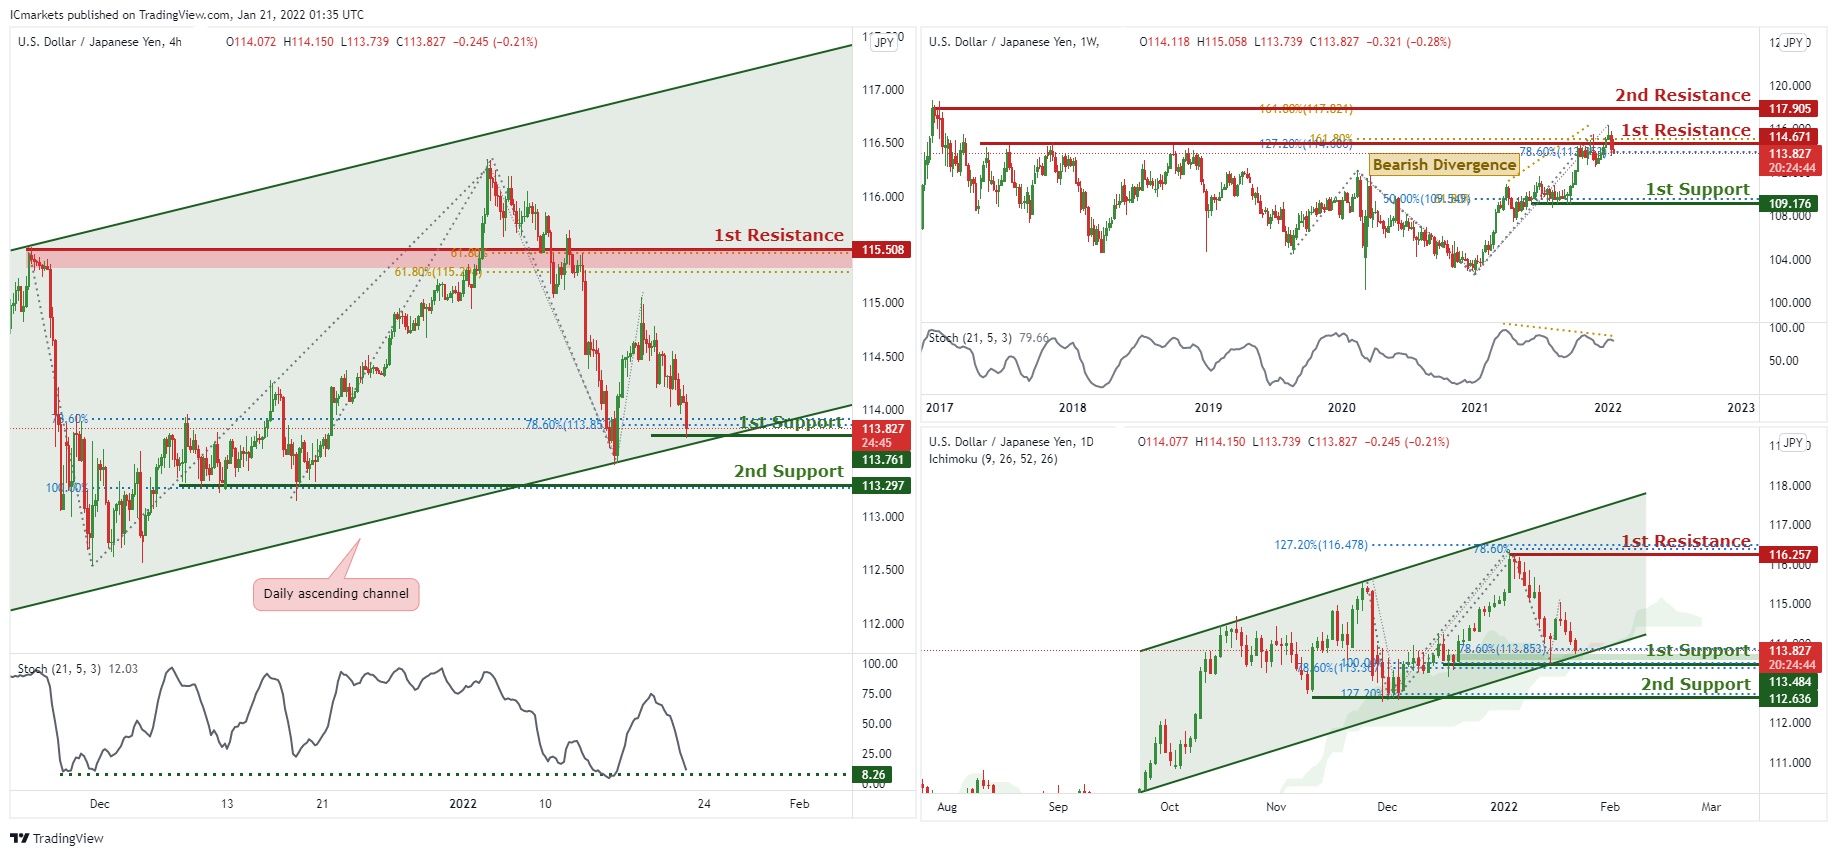
On the Weekly timeframe, we can see that price touched the 1st resistance in line with horizontal swing highs and 127.2% FIbonacci Retracement and 161.8% Fibonacci Projection. We can expect the price to drop from the 1st Resistance towards the 1st Support in line with 61.8% Fibonacci projection and 50% Fibonacci retracement. Our short-term bearish momentum is further supported by the stochastic %K line holding below the descending trendline resistance and a bearish divergence spotted. In reference to last week’s analysis, on the Daily timeframe price indeed dropped to the 1st Support. Price is now abiding to the ascending channel, we can expect price to bounce from 1st Support in line with 100% Fibonacci projection and 78.6% Fibonacci extension towards 1st Resistance in line with previous swing high, 127.2% Fibonacci expansion and 78,6% Fibonacci projection. Our bullish bias is further supported by the Ichimoku cloud acting as a support level.
On the H4 timeframe, is abiding to the ascending channel on the daily, signifying an overall bullish momentum. We can now expect price to bounce from 1st Support in line with 78.6% Fibonacci retracement and 78.6% Fibonacci projection towards 1st Resistance in line with 61.8% Fibonacci projection and 61.8% Fibonacci retracement. Our bullish bias is further supported by the stochastic indicator where the %K line is at the support level.
Areas of consideration:
- H4 1st resistance level 115.508
- H4 1st support level 113.761
AUD/USD:
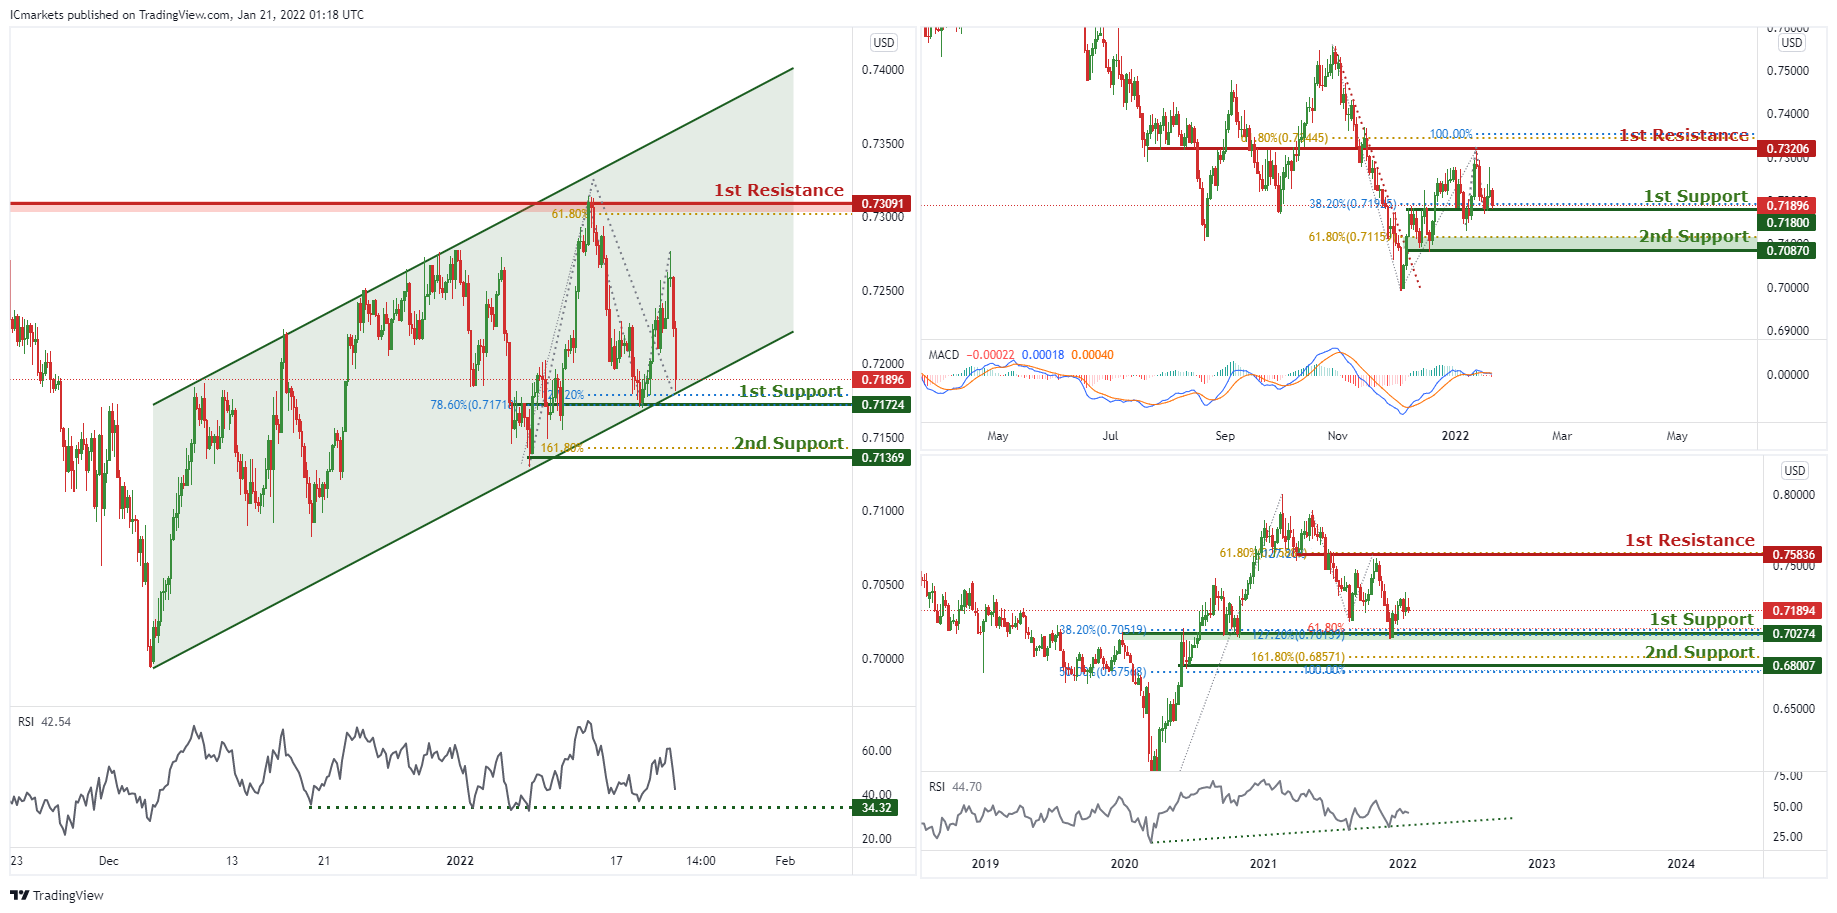
In reference to last week’s analysis, price has bounced nicely on the 1st Support. On the weekly, we can now expect the price to continue to push higher from the 1st Support in line with 61.8% Fibonacci projection, 38.2 % FIbonacci retracement and 127.2% Fibonacci extensions. Our bullish bias is further supported by the RSI indicator abiding to an ascending trendline. Traders should wait for prices to swing higher or lower before entering again. In reference to last week’s analysis price indeed bounced nicely on the 1st Support on the daily timeframe. On the Daily, the price is at the 1st support, we can expect the price to continue to push higher from 1st Support in line with 38.2% Fibonacci retracement towards 1st Resistance in line with 100% Fibonacci projection and 61.8% Fibonacci retracement. Our bullish bias is further supported by the MACD indicator where the MACD line is above the signal line.
On the H4, price is reacting within the ascending channel, signifying an overall bullish momentum. Price is approaching the 1st Support, we can expect to see price make a bullish bounce from 1st Support in line with 127.2% Fibonacci projection, 78.6% Fibonacci retracement and ascending channel support towards 1st Resistance in line with previous swing high and 61.8% Fibonacci projection. Our short-term bearish bias is further supported by the RSI indicator where it is approaching the support level.
Areas of consideration:
- H4 1st Support level 0.71724
- H4 1st resistance level 0.73091
NZD/USD:
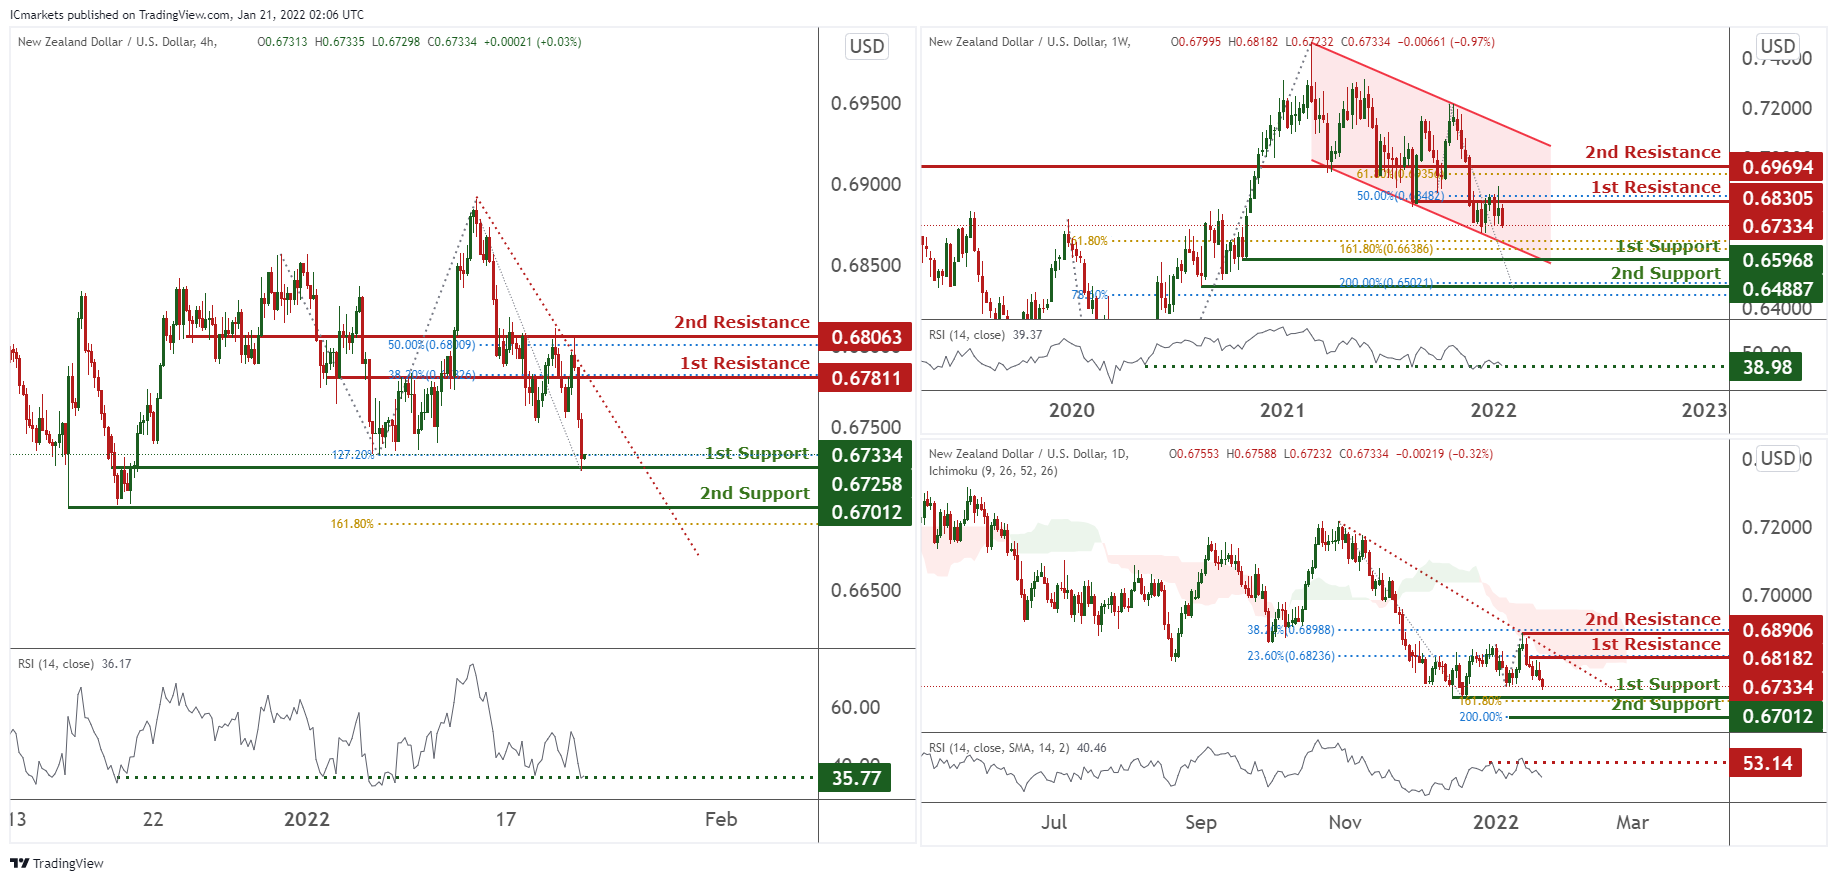
On the weekly, prices are on bearish momentum and abiding to our bearish channel. We see the potential for a dip from our 1st resistance at 0.68305 in line with 50% Fibonacci retracement towards our 1st support at 0.65968 which is an area of FIbonacci confluences.
On the daily, prices are on bearish momentum and abiding to a bearish trendline. We see the potential for further bearish continuation towards our 1st support at 0.67362 in line with 161.8% Fibonacci projection. RSI is at a level where dips occurred previously and prices are trading below our ichimoku clouds further supporting our bearish view.
On the H4, prices are on bearish momentum and abiding to a bearish trendline. We see the potential for a bounce from our 1st support at 0.67258 in line with 127.2% Fibonacci extension towards our 1st resistance at 0.67811. RSI is at a level where bounces occurred previously.
Areas of consideration:
- H4 time frame, 1st resistance at 0.67811
- H4 time frame, 1st support at 0.67258
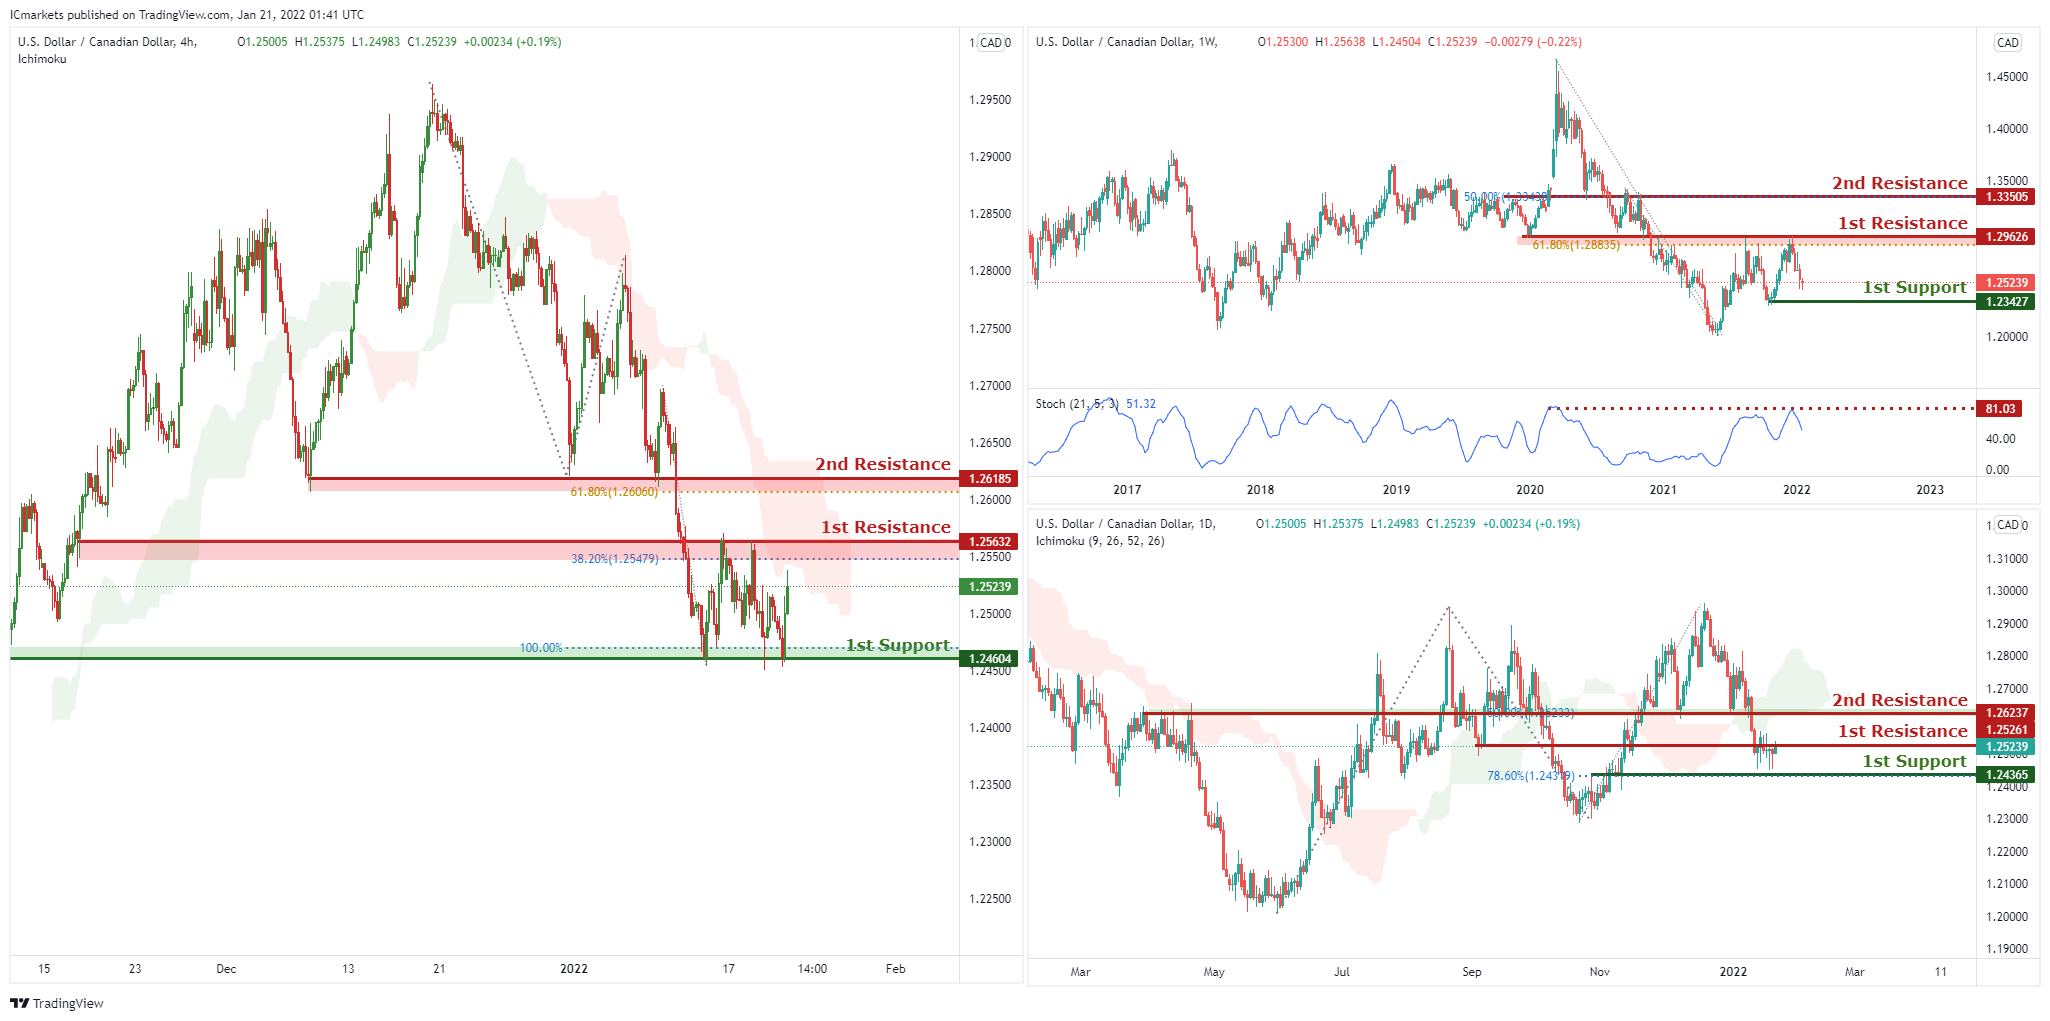
USD/CAD:
On the weekly, with price respecting the stochastics resistance, we have a bearish bias that price will from from our 1st resistance at 1.29626 which is in line with horizontal overlap resistance and 61.8% Fibonacci retracement to 1st support at 1.23427, which is in line with horizontal overlap support. Alternatively, price may break 1st resistance structure and head for 2nd resistance at 1.33505, which coincides with horizontal overlap resistance and 50% Fibonacci retracement.
On the daily, with price moving below the ichimoku cloud, we have a bearish bias that price will from from our 1st resistance at 1.25261 which is in line with horizontal overlap resistance to 1st support at 1.24365, which is in line with horizontal overlap support and 78.6% Fibonacci retracement level. Alternatively, price may break 1st resistance structure and head for 2nd resistance at 1.26237, which coincides with horizontal overlap resistance and 50% Fibonacci retracement.
On the H4, with price moving below the ichimoku cloud, we have a bearish bias that price will from from our 1st resistance at 1.25632 which is in line with horizontal overlap resistance and 38.2% Fibonacci retracement to 1st support at 1.24604, which is in line with horizontal overlap support and 100% Fibonacci projection level. Alternatively, price may break 1st resistance structure and head for 2nd resistance at 1.26185, which coincides with horizontal overlap resistance and 61.8% Fibonacci retracement.
Areas of consideration:
- H4 time frame, 1st support at 1.24604
- H4 time frame, 1st resistance at 1.25632
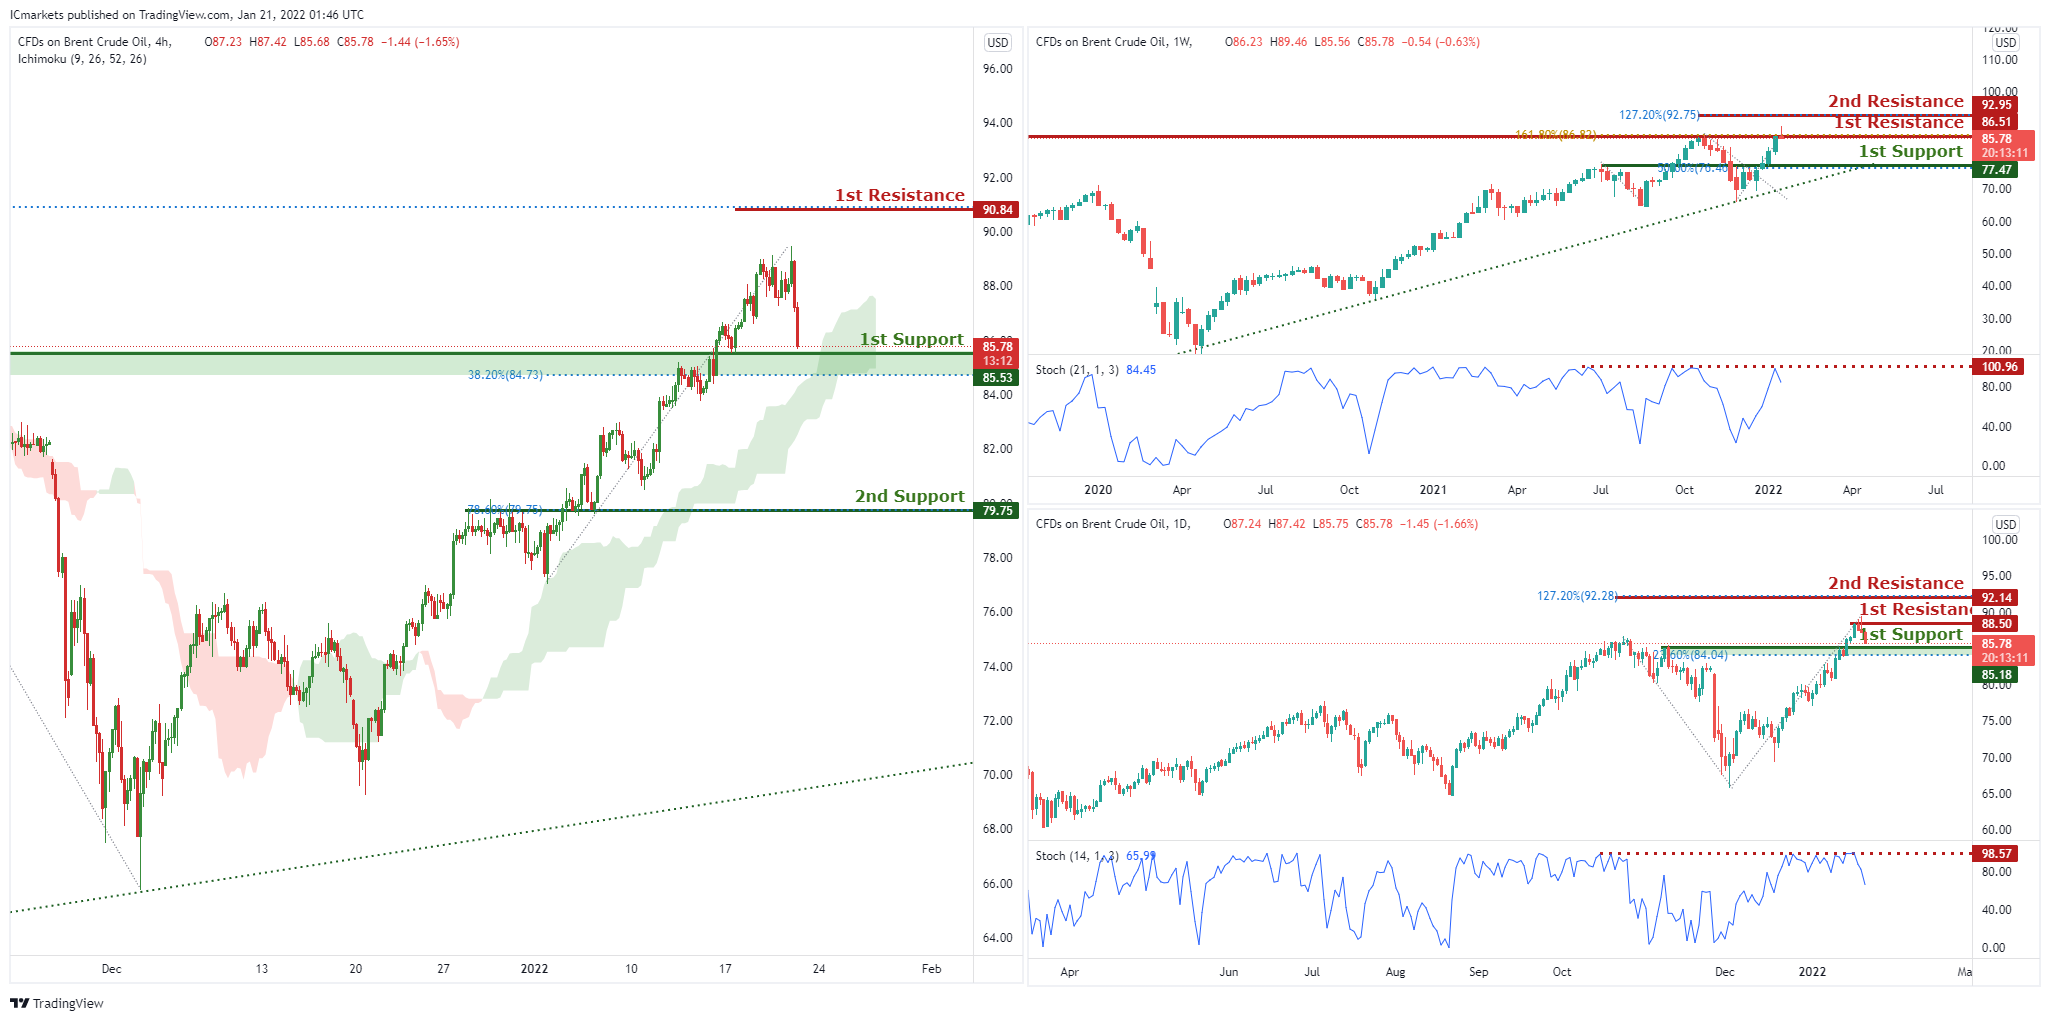
OIL:
On the Weekly, with price moving below the ichimoku cloud, we have a bearish bias that price will from from our 1st resistance at 86.51 which is in line with horizontal overlap resistance and 161.8% Fibonacci extension to 1st support at 77.47, which is in line with horizontal overlap support and 50% Fibonacci retracement level. Alternatively, price may break 1st resistance structure and head for 2nd resistance at 92.95, which coincides with horizontal swing high resistance and 127.2% Fibonacci extension.
On the Daily, with price respecting the stochastics resistance, we have a bearish bias that price will drop from our 1st resistance at 88.5 which is in line with horizontal swing high resistance to 1st support at 85.18, which is in line with horizontal overlap support and 23.6% Fibonacci retracement level. Alternatively, price may break 1st resistance structure and head for 2nd resistance at 92.14, which coincides with horizontal overlap resistance and 127.2% Fibonacci extension.
On the H4, with price moving above the ichimoku cloud, we have a bullish bias that price will rise to our 1st resistance at 90.84 which is in line with horizontal swing high resistance and 127.2% Fibonacci extension level from 1st support at 85.53, which is in line with horizontal overlap support and 32.8% Fibonacci retracement. Alternatively, price may break 1st support structure and head for 2nd support at 79.75, which coincides with horizontal overlap support and 78.6% Fibonacci retracement.
Areas of consideration:
- H4 time frame, 1st resistance of 90.84
- H4 time frame, 1st support of 85.53
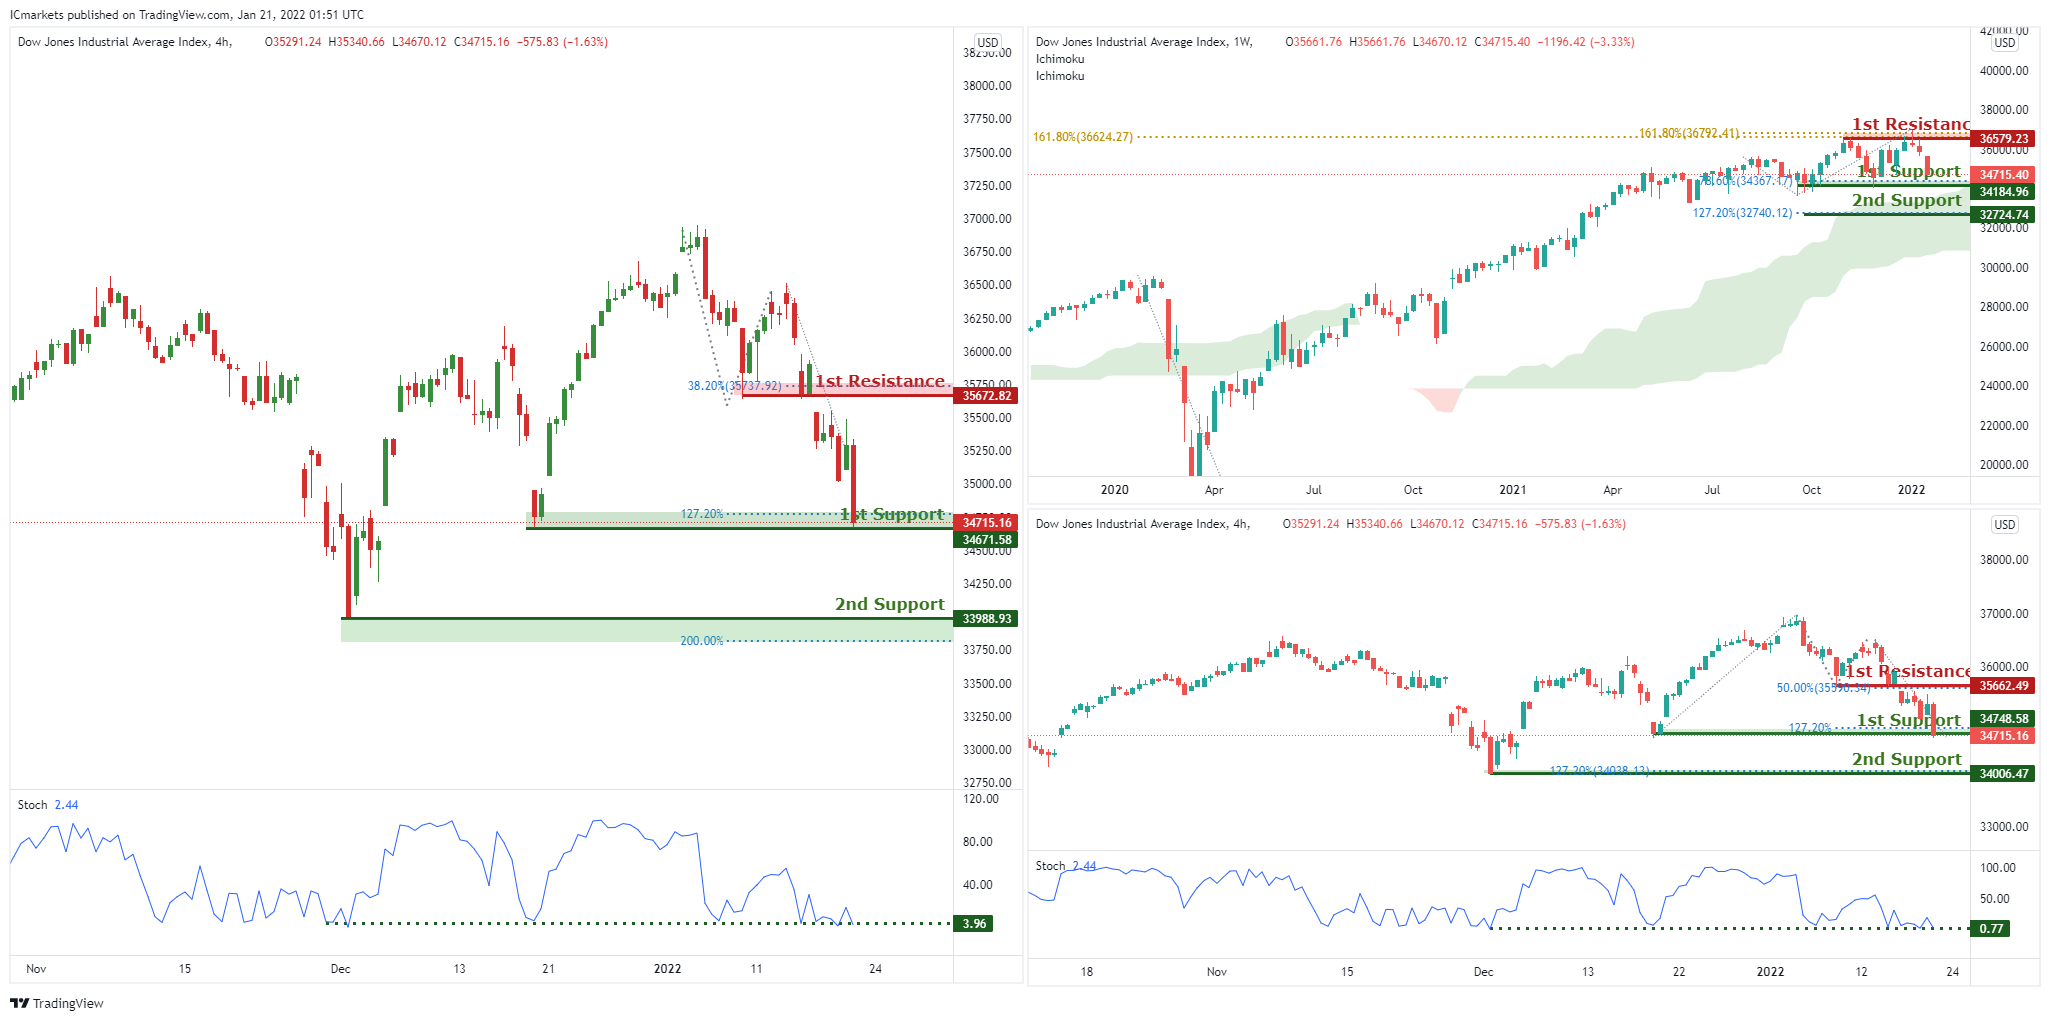
Dow Jones Industrial Average:
On the Weekly, with price moving above the ichimoku cloud, we have a bullish bias that price will rise to our 1st resistance at 36579 which is in line with horizontal swing high resistance and 161.8% Fibonacci extension level from 1st support at 34184, which is in line with horizontal overlap support and 78.6% Fibonacci retracement. Alternatively, price may break 1st support structure and head for 2nd support at 32724, which coincides with horizontal overlap support and 127.2% Fibonacci extension.
On the Daily, with price moving above the ichimoku cloud, we have a bullish bias that price will rise to our 1st resistance at 35662 which is in line with horizontal swing high resistance and 50% Fibonacci retracement level from 1st support at 34748, which is in line with horizontal overlap support and 127.2% Fibonacci extension. Alternatively, price may break 1st support structure and head for 2nd support at 34006, which coincides with horizontal overlap support and 127.2% Fibonacci extension.
On the H4, with price moving above the ichimoku cloud, we have a bullish bias that price will rise to our 1st resistance at 35672 which is in line with horizontal swing high resistance and 38.2% Fibonacci retracement level from 1st support at 34671, which is in line with horizontal overlap support and 127.2% Fibonacci extension. Alternatively, price may break 1st support structure and head for 2nd support at 33988, which coincides with horizontal overlap support and 200% Fibonacci extension.
Areas of consideration:
- H4 time frame, 1st resistance of 35672
- H4 time frame, 1st support of 34671
The accuracy, completeness and timeliness of the information contained on this site cannot be guaranteed. IC Markets does not warranty, guarantee or make any representations, or assume any liability regarding financial results based on the use of the information in the site.
News, views, opinions, recommendations and other information obtained from sources outside of www.icmarkets.com.au, used in this site are believed to be reliable, but we cannot guarantee their accuracy or completeness. All such information is subject to change at any time without notice. IC Markets assumes no responsibility for the content of any linked site.
The fact that such links may exist does not indicate approval or endorsement of any material contained on any linked site. IC Markets is not liable for any harm caused by the transmission, through accessing the services or information on this site, of a computer virus, or other computer code or programming device that might be used to access, delete, damage, disable, disrupt or otherwise impede in any manner, the operation of the site or of any user’s software, hardware, data or property.


