
EUR/USD:
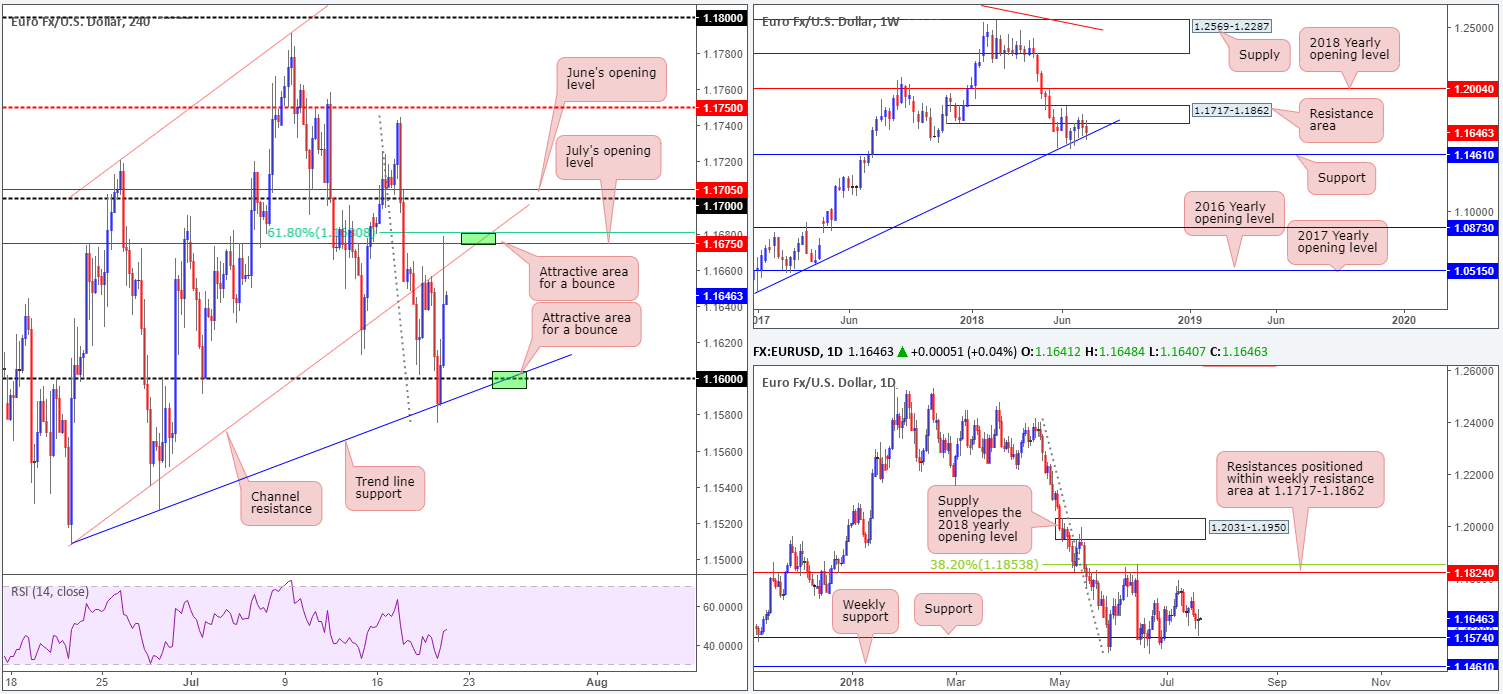
Over the course of Thursday’s movement, markets witnessed a break of the 1.16 handle plotted on the H4 timeframe. EUR/USD shorts, however, quickly lost their flavor at lows of 1.1575 after US President Trump renewed his criticism of the dollar’s high value in an interview with CNBC. H4 price reclaimed 1.16 and went on to test H4 channel support-turned resistance (extended from the low 1.1508)/July’s opening level at 1.1675. It was from this point, the buck pared back a portion of Trump-induced losses after the White House stated the Administration respects the Fed’s independence.
On account of the above, H4 price now appears to have free rein between July’s opening level at 1.1675 and the 1.16 barrier. Despite recent movement, weekly flows remain capped between trend line support (etched from the low 1.0340) and a nearby resistance area at 1.1717-1.1862. On the daily timeframe, nevertheless, we can see price came within close proximity to testing support drawn from 1.1574, which boasts a reasonably sound history dating back as far as mid-2015.
Areas of consideration:
To our way of seeing things, there’s equal opportunity to trade this pair both long and short today (intraday H4).
Our first area of interest falls in around July’s opening level at 1.1675 for possible shorts. What gives this level credibility is the merging channel support-turned resistance (extended from the low 1.1508) and nearby 61.8% Fib resistance at 1.1680.
The second area can be seen at the 1.16 threshold due to it converging nicely with a trend line support (etched from the low 1.1508).
Ultimate targets from each area are the opposing zones. So, if one were to long 1.16, 1.1675 is considered the take-profit zone, while shorts from 1.1675 has the 1.16 line to target.
Today’s data points: Limited.
GBP/USD:
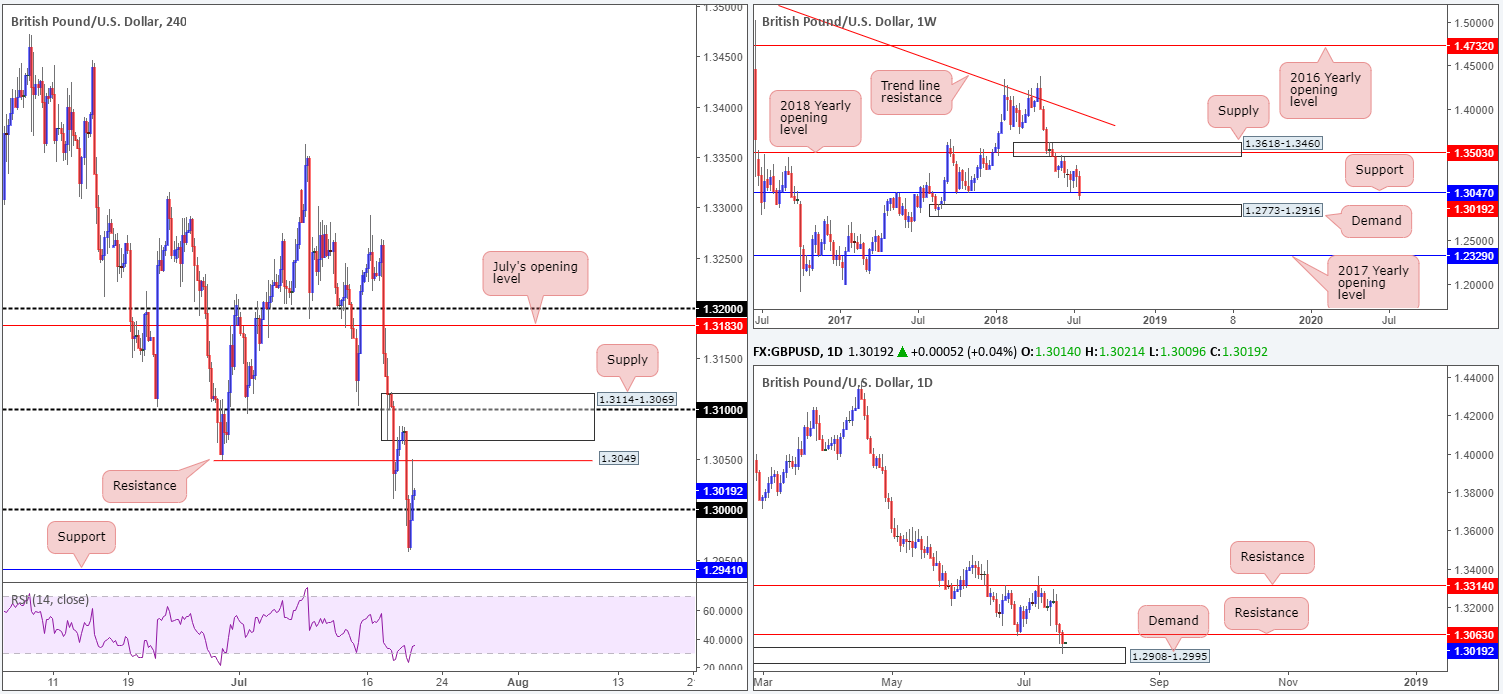
Lower-than-expected UK retail sales, along with Brexit and related government jitters, saw the British pound lose the key figure 1.30 amid Thursday trade. Despite this, the dollar came under fresh pressure after US President Trump renewed his criticism of the dollar’s high value in an interview with CNBC, driving cable back above 1.30 to H4 resistance at 1.3049.
While buyers and sellers battle for position on the H4 timeframe between resistance at 1.3049 and the 1.30 handle, higher-timeframe structure is also worthy of attention. Daily price crunched through support at 1.3063 (now acting resistance) yesterday, though quickly found demand at 1.2908-1.2995. The story over on the weekly timeframe, however, shows support at 1.3047 struggling to hold ground, possibly poised to shake hands with nearby demand priced in at 1.2773-1.2916 (note the current daily demand zone is glued to the top edge of this weekly area).
Areas of consideration:
According to the higher timeframes, the markets may witness a recovery sometime down the road. A daily close above daily resistance at 1.3063 would, in our view, add confidence to this theory.
In terms of immediate trading opportunities, the H4 supply zone at 1.3114-1.3069 may produce a bounce lower. We say this due to the area housing the 1.31 handle and fusing closely with daily resistance mentioned above at 1.3063.
Today’s data points: UK public sector net borrowing.
AUD/USD:
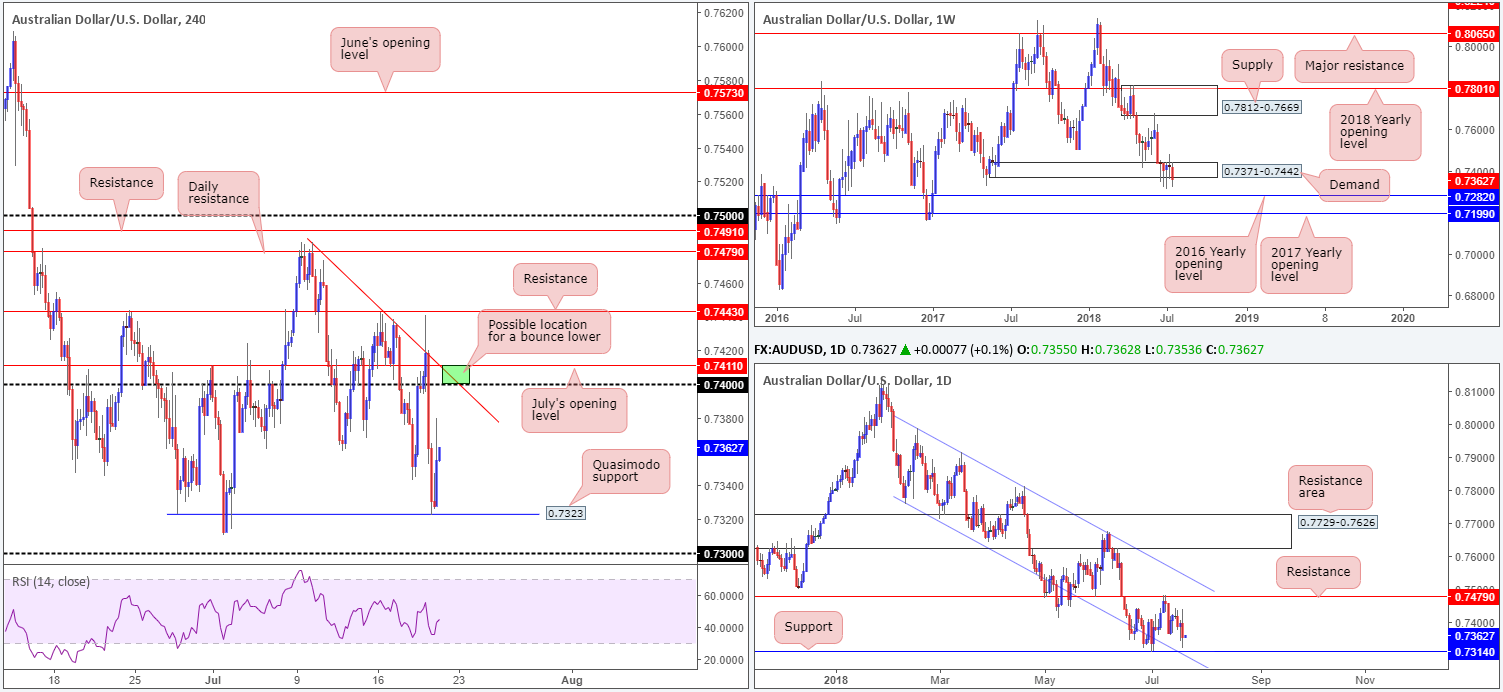
Early Asia witnessed strong demand for the Australian dollar on upbeat employment data, sending the commodity currency to highs of 0.7441. Unable to test H4 resistance at 0.7443, the pair rotated lower and fell sharply, reclaiming news-driven gains and testing H4 Quasimodo support at 0.7323. As you can see, this level held to the pip, bolstered by comments from US President Trump concerning the pace of US interest rate hikes.
Branching over to the higher timeframes, one can see weekly demand at 0.7371-0.7442 remains in a fragile state. Continued indecisiveness here could open the window to a possible test of the 2016 yearly opening level at 0.7282 sometime down the road. In the event that the bulls regain consciousness, however, a retest of supply at 0.7812-0.7669 may be on the cards. Daily activity, on the other hand, is seen poised to challenge nearby support penciled in at 0.7314 and its closely associated channel support (taken from the low 0.7758).
Areas of consideration:
The area that really stands out on the H4 timeframe this morning is seen between July’s opening level at 0.7411 and the 0.74 handle (green zone), due to it converging with trend line resistance (from the high 0.7483). As long as daily price does not connect with support at 0.7314, a sell from 0.7411/0.74 is also in line with our higher-timeframe readings.
Given the sell zone is small, though, traders are urged to wait for additional candle confirmation before pulling the trigger (think pin-bar candle formations and engulfing patterns). As for take-profit zones, it’s a little difficult to judge since the approach has yet to complete. However, expecting more than the daily support level would be a stretch, in our humble view.
Today’s data points: Limited.
USD/JPY:
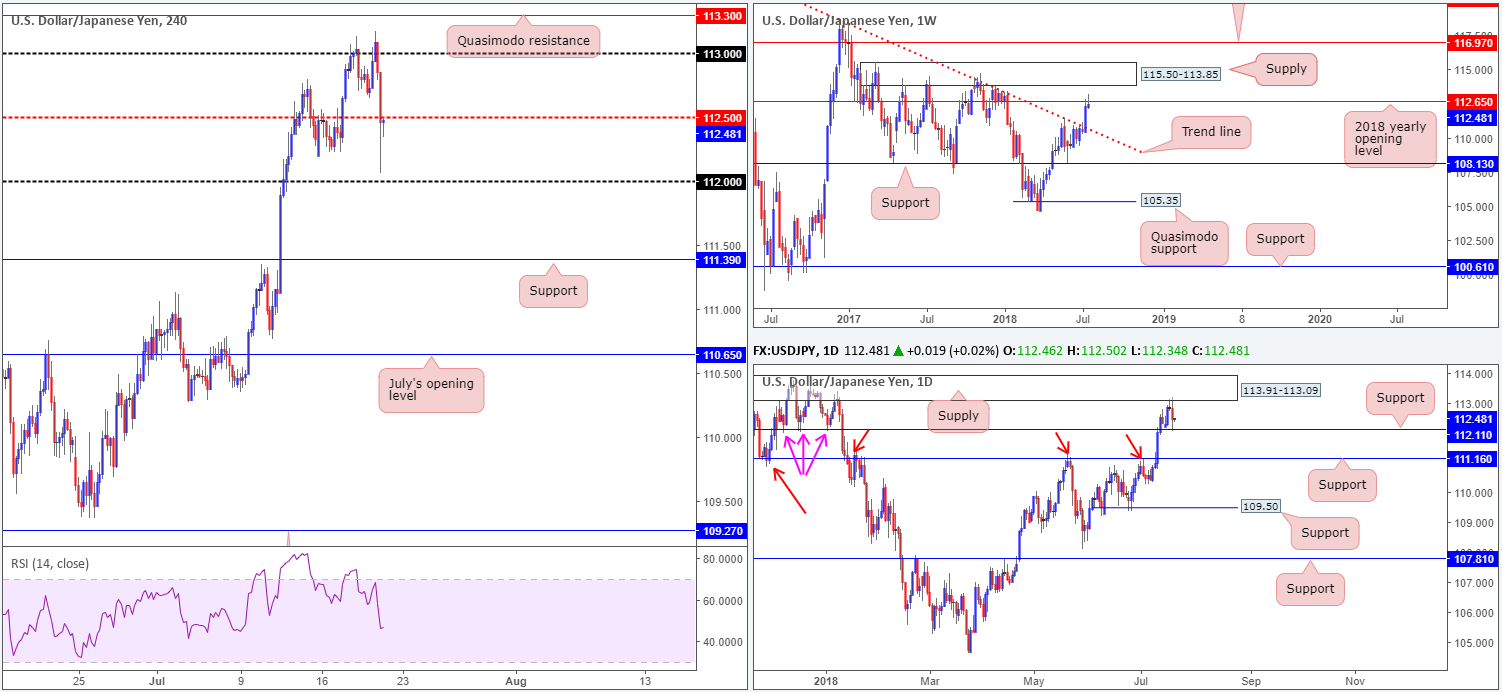
Kicking off with a look at the weekly timeframe this morning, the USD/JPY is seen fading the 2018 yearly opening level at 112.65 in the shape of a bearish pin-bar candle formation. Continual selling from here has the trend line resistance-turned support (taken from the high 123.57) to target.
Lower down on the curve, however, the daily candles respected supply at 113.91-113.09 in recent trade, consequently sending the unit southbound to nearby support at 112.11 (note how this level held price higher in December 2017 and early January 2018 – pink arrows). A break beyond here has another layer of support positioned nearby at 111.16. Having seen this level serve as strong resistance this year (see red arrows), a response from this base is expected.
Leaving the H4 Quasimodo resistance level at 113.30 unchallenged on Thursday, the pair fell sharply on comments from US President Trump suggesting the Fed’s rate hikes are hurting the growth of the country. The move abruptly took out H4 mid-level support at 112.50 and came within striking distance of the 112 handle, before mildly paring losses into the close.
Areas of consideration:
Seeing weekly price beginning to pay respect to the 2018 yearly opening level, and daily action testing support, unfortunately leaves longer-term traders in a precarious position in terms of market structure.
Intraday, however, the H4 candles are finding resistance at the underside of 112.50, in line with weekly flow. Of course, though, a short from here would have you positioned against potential buying from daily support! Not an ideal situation.
In light of the above reading, the team has noted a cautious stance in this market today.
Today’s data points: Limited.
USD/CAD:
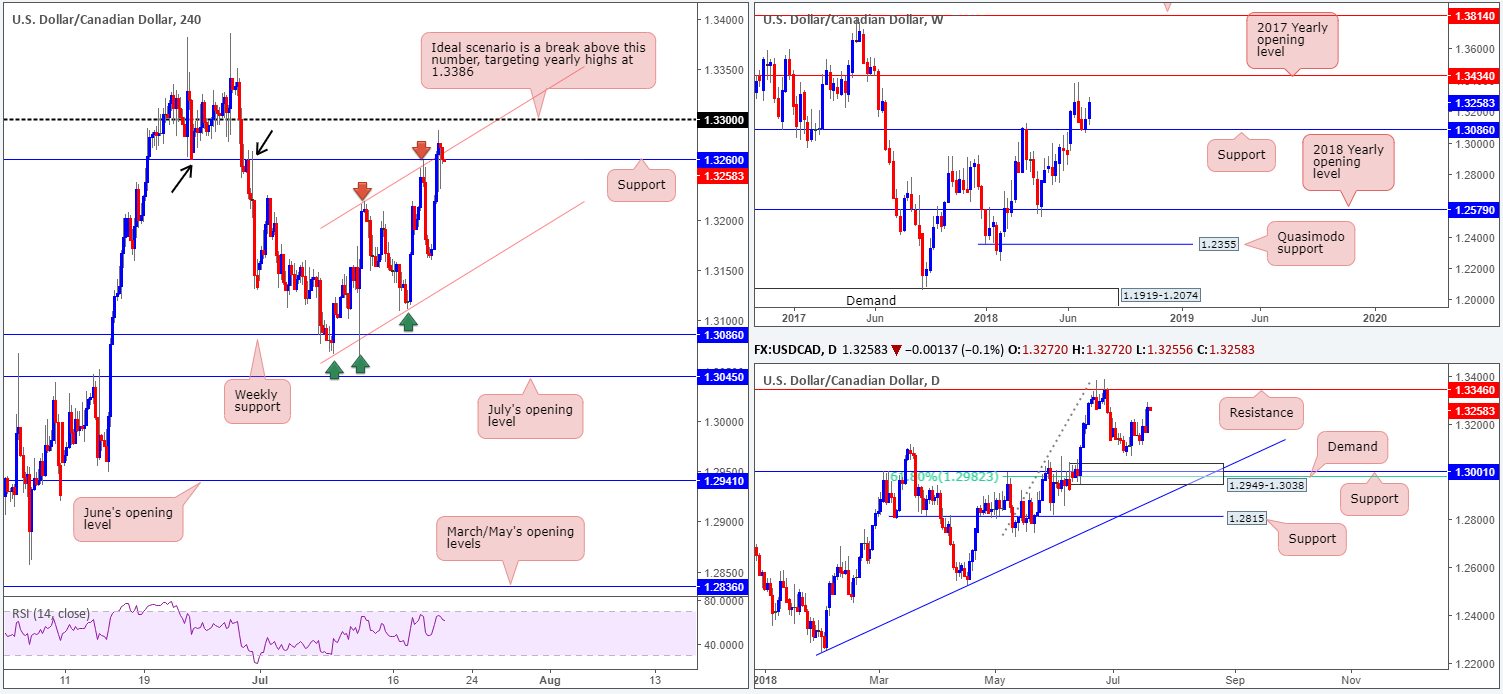
USD/CAD bulls went on the offensive on Thursday, building on prior gains made off weekly support priced in at 1.3086. Further upside from this point (on the weekly timeframe that is) could eventually lead to a test of the 2018 highs at 1.3386, followed closely by the 2017 yearly opening level at 1.3434. A closer look at price action the daily timeframe reveals potential for additional buying. We say this simply because there is space for the bulls to stretch their legs until reaching resistance at 1.3346.
Sliding over to the H4 candles, recent buying pressured the unit above resistance at 1.3260 (now acting support). Another key thing to point out on this timeframe is the channel resistance (etched from the high 1.3218). Note the ascending line suffered a minor breach during trade on Thursday, but remains in the fray despite support coming in from 1.3260.
Areas of consideration:
Higher-timeframe structure suggests the market could extend upside in the near future. Both weekly and daily charts show elbowroom to maneuver.
H4 structure, on the other hand, is somewhat more restricted. Aside from support at 1.3260 and nearby channel resistance in play at the moment, additional resistance is sited overhead at the 1.33 handle. With this being the case, the team has expressed the need for patience. A H4 close above 1.33 (preferably along with a retest as support) would, in our humble view, be considered a strong bullish cue in line with the higher timeframes, targeting yearly highs mentioned above at 1.3386.
Today’s data points: CAD inflation figures.
USD/CHF:
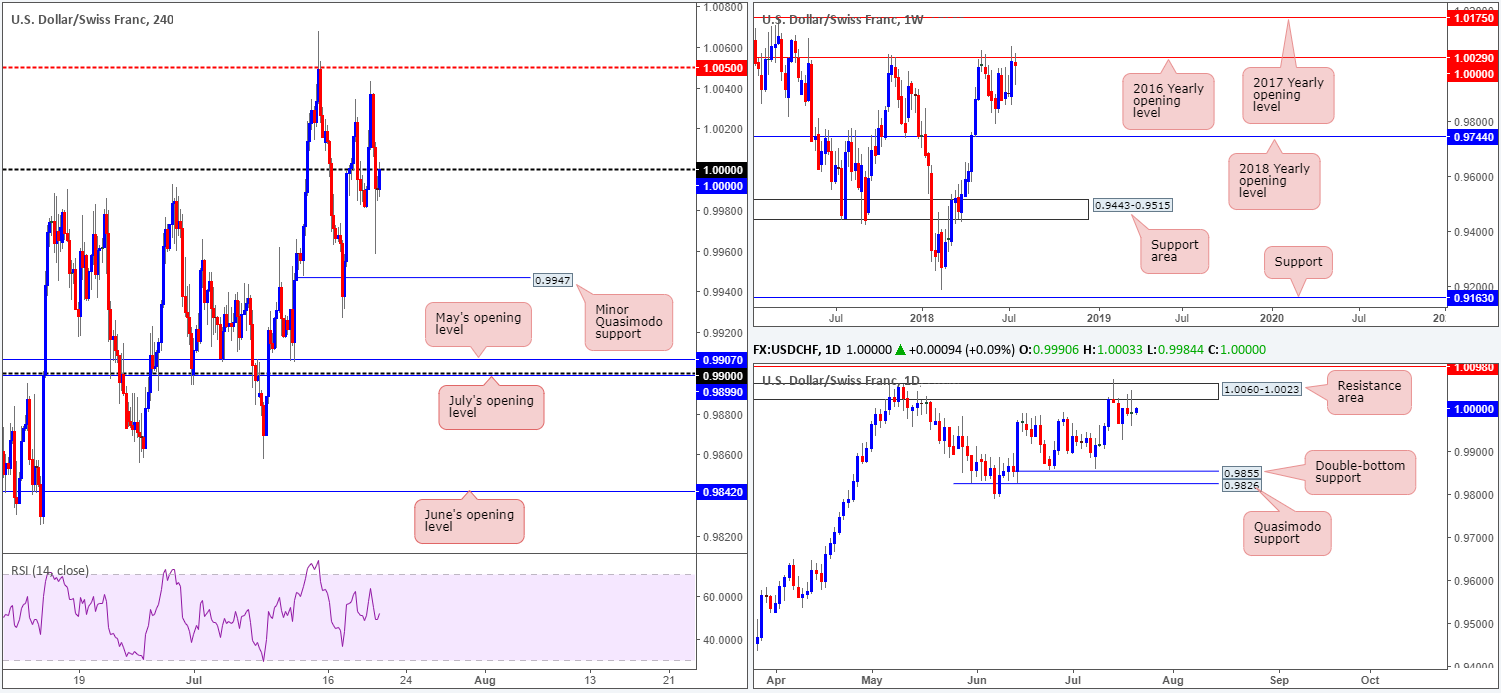
Coming in from the top this morning, weekly activity is seen kissing the underside of the 2016 yearly opening level at 1.0029. Additional resistance is seen beyond this line at 1.0175: the 2017 yearly opening level, whereas below 1.0029 we have June lows at 0.9788 to target, as well as the 2018 yearly opening level at 0.9744.
In support of the current weekly resistance, daily flows are challenging a resistance area coming in at 1.0060-1.0023. The next downside target on this scale falls in at double-bottom support drawn from 0.9855, shadowed closely by Quasimodo support at 0.9826.
In terms of H4 movement, the pair is trading sub parity (1.0000), as we write. A rejection off of this number exposes minor H4 Quasimodo support at 0.9947. Beyond here is May’s opening level priced in at 0.9907, followed by the 0.99 handle.
Areas of consideration:
Knowing we’re coming from higher-timeframe resistances, along with H4 price testing the underside of parity, a break to lower levels could be on the cards today. However, given the market has ignored parity in recent trade, caution is advised. To be on the safe side in regard to shorts from this number, waiting and seeing if H4 price can chalk up a full or near-full-bodied bearish candle here might be an option.
From that point on, traders could look for shorts on the close of the candle (with stops above the wick), targeting the minor H4 Quasimodo support at 0.9947 as the initial take-profit zone.
Today’s data points: Limited.
Dow Jones Industrial Average:
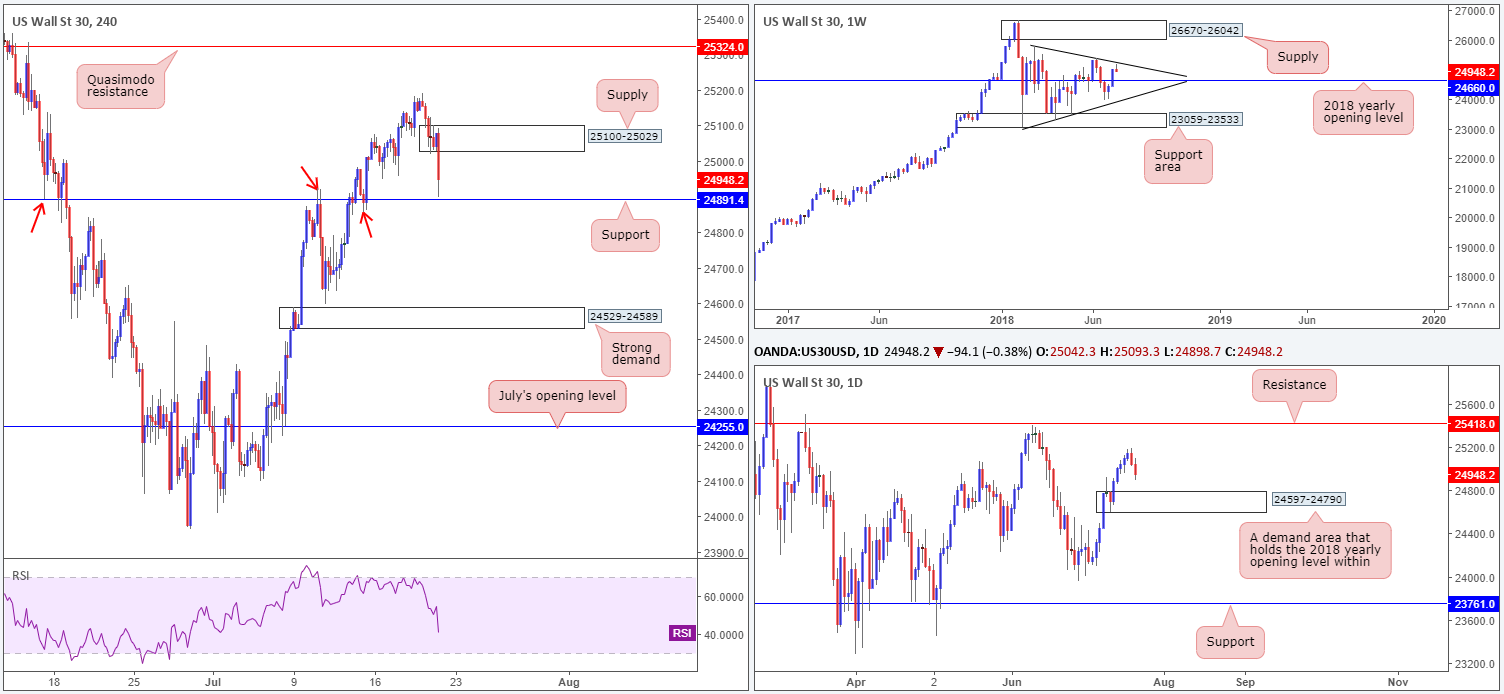
After the 7th consecutive weaker fix by the PBoC, the USD/CNH is seen approaching 6.8300. At the same time, this has spooked sentiment in US equities, dragging the DJIA lower in recent trade. As you can see, H4 support at 24891 is the next base on the hit list. A breach of this level will have sellers looking to H4 demand at 24529-24589, whereas a rejection off 24891 has the newly formed H4 supply at 25100-25029 to target.
The overall landscape on the higher timeframes shows weekly price selling off just south of a trend line resistance (etched from the high 25807). A little lower on the curve, however, the market could witness a surge of buying activity off daily demand plotted at 24597-24790, which is the next downside objective on this scale.
Areas of consideration:
Although H4 support boasts reasonably solid history (see red arrows), the level lacks higher-timeframe confluence. Not only do we have weekly sellers attacking this area, there’s a chance daily sellers could also be involved as they target daily demand mentioned above at 24597-24790.
From a technical standpoint, the safer long is likely within the current daily demand, more specifically off the 2018 yearly opening level located on the weekly timeframe at 24660. By using these areas, one is able to position stop-loss orders beneath the daily demand. The only grumble here is a possible fakeout below the daily demand to test nearby H4 demand highlighted above at 24529-24589. Therefore, placing stops beneath this area would be the better bet, in our humble view.
Today’s data points: Limited.
XAU/USD (Gold)
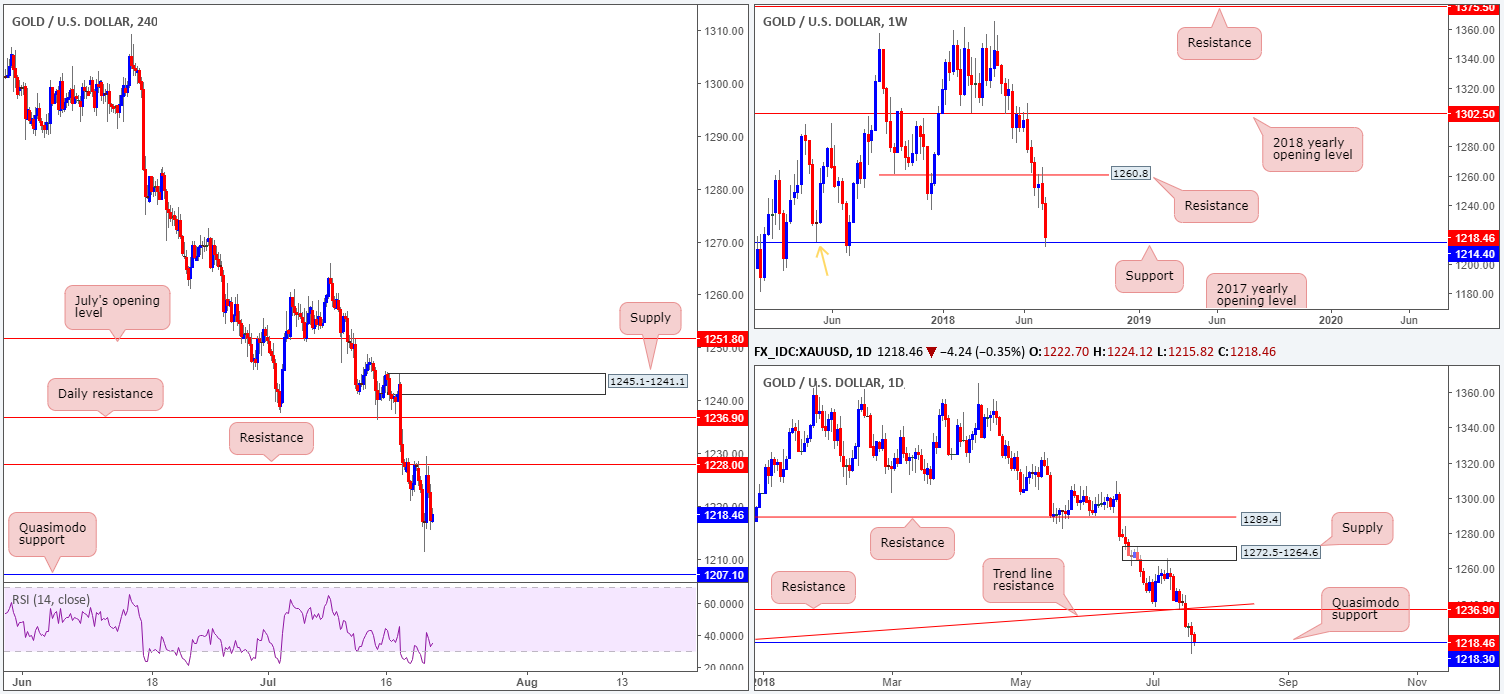
In recent movement, weekly price finally crossed swords with weekly support priced in at 1214.4. Note this level also happens to represent a Quasimodo support taken from the left shoulder marked with an orange arrow. In line with this weekly barrier, traders may have also noticed a daily Quasimodo support recently entered the fray at 1218.3. A rejection off of this hurdle has daily resistance at 1236.9 to target, along with nearby trend line support-turned resistance (taken from the low 1195.1).
Zooming in for a closer look at the H4 timeframe reveals clean resistance at 1228.0, which has held the market lower on three occasions this week (if you include the minor retest upon breaking lower that is). Unlike weekly and daily structure, the H4 candles have space to probe lower to nearby Quasimodo support at 1207.1. A level taken from July 2017!
Areas of consideration:
Although H4 price indicates further downside may be on the cards, entering into short positions is a chancy move knowing the bigger picture is testing supports.
However, should the market test the noted H4 Quasimodo level and hold in the shape of a full or near-full-bodied H4 bull candle this would, according to the technicals, be a high-probability long as it is in line with higher-timeframe flows. As usual, stop-loss orders are best placed beyond the rejection candle’s tail.
The use of the site is agreement that the site is for informational and educational purposes only and does not constitute advice in any form in the furtherance of any trade or trading decisions.
The accuracy, completeness and timeliness of the information contained on this site cannot be guaranteed. IC Markets does not warranty, guarantee or make any representations, or assume any liability with regard to financial results based on the use of the information in the site.
News, views, opinions, recommendations and other information obtained from sources outside of www.icmarkets.com.au, used in this site are believed to be reliable, but we cannot guarantee their accuracy or completeness. All such information is subject to change at any time without notice. IC Markets assumes no responsibility for the content of any linked site. The fact that such links may exist does not indicate approval or endorsement of any material contained on any linked site.
IC Markets is not liable for any harm caused by the transmission, through accessing the services or information on this site, of a computer virus, or other computer code or programming device that might be used to access, delete, damage, disable, disrupt or otherwise impede in any manner, the operation of the site or of any user’s software, hardware, data or property.


