
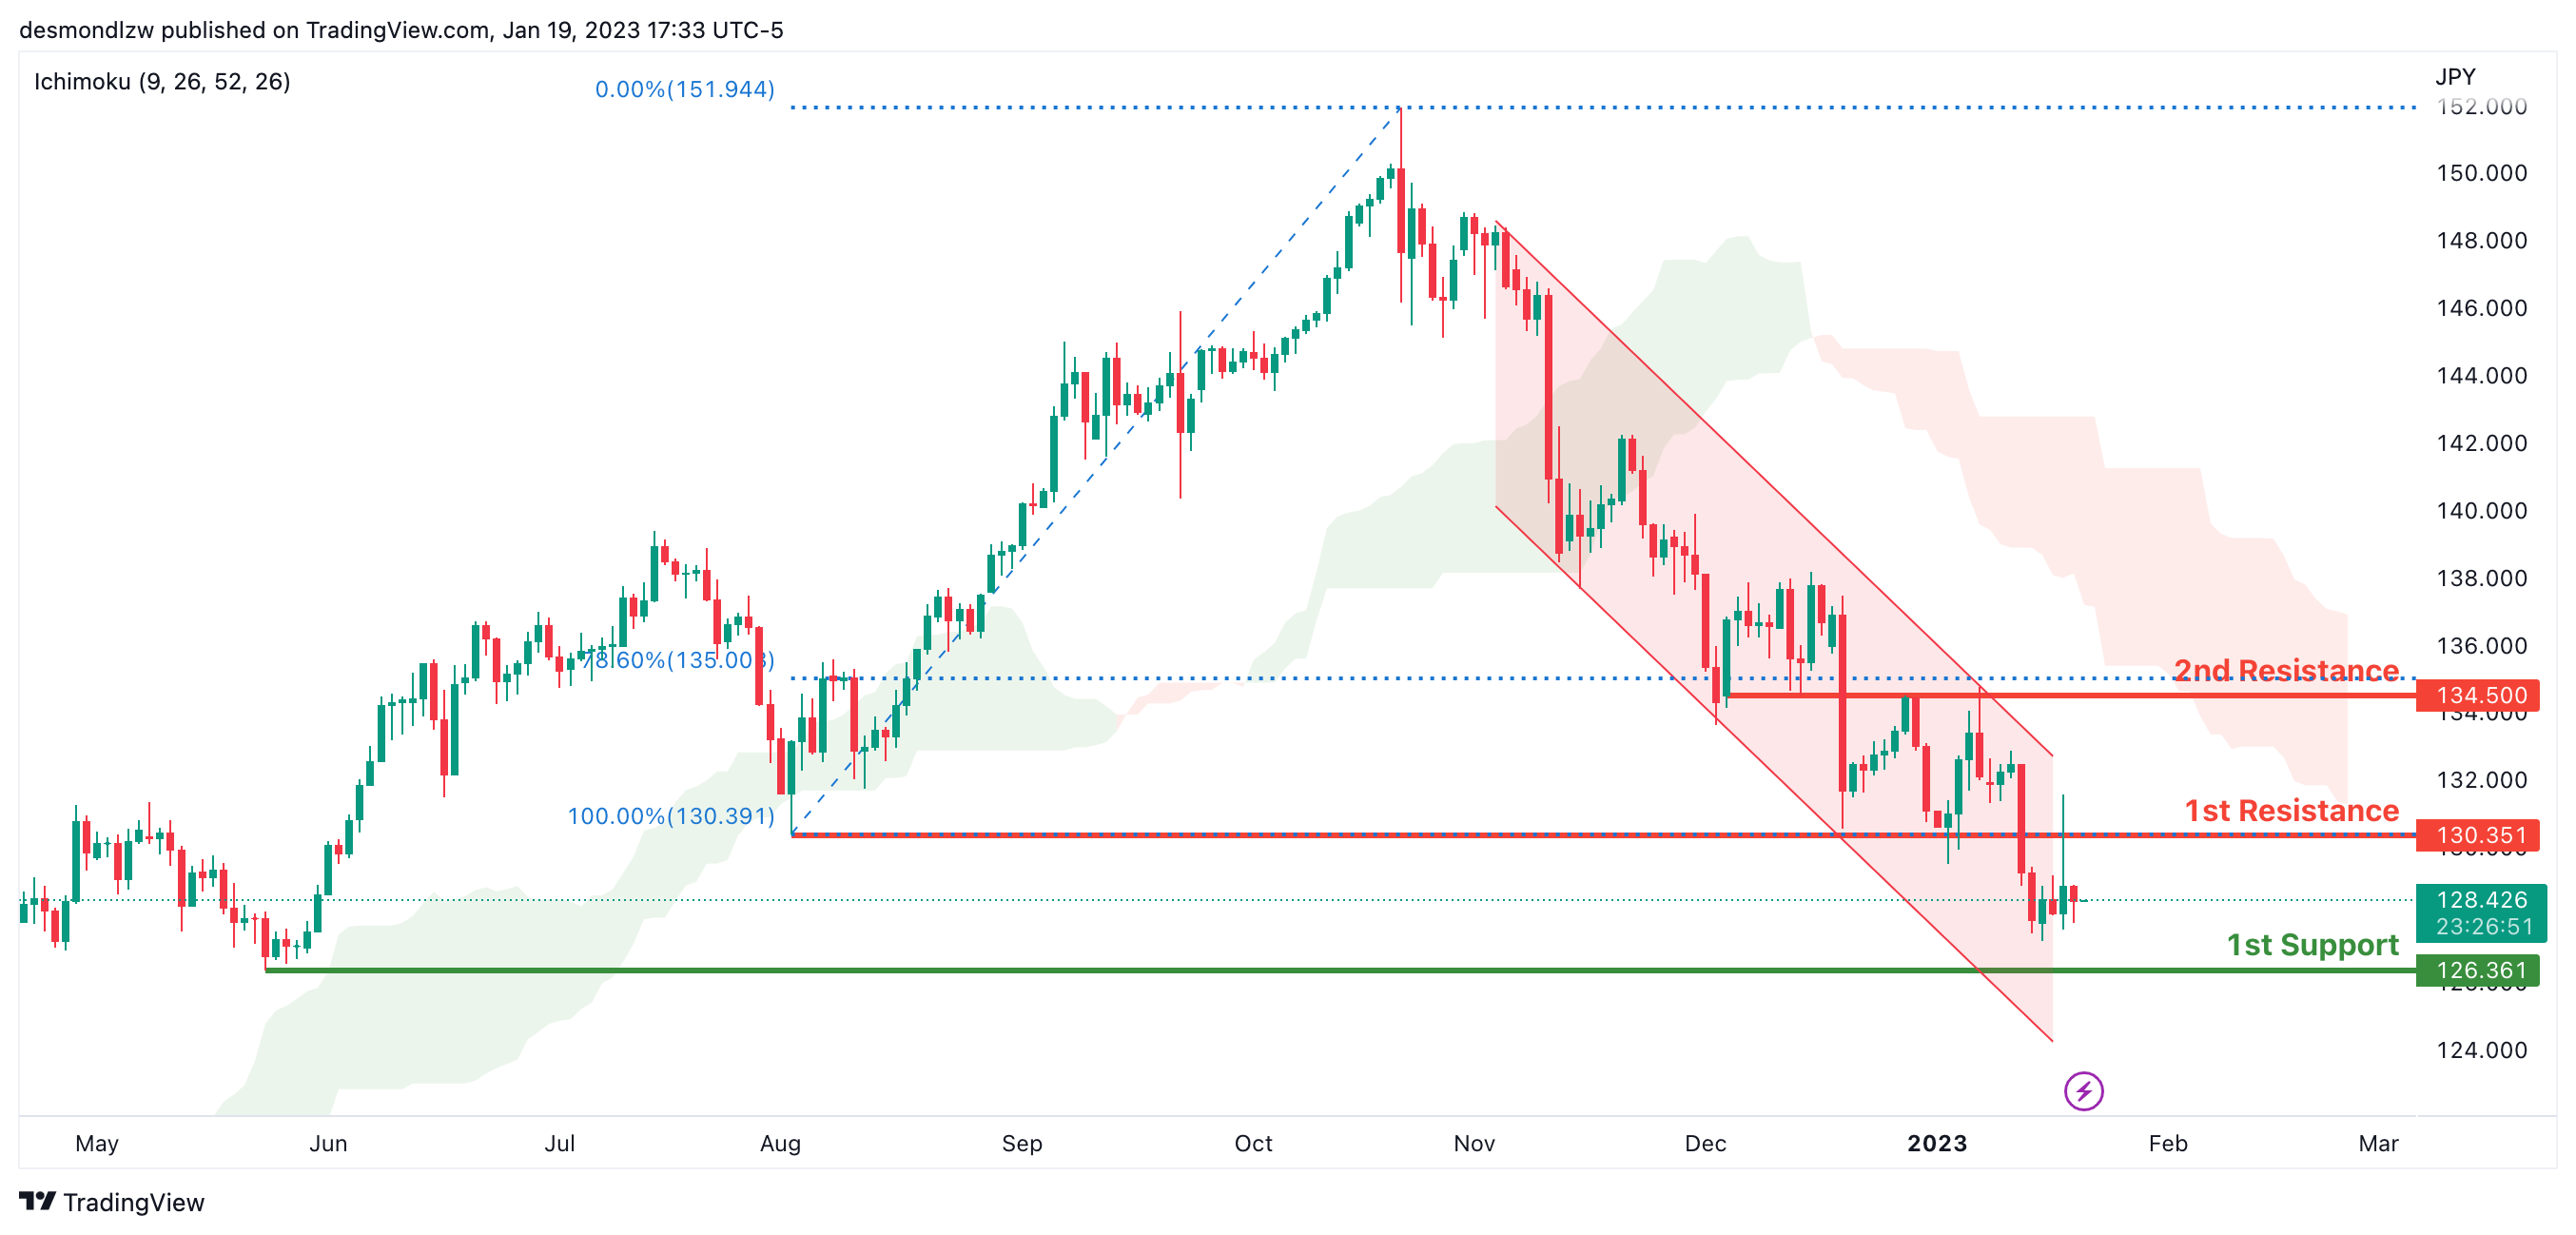
USD/JPY:
Looking at the Daily chart, my overall bias for USDJPY is bearish due to the current price being below the Ichimoku cloud, indicating a bearish market. To add confluence to this bias, price is also within a descending channel. If this bearish momentum continues, expect the price to possibly continue heading towards the 1st support level at 126.361, where the previous swing low is. In an alternate scenario, price could possibly head back up to retest the 1st resistance at 130.351, where the previous swing low is.
Areas of consideration:
- H4 time frame, 1st resistance at 130.351
- H4 time frame, 1st support at 126.361
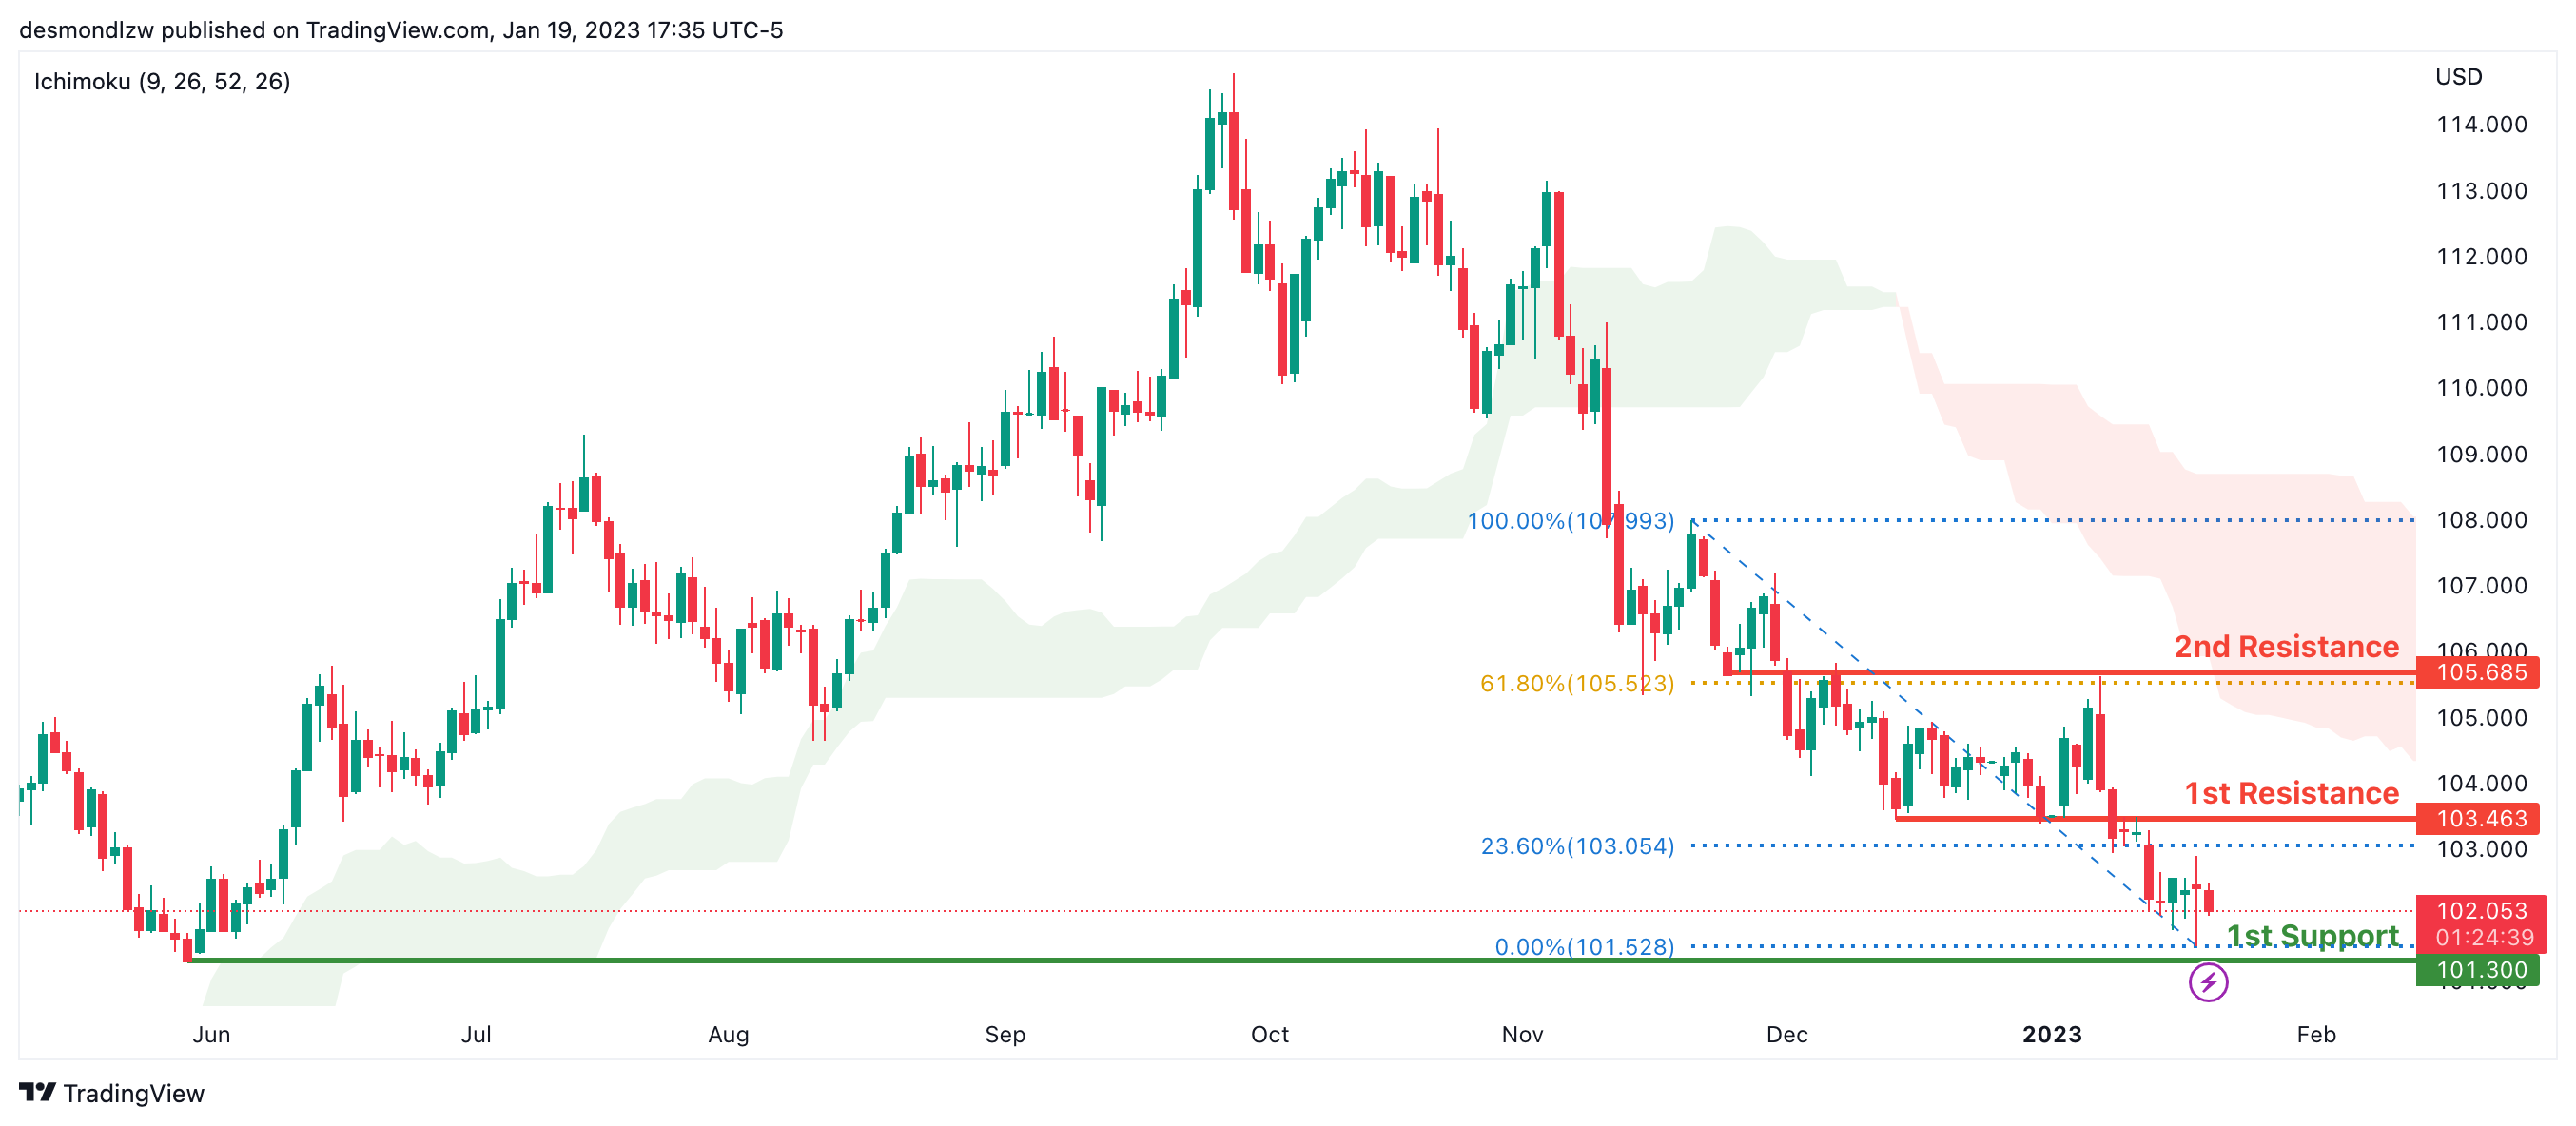
DXY:
Looking at the Daily chart, my overall bias for DXY is bearish due to the current price being below the Ichimoku cloud, indicating a bearish market. If this bearish momentum continues, expect the price to possibly continue heading towards the 1st support at 101.300, where the previous low is. . In an alternative scenario, price could head back up to retest the 1st resistance at 103.463, where the 23.6% Fibonacci line is.
Areas of consideration:
- H4 time frame, 1st resistance at 103.463
- H4 time frame, 1st support at 101.300
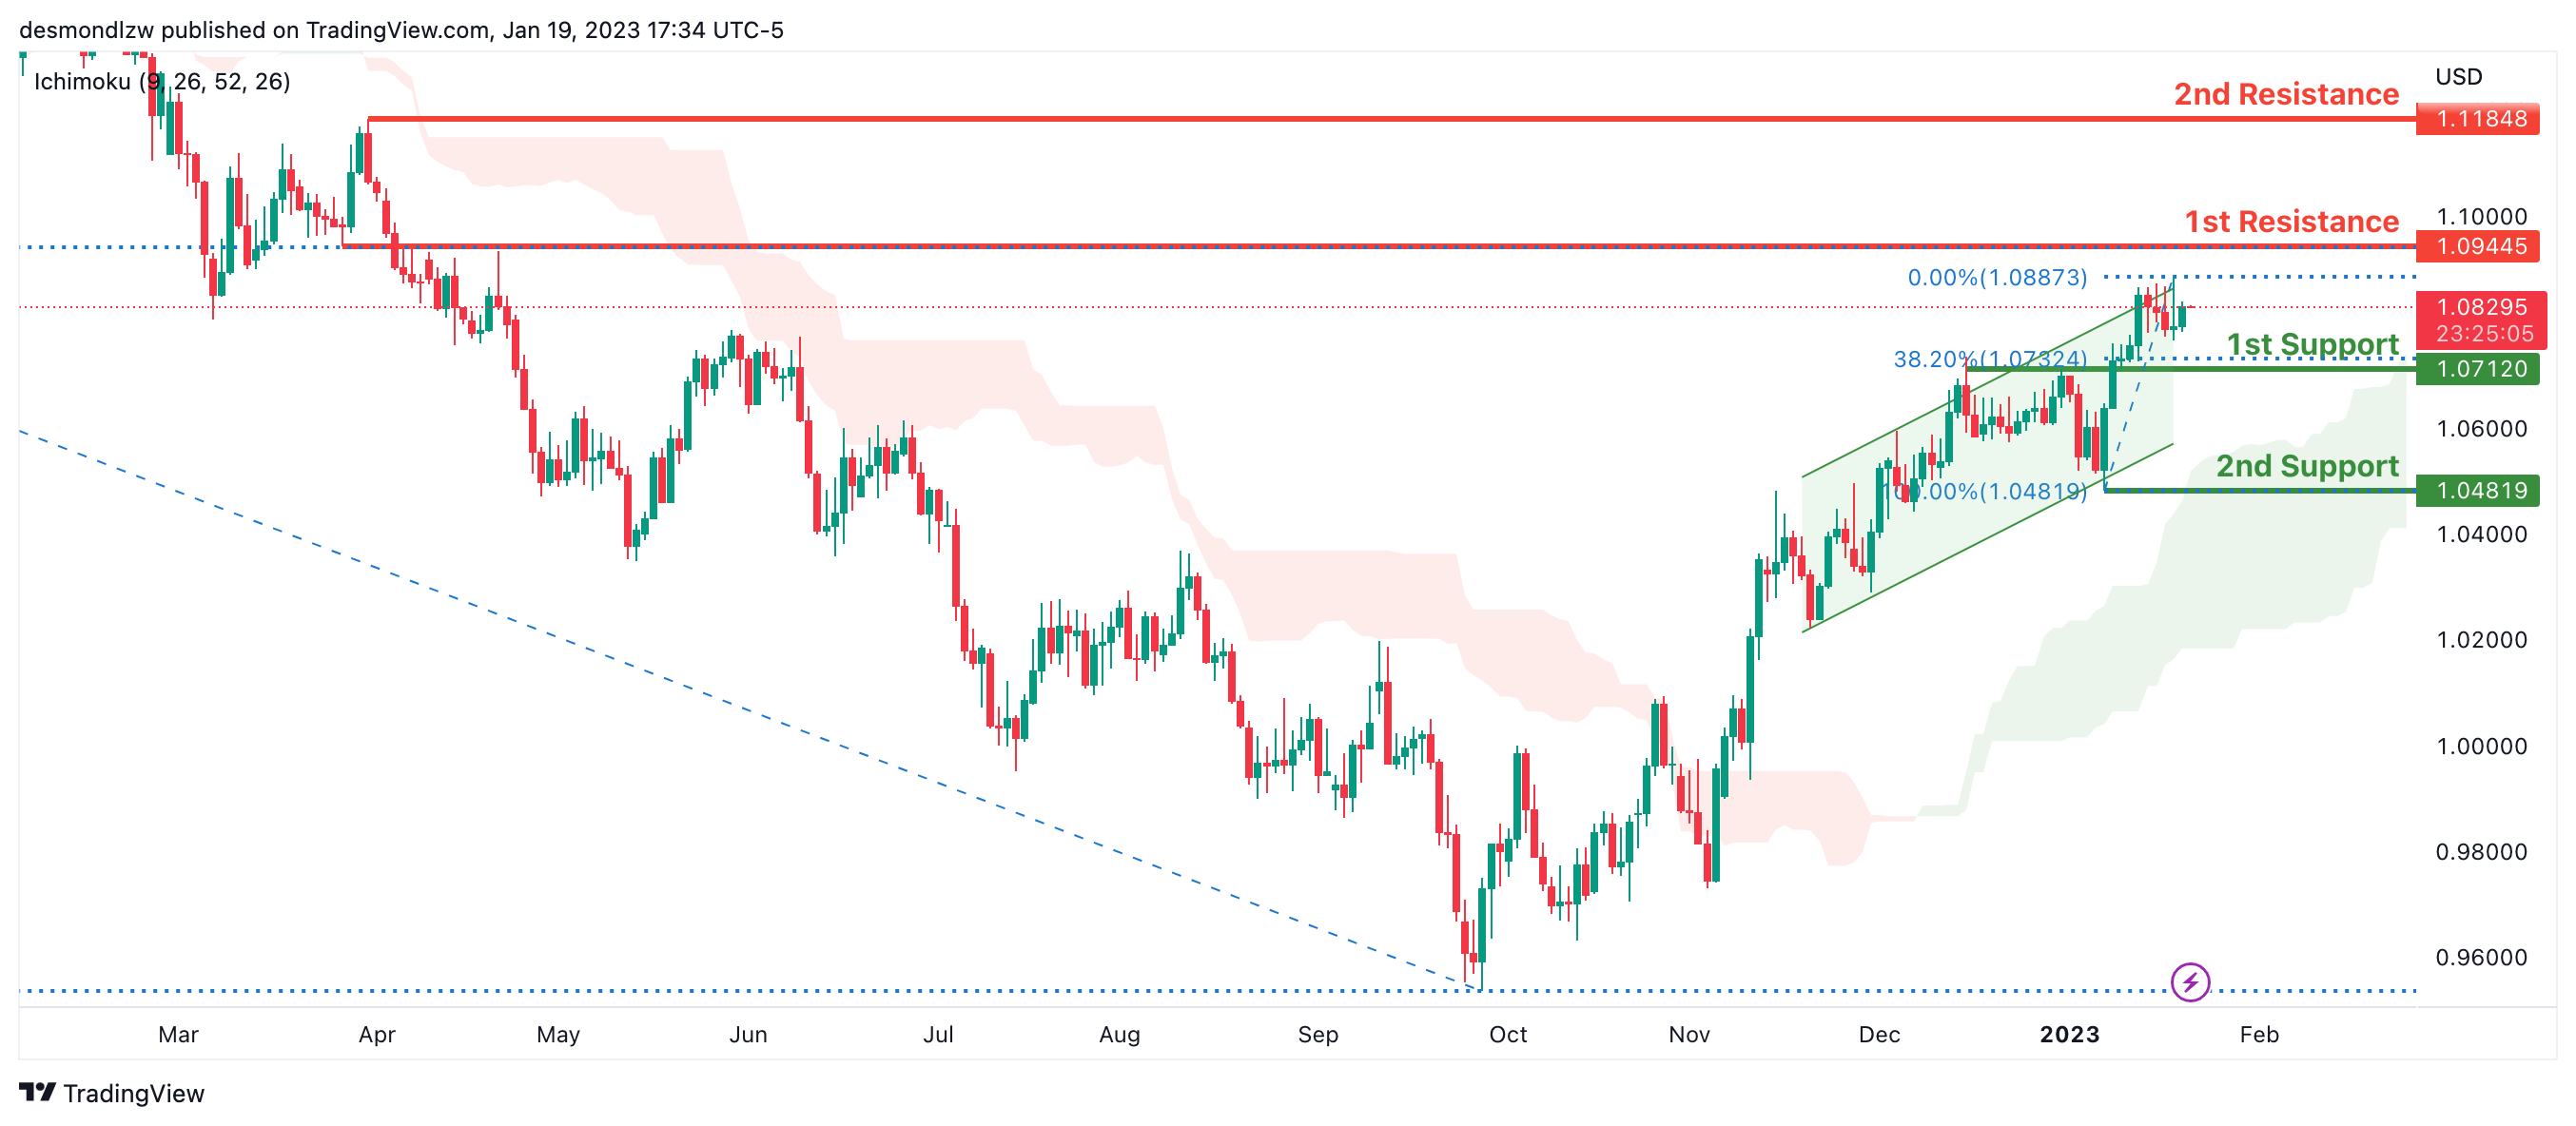
EUR/USD:
Looking at the Daily chart, my overall bias for EURUSD is bullish due to the current price being above the Ichimoku cloud, indicating a bullish market structure. To add confluence to this bias, price is also within an ascending channel. If this bullish momentum continues, expect the price to possibly continue heading towards the 1st resistance at 1.09445, where the 50% Fibonacci line is. In an alternate scenario, price could possibly head back down to retest the 1st support level at 1.07120, where the 38.2% Fibonacci line is.
Areas of consideration :
- H4 1st resistance at 1.09445
- H4 1st support at 1.07120

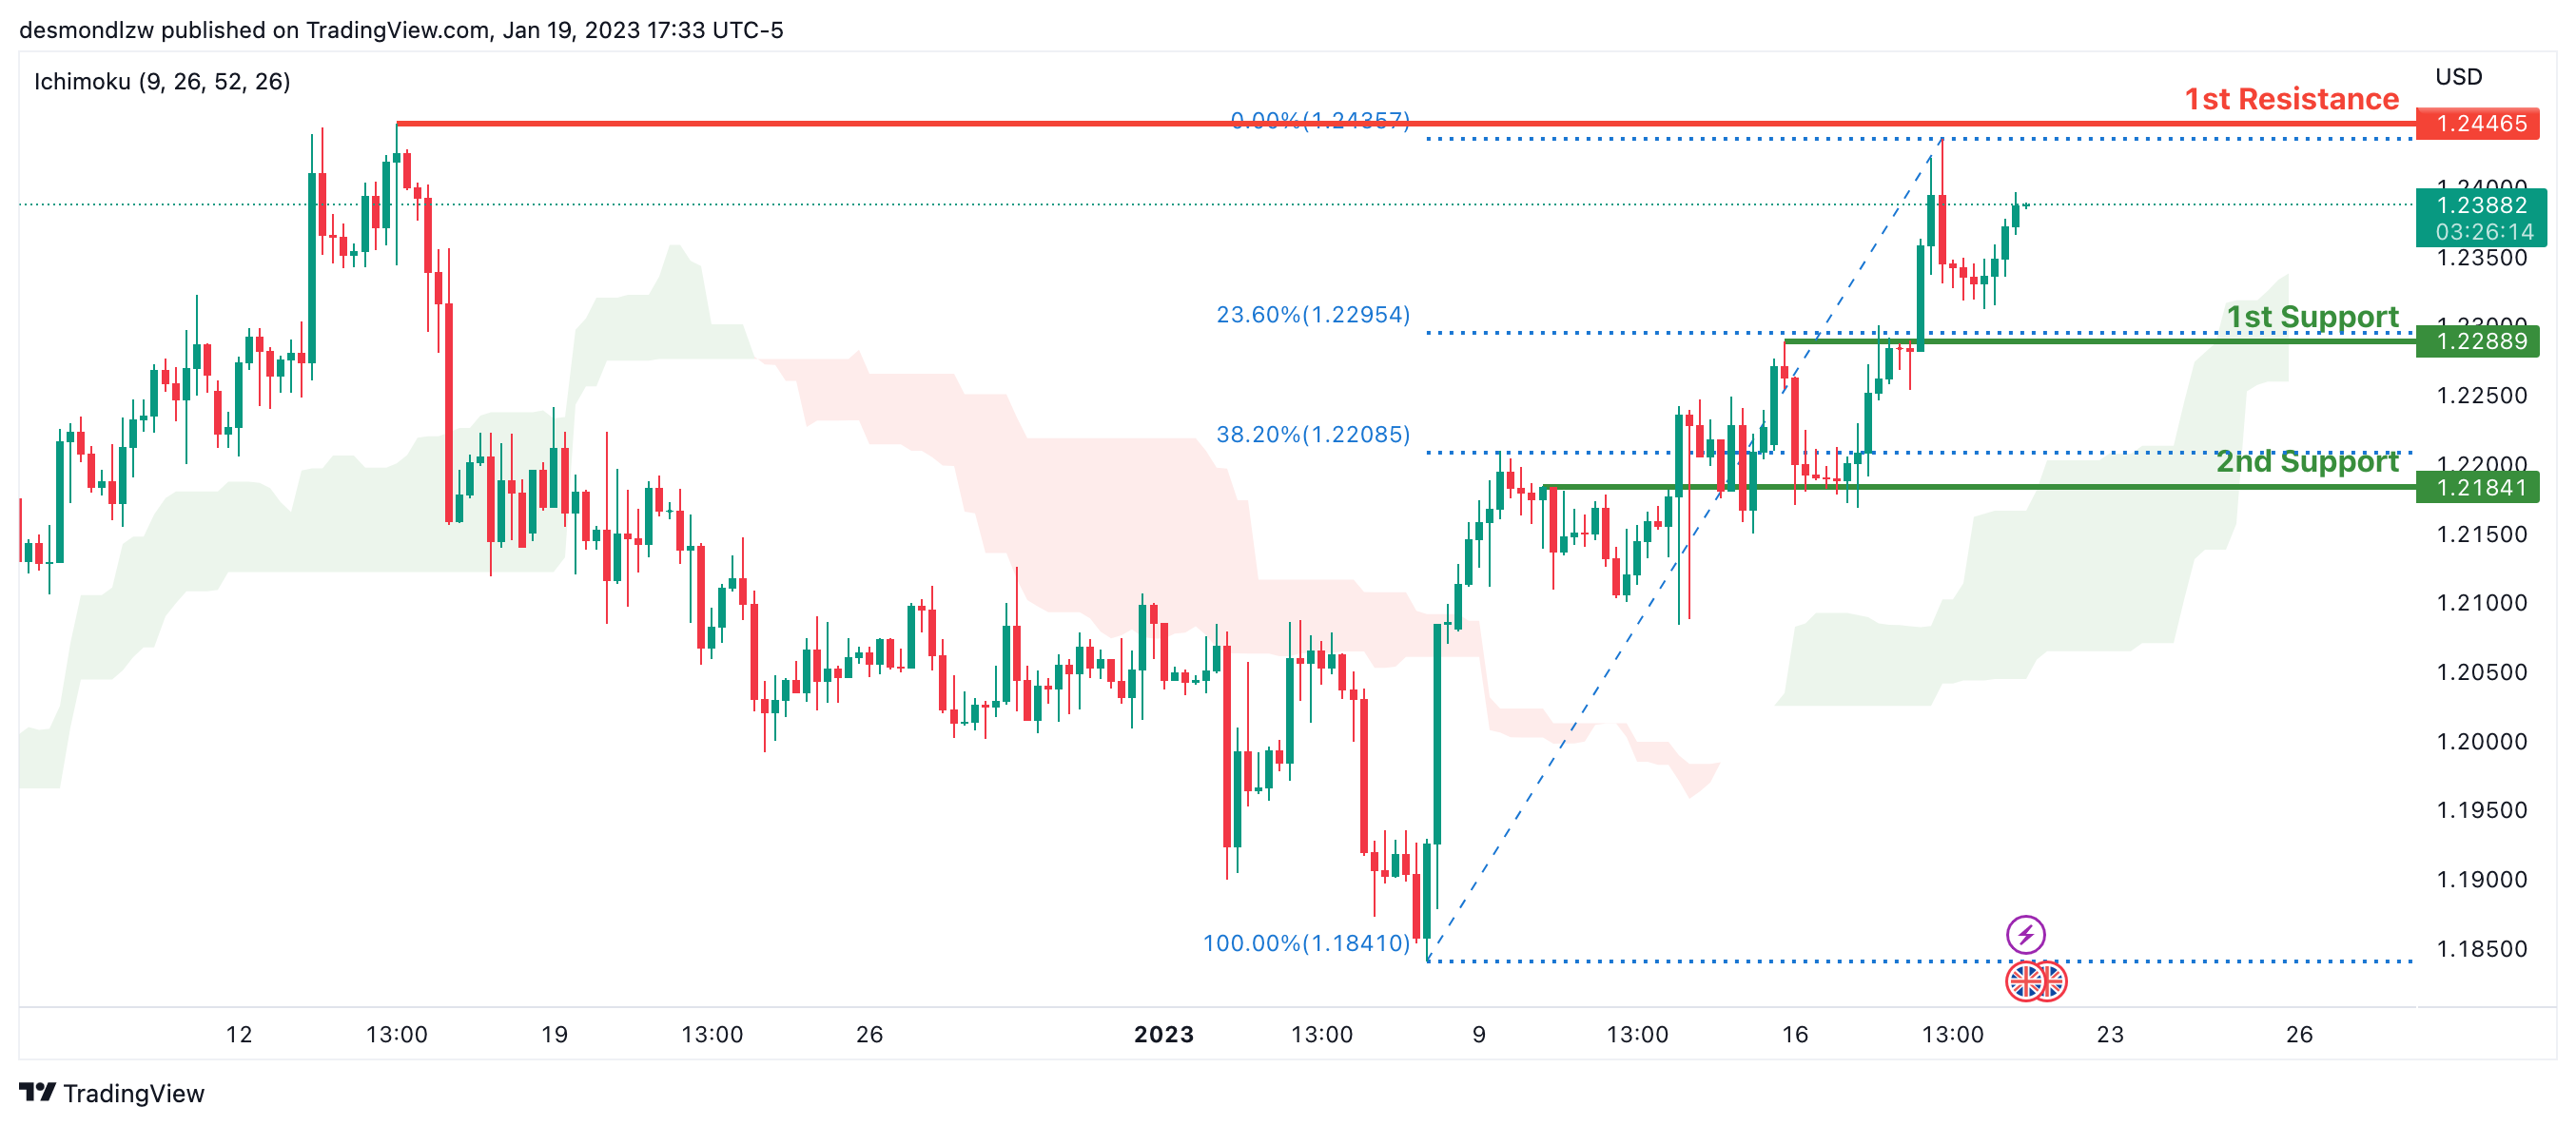
GBP/USD:
Looking at the H4 chart, my overall bias for GBPUSD is bullish due to the current price being above the Ichimoku cloud, indicating a bullish market. If this bullish momentum continues, expect price to possibly continue heading towards the 1st resistance line at 1.24465, where the previous swing high is. In an alternate scenario, price could possibly head back down and retest the 1st support at 1.22889, where the 23.6% Fibonacci line is.
Areas of consideration:
- H4 1st resistance at 1.24465
- H4 1st support at 1.22889
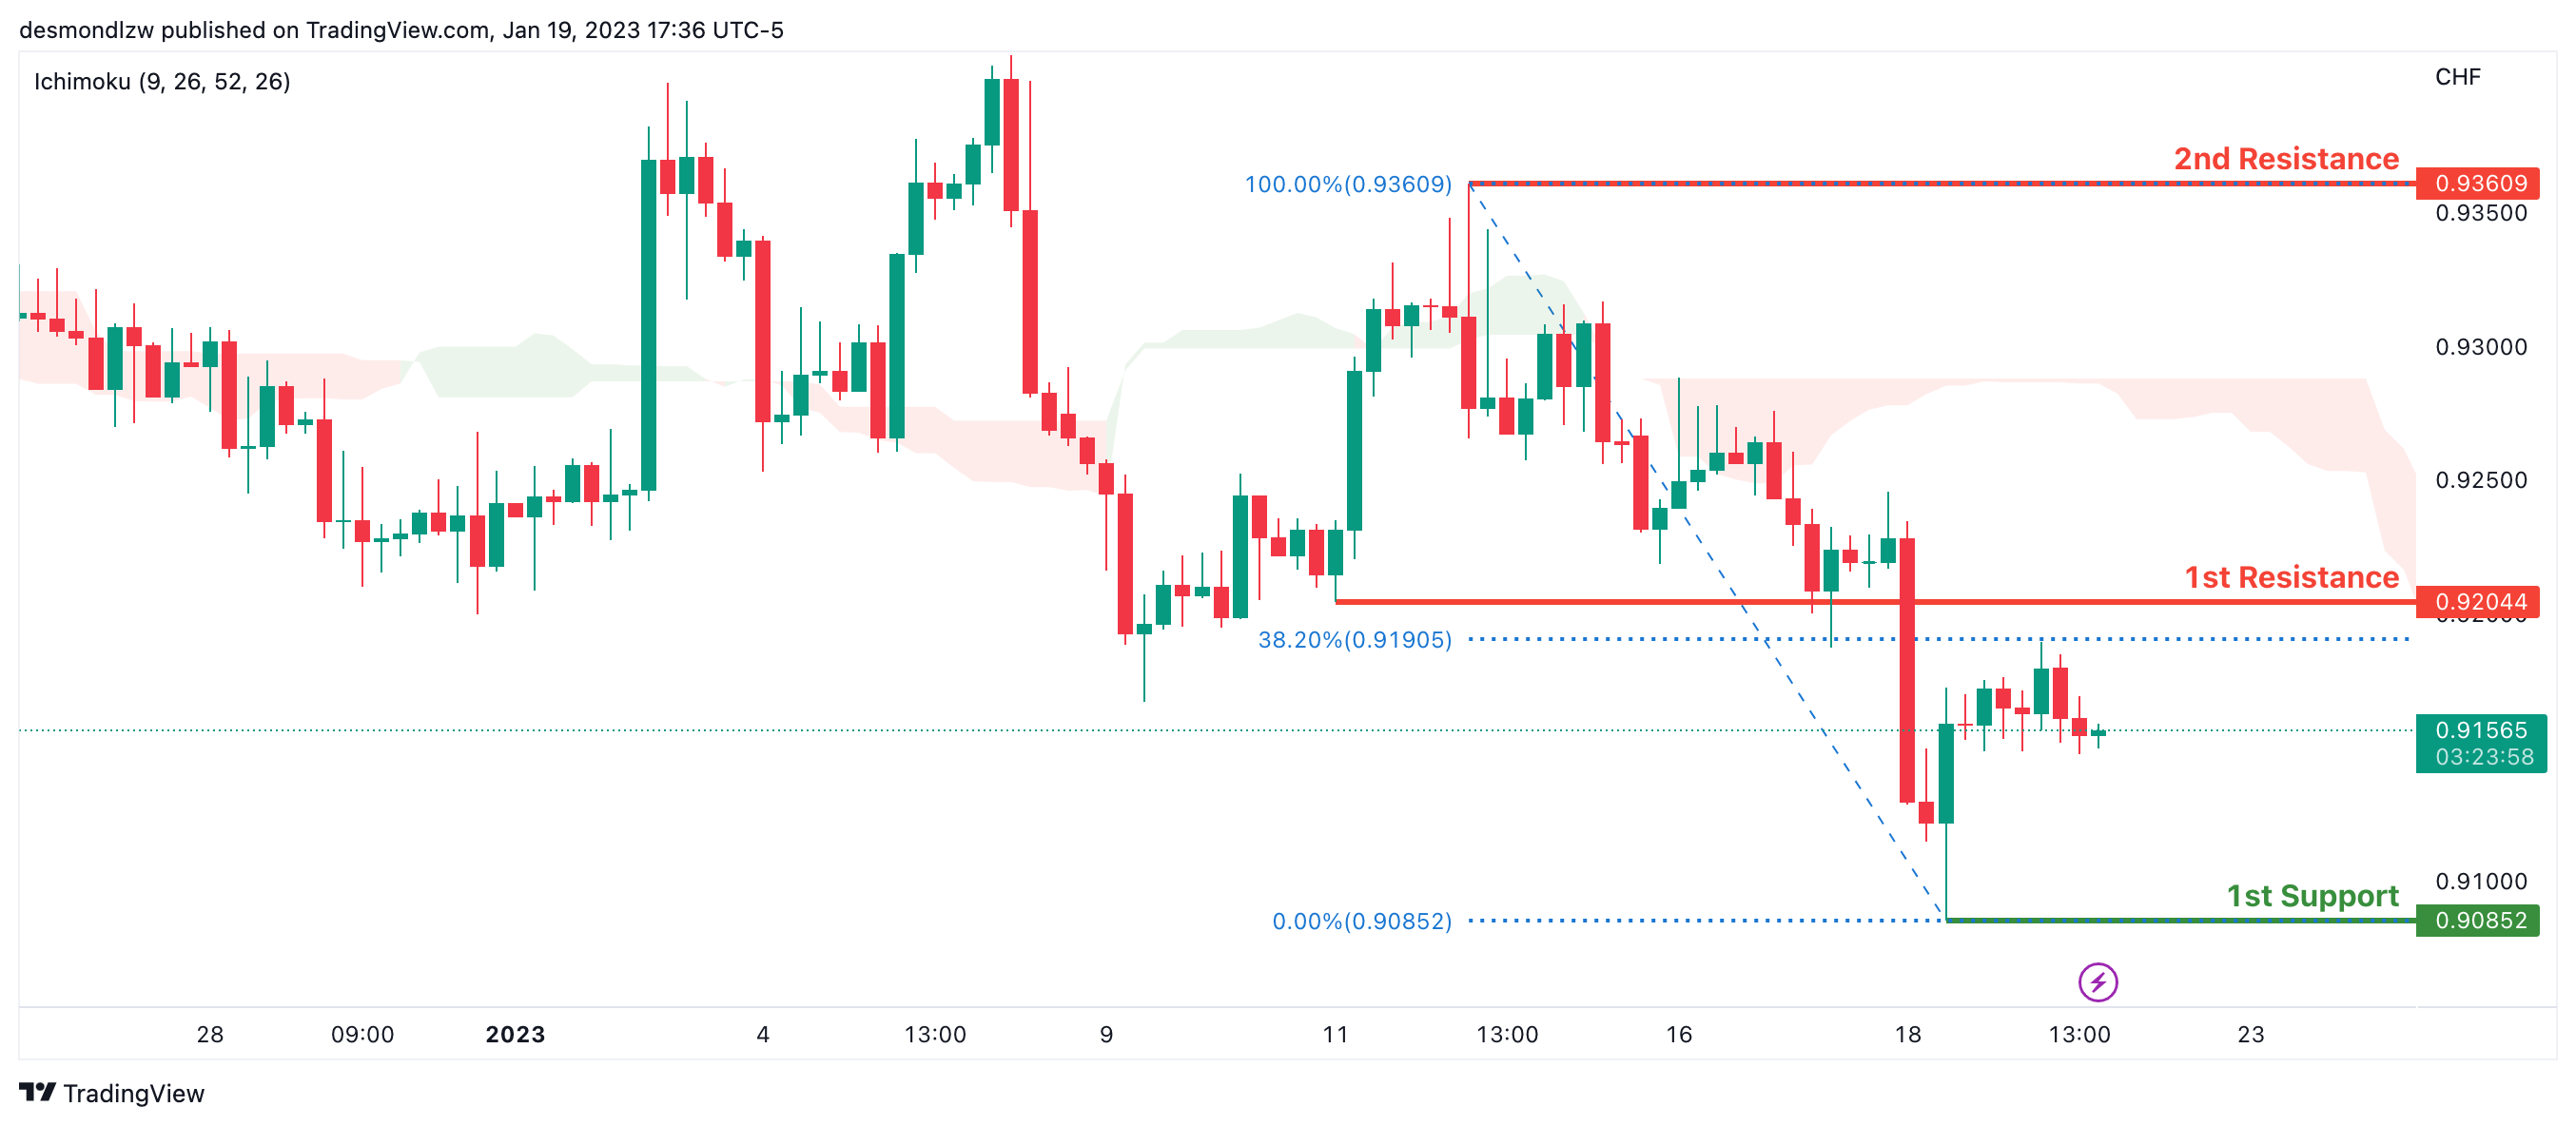
USD/CHF:
Looking at the H4 chart, my overall bias for USDCHF is bearish due to the current price crossing below the Ichimoku cloud, indicating a bearish market. If the current bearish trend continues, expect the price to possibly continue to head towards the 1st support at 0.90852, where the recent low is. In an alternative scenario, price could possibly head back up to retest the 1st resistance at 0.92044, where the 38.2% Fibonacci line is.
Areas of consideration
- H4 1st support at 0.90852
- H4 1st resistance at 0.92044
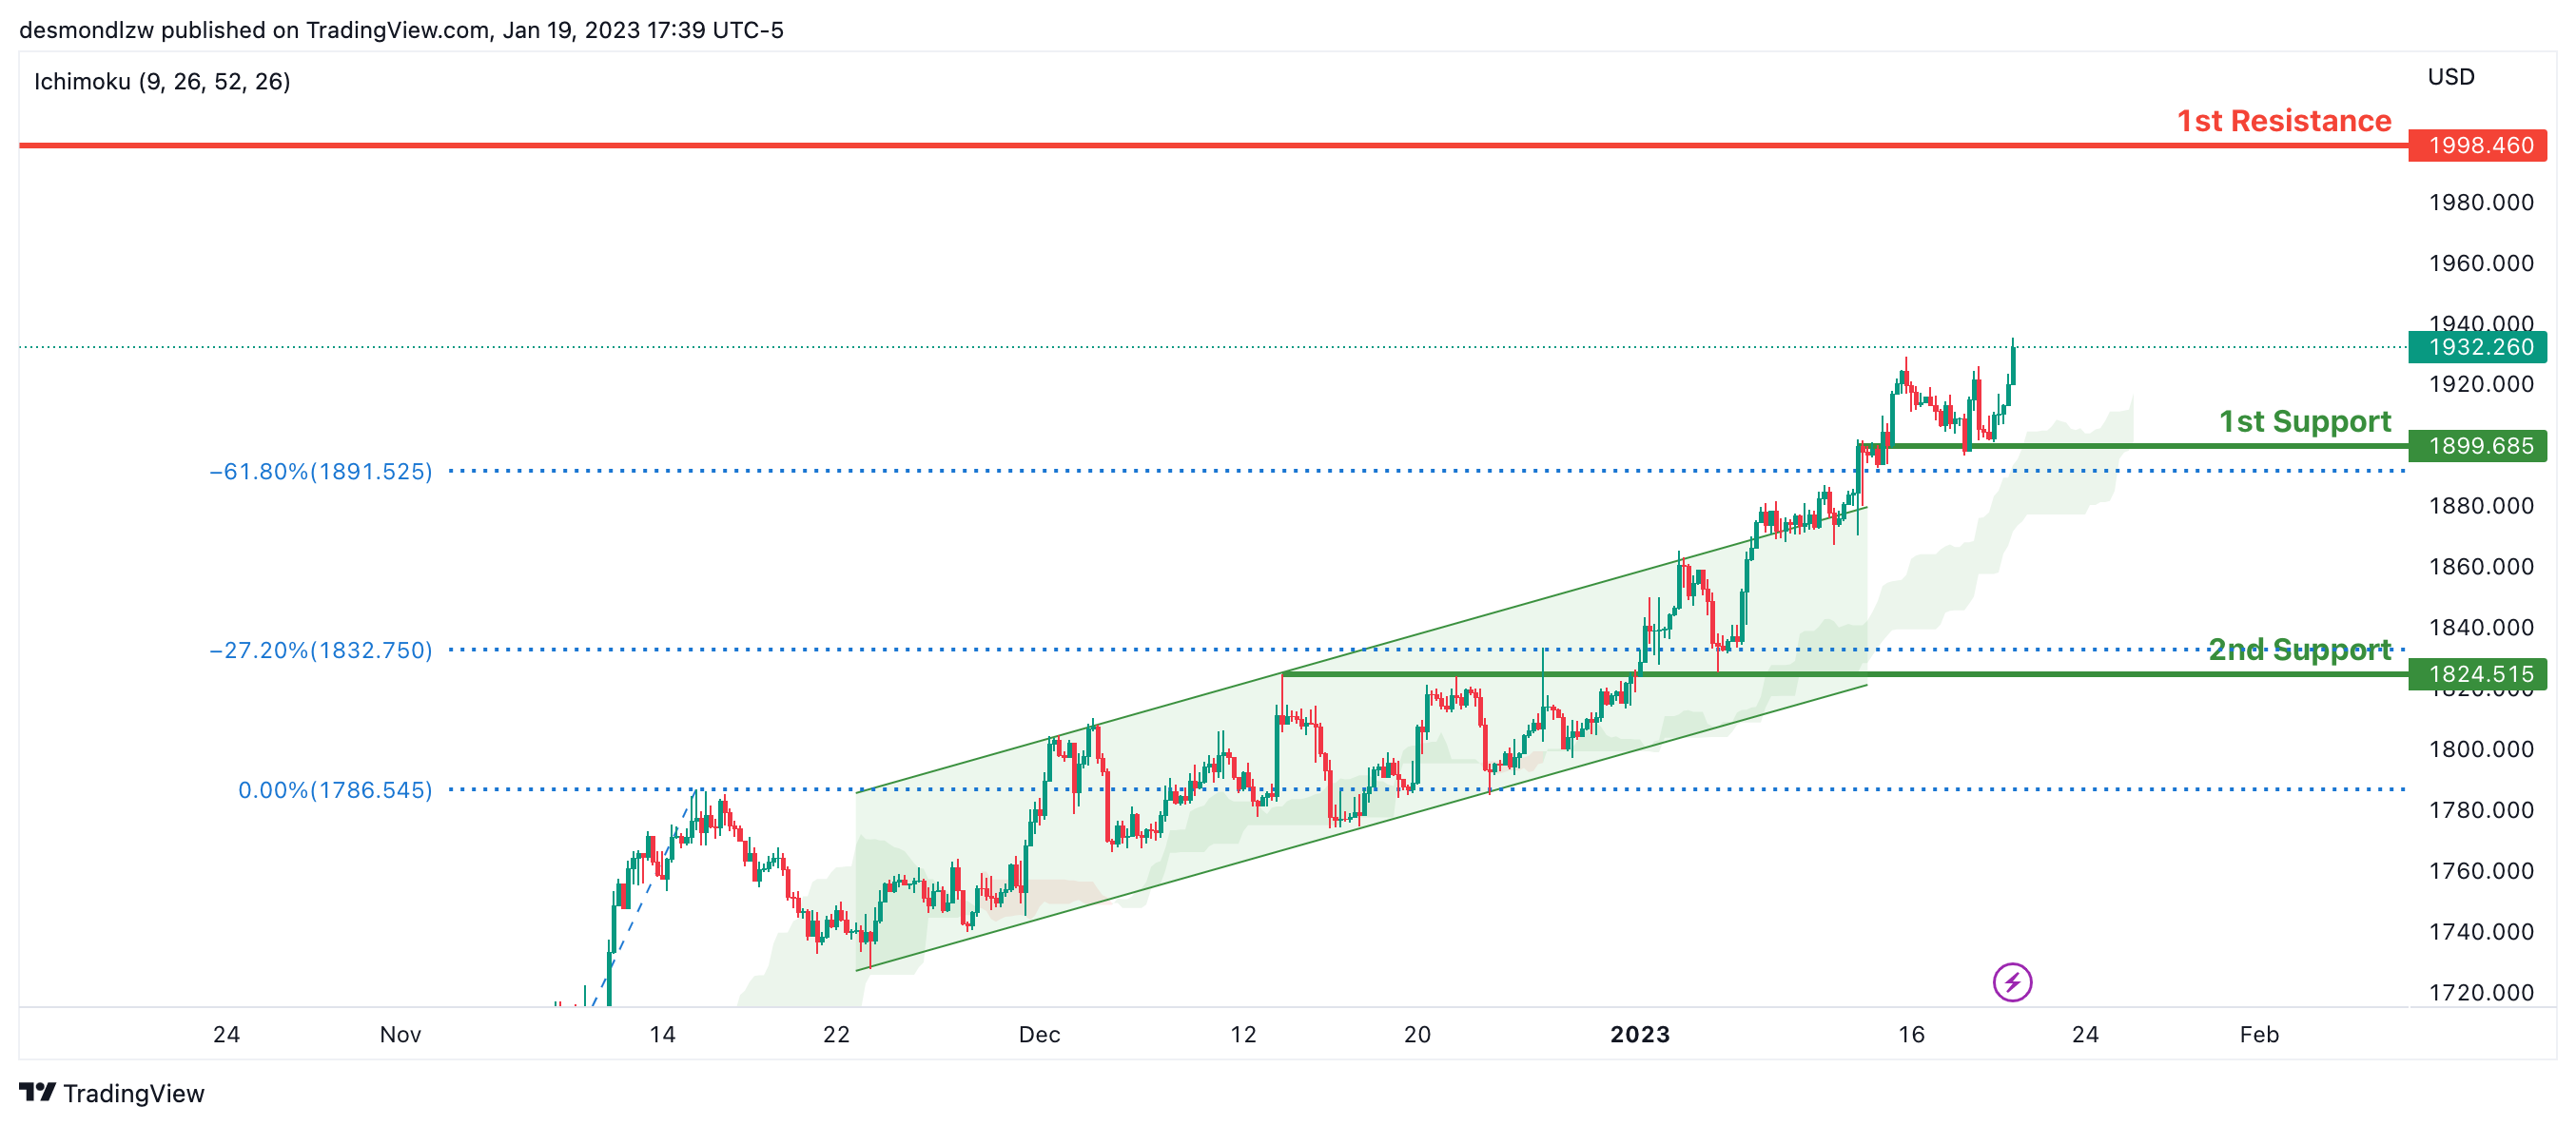
XAU/USD (GOLD):
Looking at the H4 chart, my overall bias for XAUUSD is bullish due to the current price crossing above the Ichimoku cloud, indicating a bullish market. To add support to this bias, price has also broken above the bullish ascending channel. If this bullish momentum continues, expect the price to possibly continue heading towards the 1st resistance at 1998.460, where the previous swing high is. In an alternative scenario, price could possibly head back down to retest the 1st support at 1899.685 where the -61.8% Fibonacci expansion line is.
Areas of consideration:
- H4 time frame, 1st resistance at 1998.460
- H4 time frame, 1st support at 1899.685
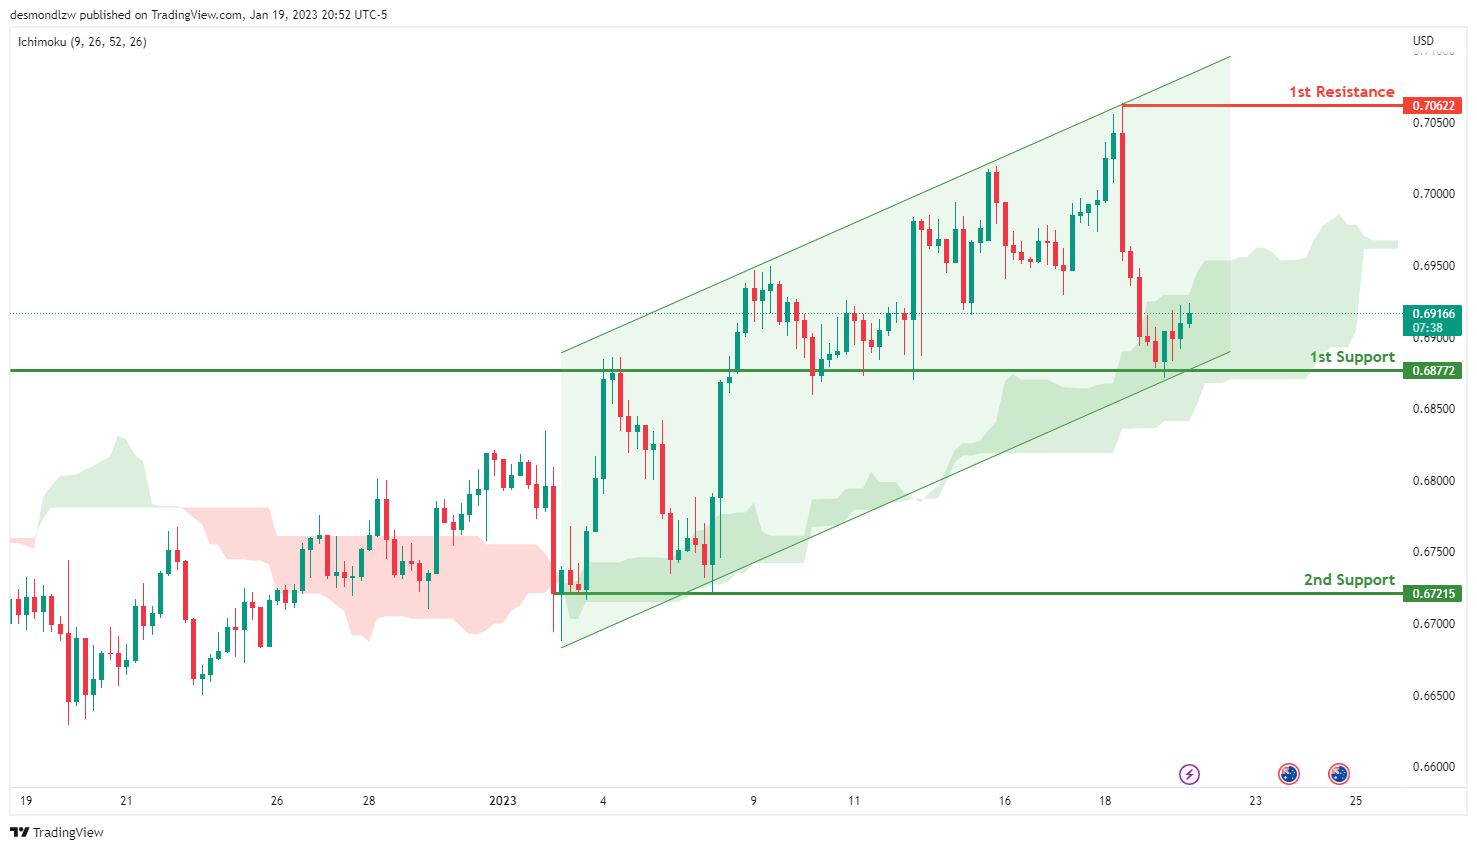
AUD/USD:
Looking at the H4 chart, we can see that the 1st support is at 0.68722 which is an overlap support. Yesterday the price is trying to break through , but did not. This shows 1st support is still very strong. With yesterday price moment, a very clear strong uptrend was created. The price is moving towards the 1st resistance is at0.67215 which is a recent swing high.
In an alternative scenario, the price may also break the 1st support line, and moving to the 2nd support line which is at 0.67215.
Areas of consideration
- H4. 1st resistance at 0.67215
- H4, 1st support at 0.68722
- H4.2nd support at 0.67215
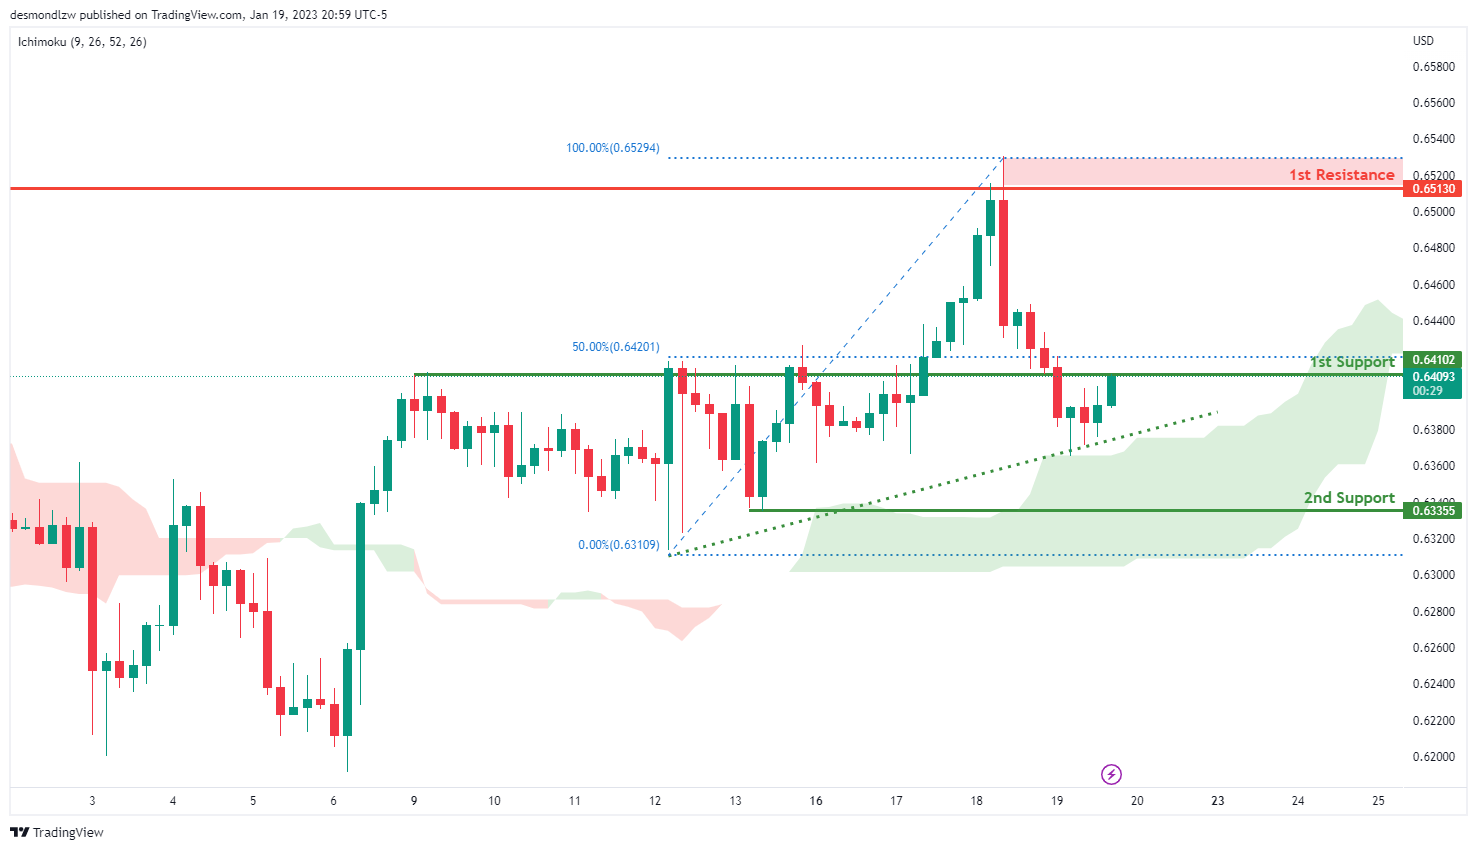
NZD/USD:
Looking at the H4 chart, we can see that the 1st support is at 0.64102 which is an overlap support where is in line with 50% Fibonacci line. If price breaks this level, we could see it drop to 2nd support is down at 0.63355. As the current price is above the Ichimoku cloud and there is an ascending trend line , which suggests the bullish momentum.
For the resistance, our 1st resistance is at 0.65130 which is a recent swing high resistance area.
Areas of consideration:
- H4 time frame, 1st resistance at 0.65130
- H4 time frame, 1st support at 0.64102
- H4 time frame, 2nd support at 0.63355
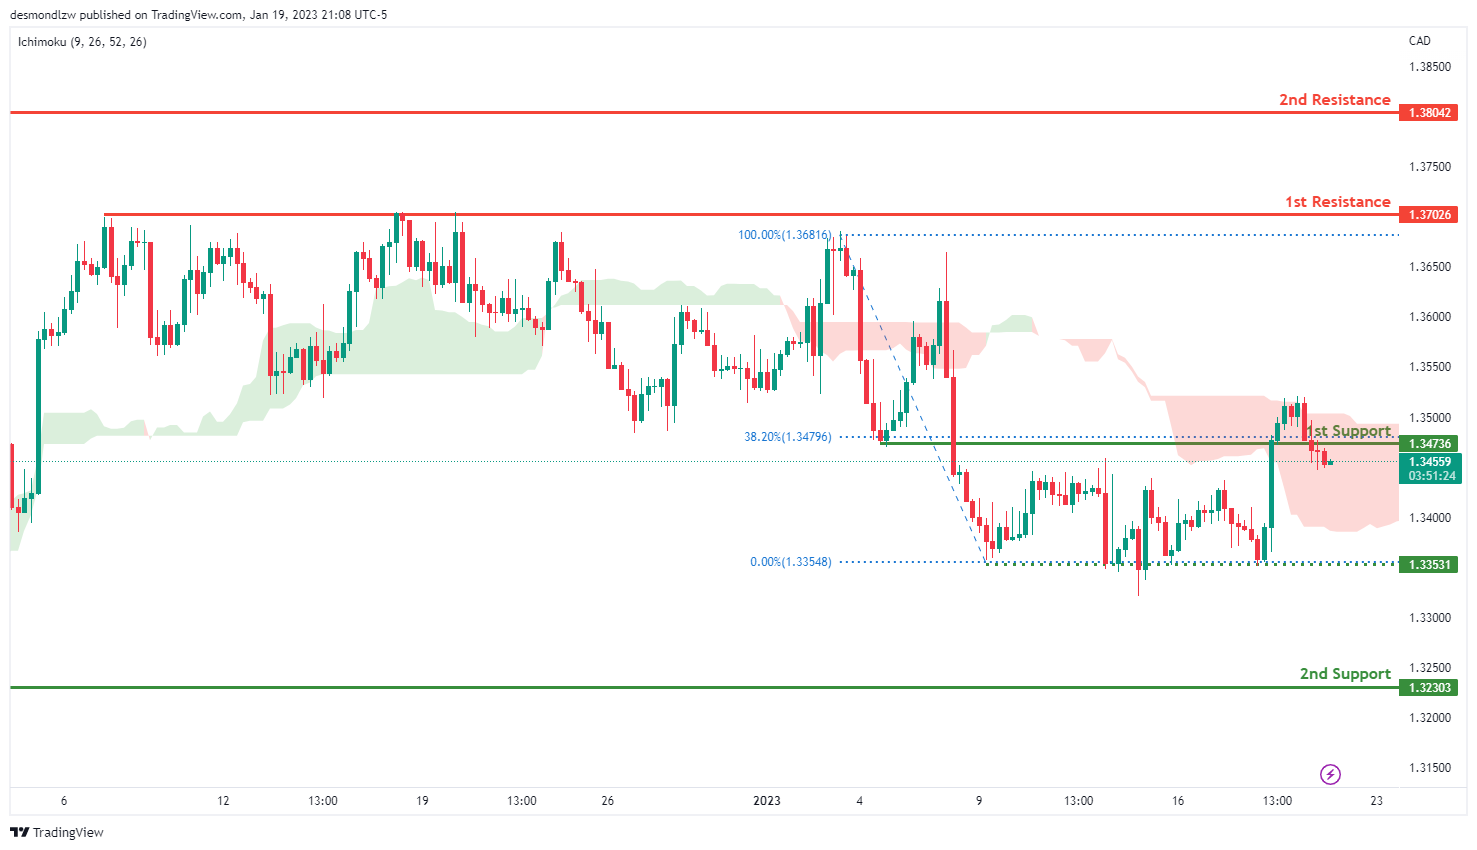
USD/CAD:
On the H4 chart, the 1st support is at 1.34736 which is an overlap support. The 1st support line also at 38.2% Fibonacci retracement. And the 2nd support 1.32303 which is the recent swing low .There is an intermediate support level at 1.33531.
In terms of resistance, the 1st resistance we can see is at 1.37026 which is the recent swing high. If the price breaks this level, it could go up to the 2nd resistance at 1.38042.
Areas of consideration:
- H4 time frame. 2nd resistance at 1.38069
- H4 time frame, 1st resistance at 1.37049
- H4 time frame, 1st support at 1.34736
- H4 time frame. Intermediate resistance at 1.33531
- H4 time frame, 2nd support at 1.32303
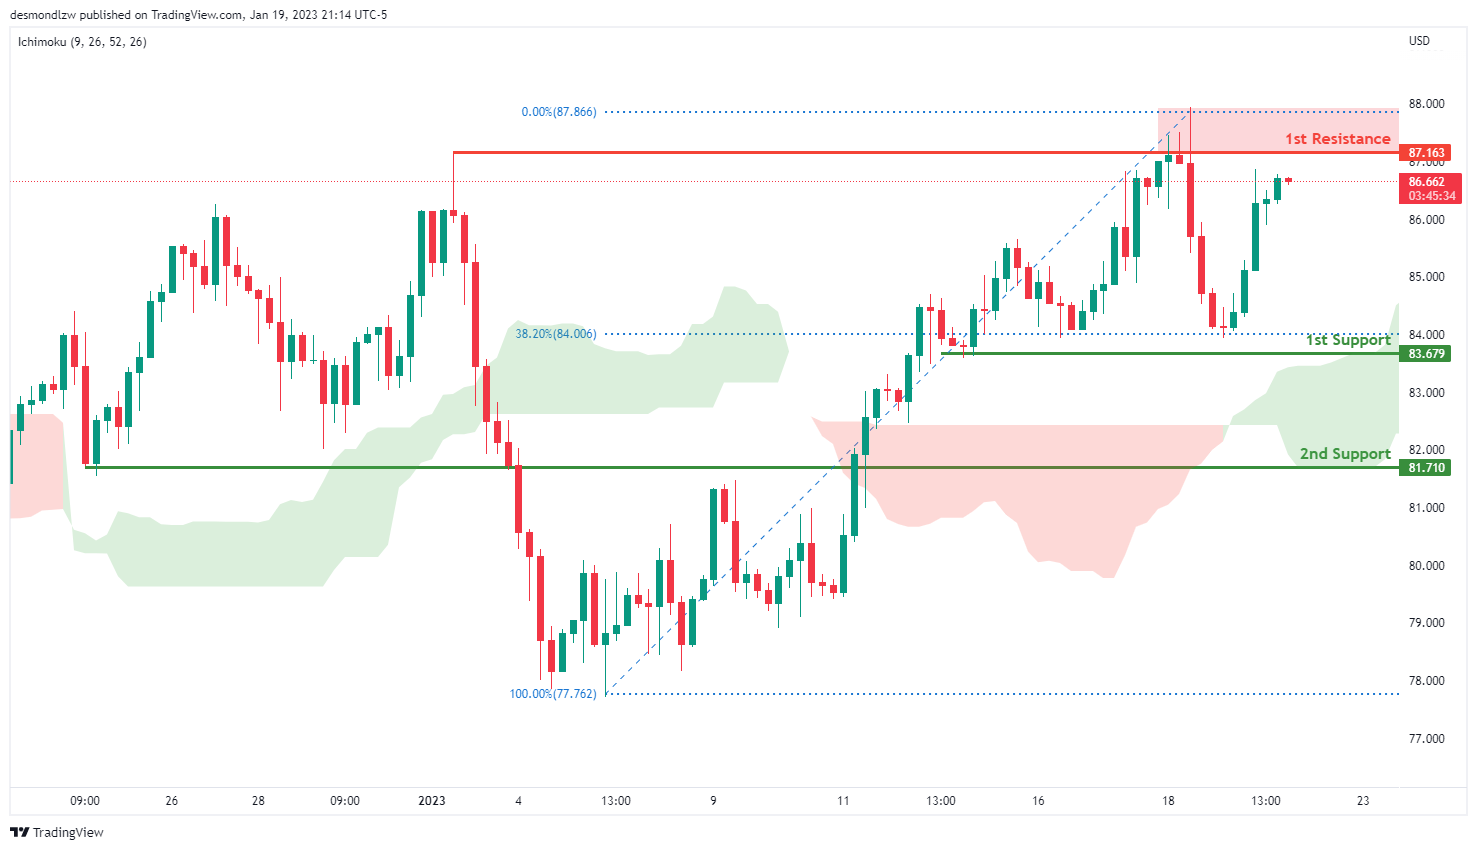
OIL:
Looking at the H4 chart, we can see that the 1st resistance is at 87.163 which is an overlap area.
In terms of support, we can see our 1st support at 83.679 which is overlap support. It is also in line with 38.2% retracement. Breaking this level would trigger a further drop to our 2nd support at 81.710 /
Areas of consideration:
- H4 time frame, 1st resistance at 87.163
- H4 time frame,1st support at 83.679
- Hr time frame, 2nd support at 81.710
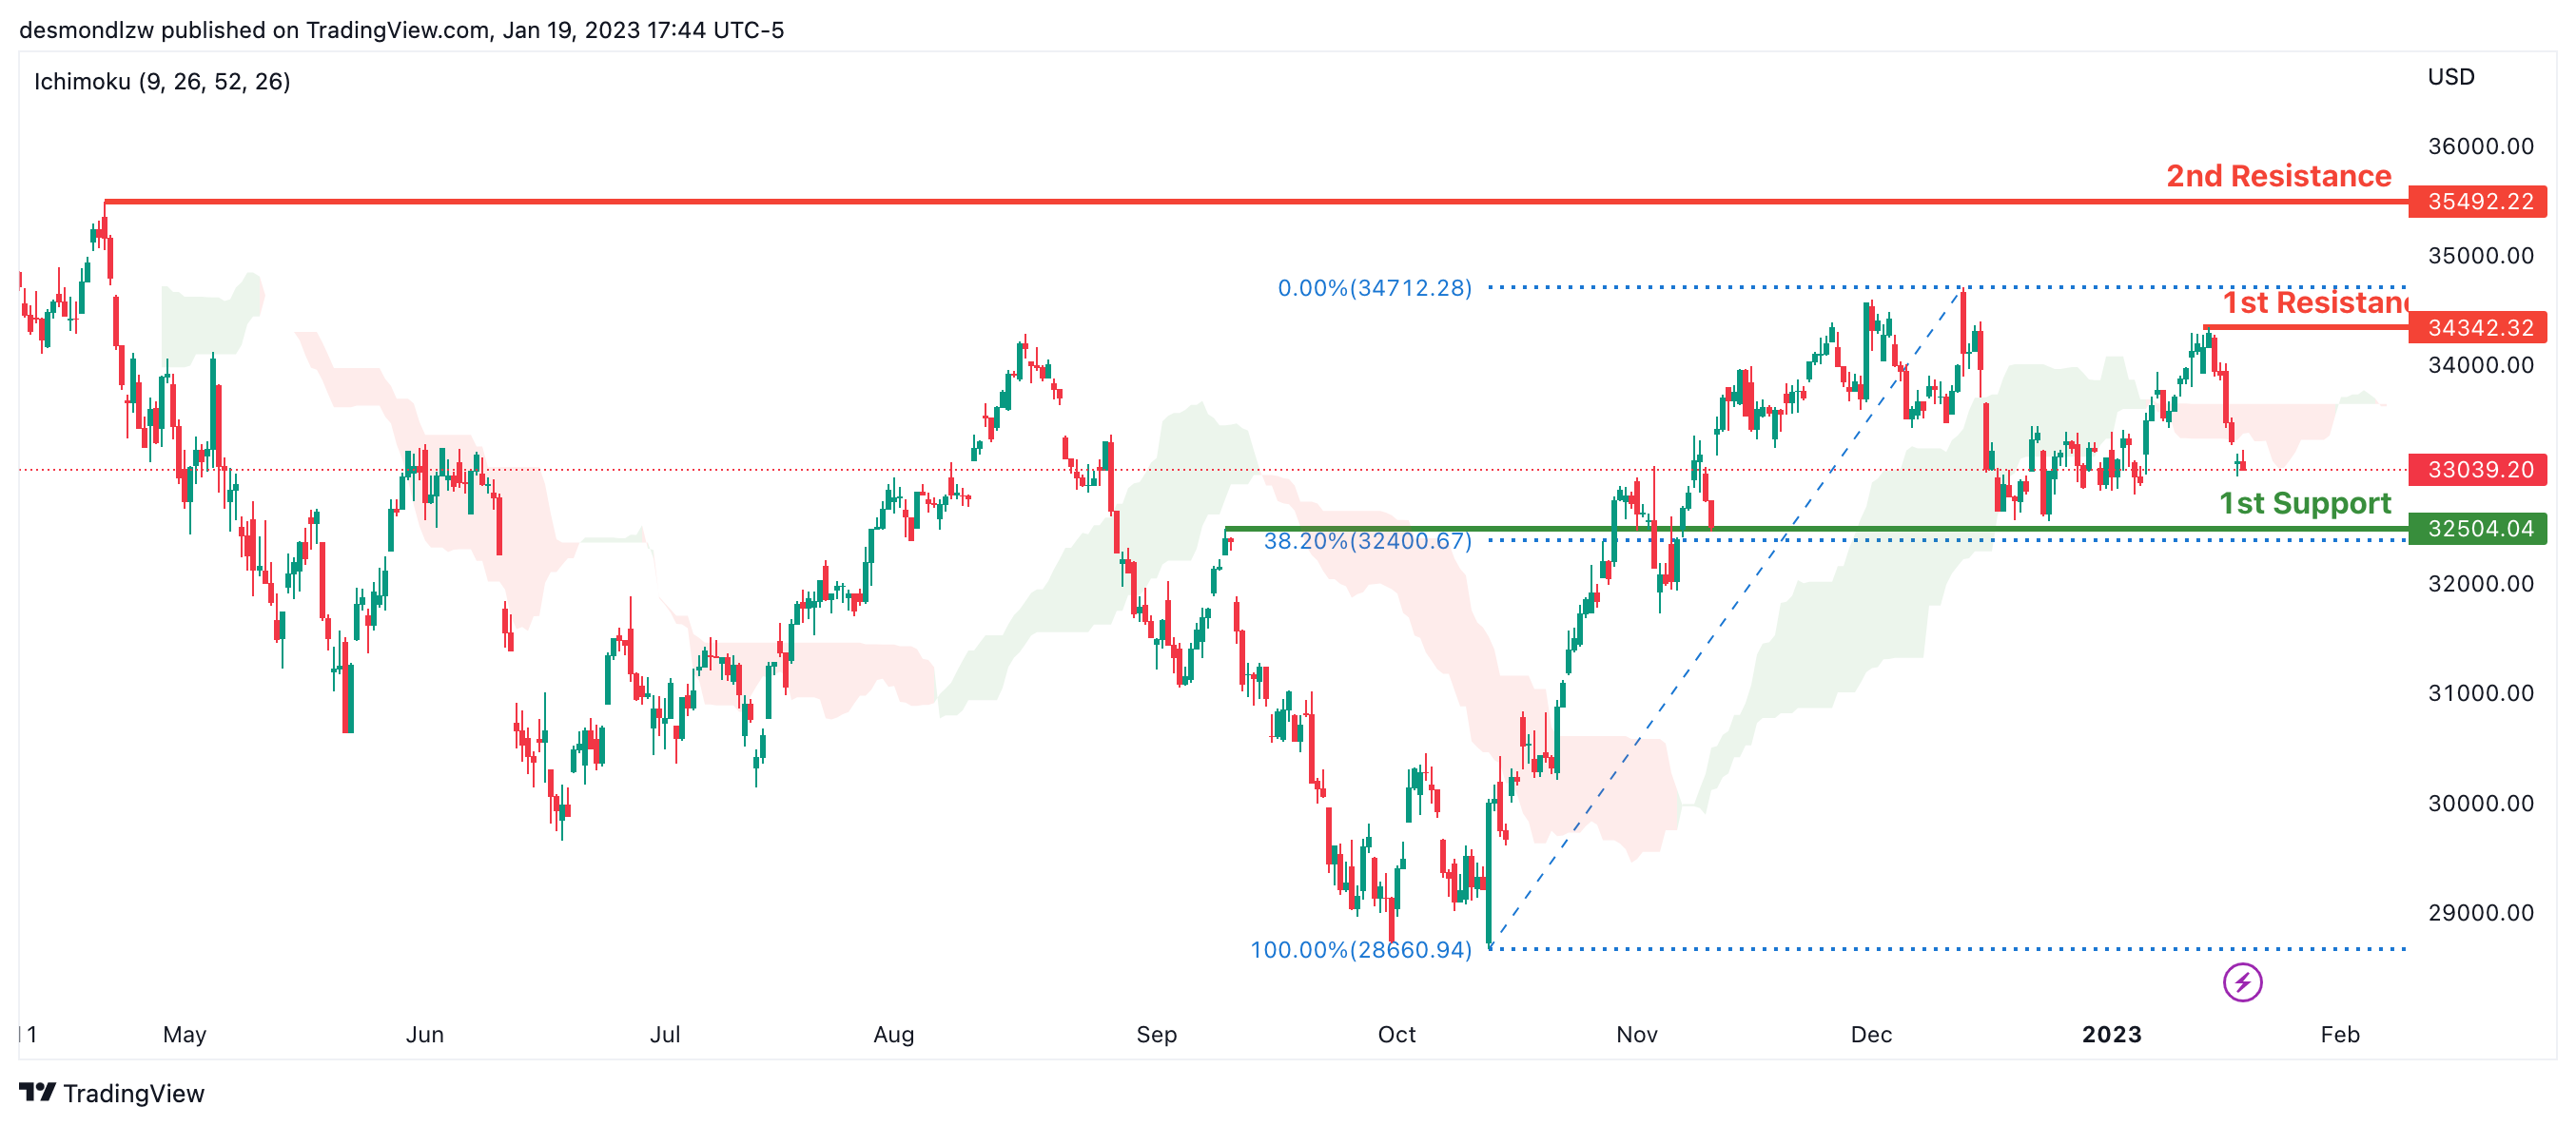
Dow Jones Industrial Average:
On the H4 chart, the overall bias for DJI is bullish. To add confluence to this, the price is crossing above the Ichimoku cloud which indicates a bullish market. If this bullish momentum continues, expect the price to possibly continue heading towards the 1st resistance line at 34712.28, where the recent swing high is. In an alternative scenario, price could possibly head back down towards the 1st support at 32581.97, slightly above where the 38.2% Fibonacci line is.
Areas of consideration:
- H4 time frame, 1st support at 32581.97
- H4 time frame, 1st Resistance at 34712.28
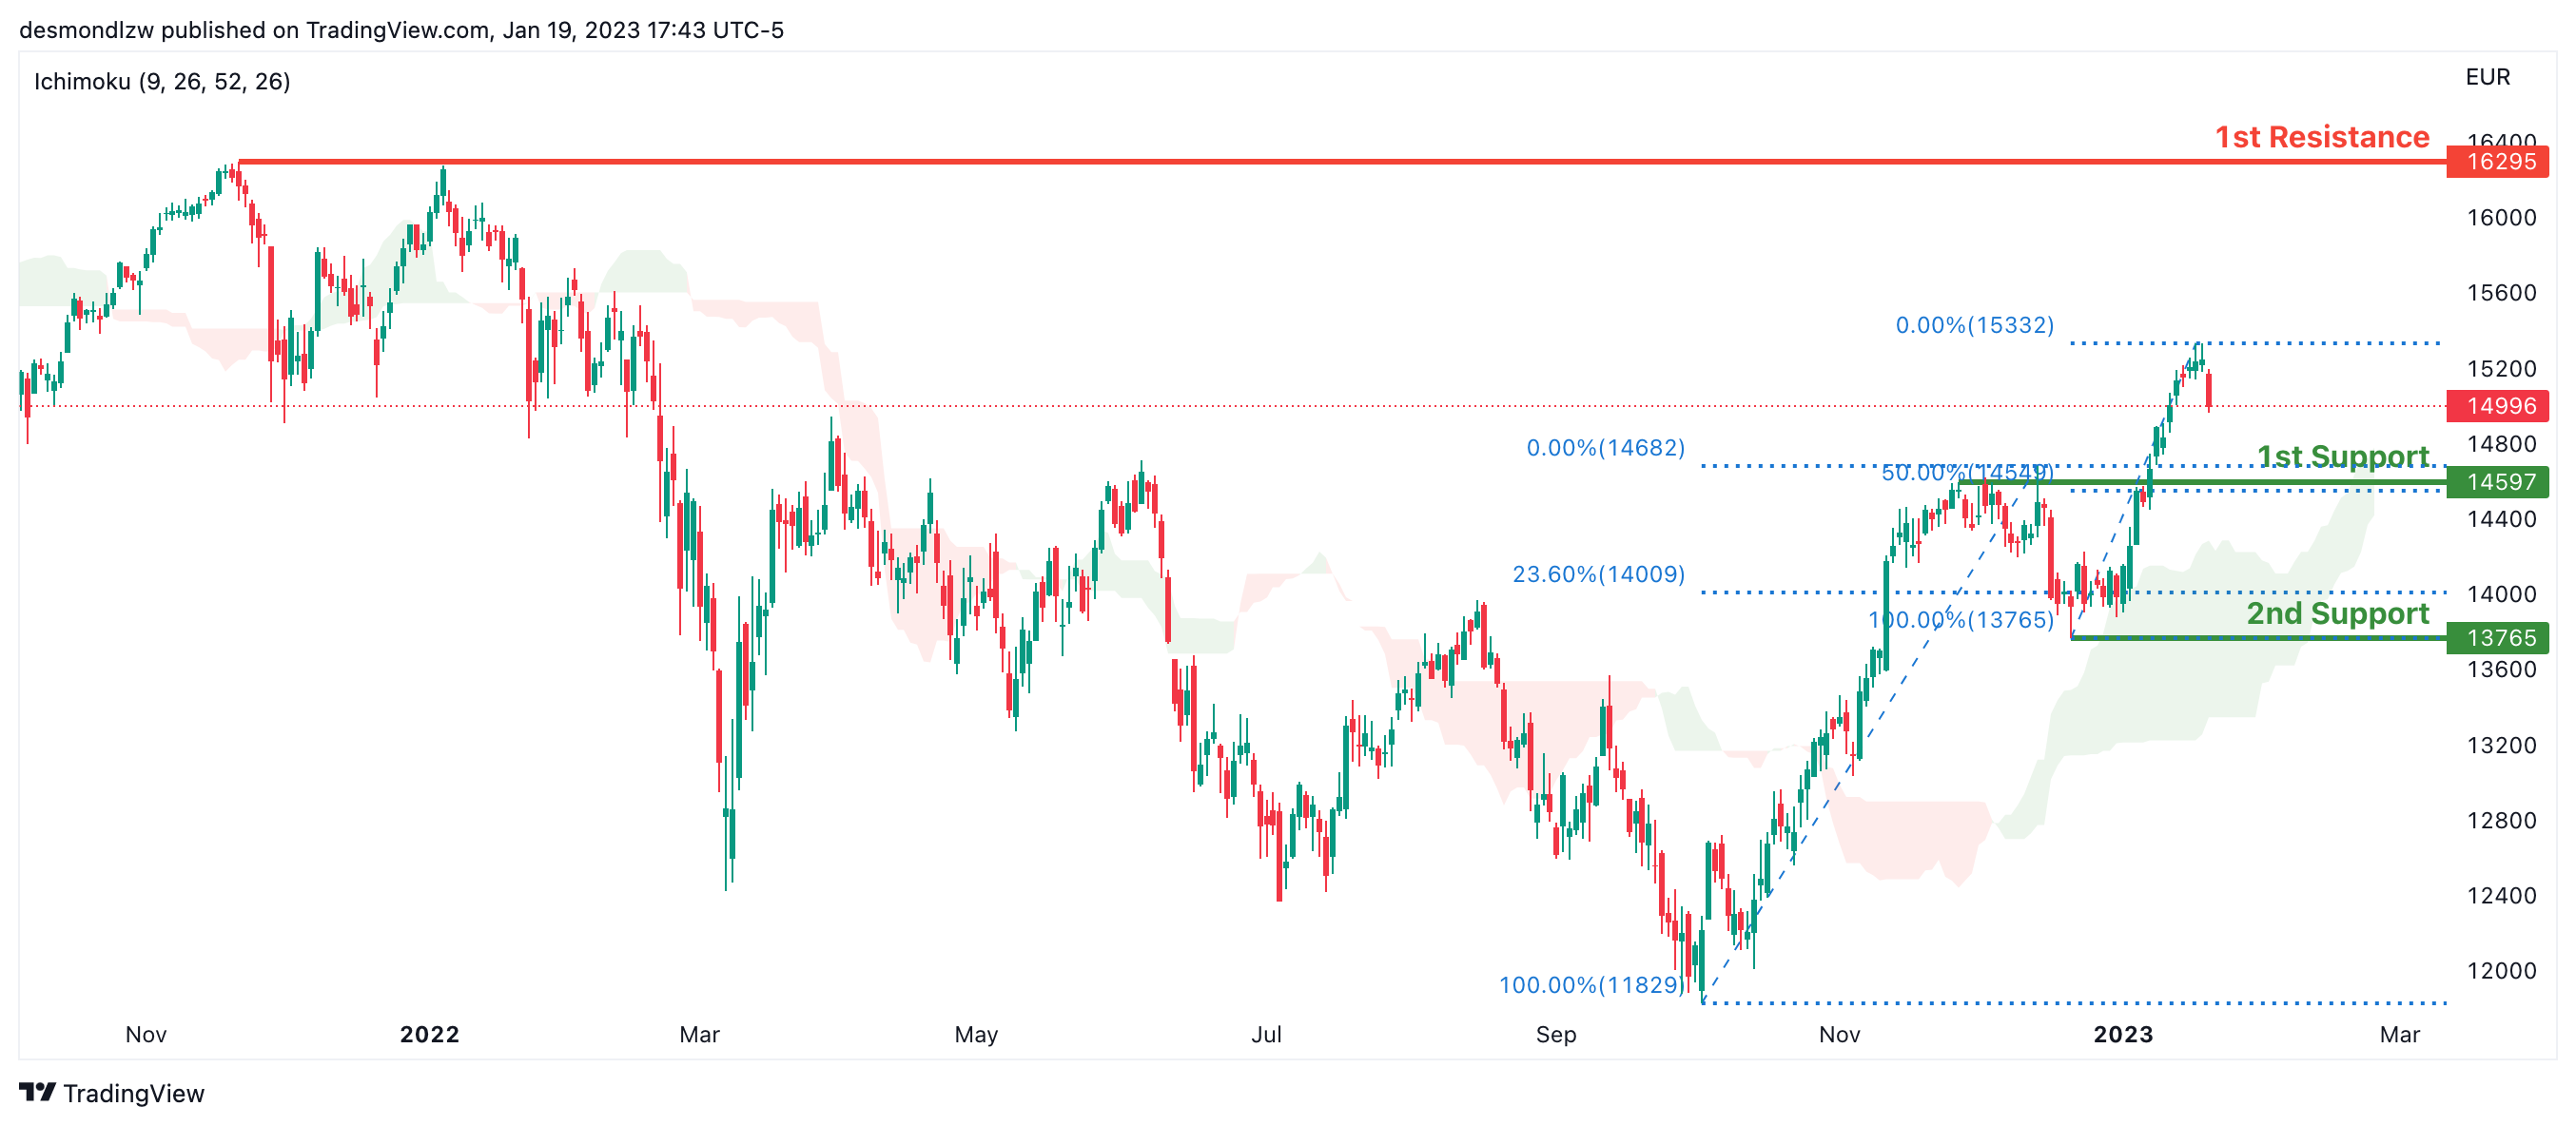
DAX:
Looking at the Daily chart, my overall bias for DAX is bullish due to the current price crossing above the Ichimoku cloud, indicating a bullish market. If this bullish momentum continues, expect the price to possibly head towards the 1st resistance line at 16295, where the previous swing high is. In an alternative scenario, price could possibly head down to retest the 1st support at 14597, where the 50% Fibonacci line is.
Areas of consideration:
- H4 time frame, 1st resistance is at 16295
- H4 time frame, 1st support is at 14597
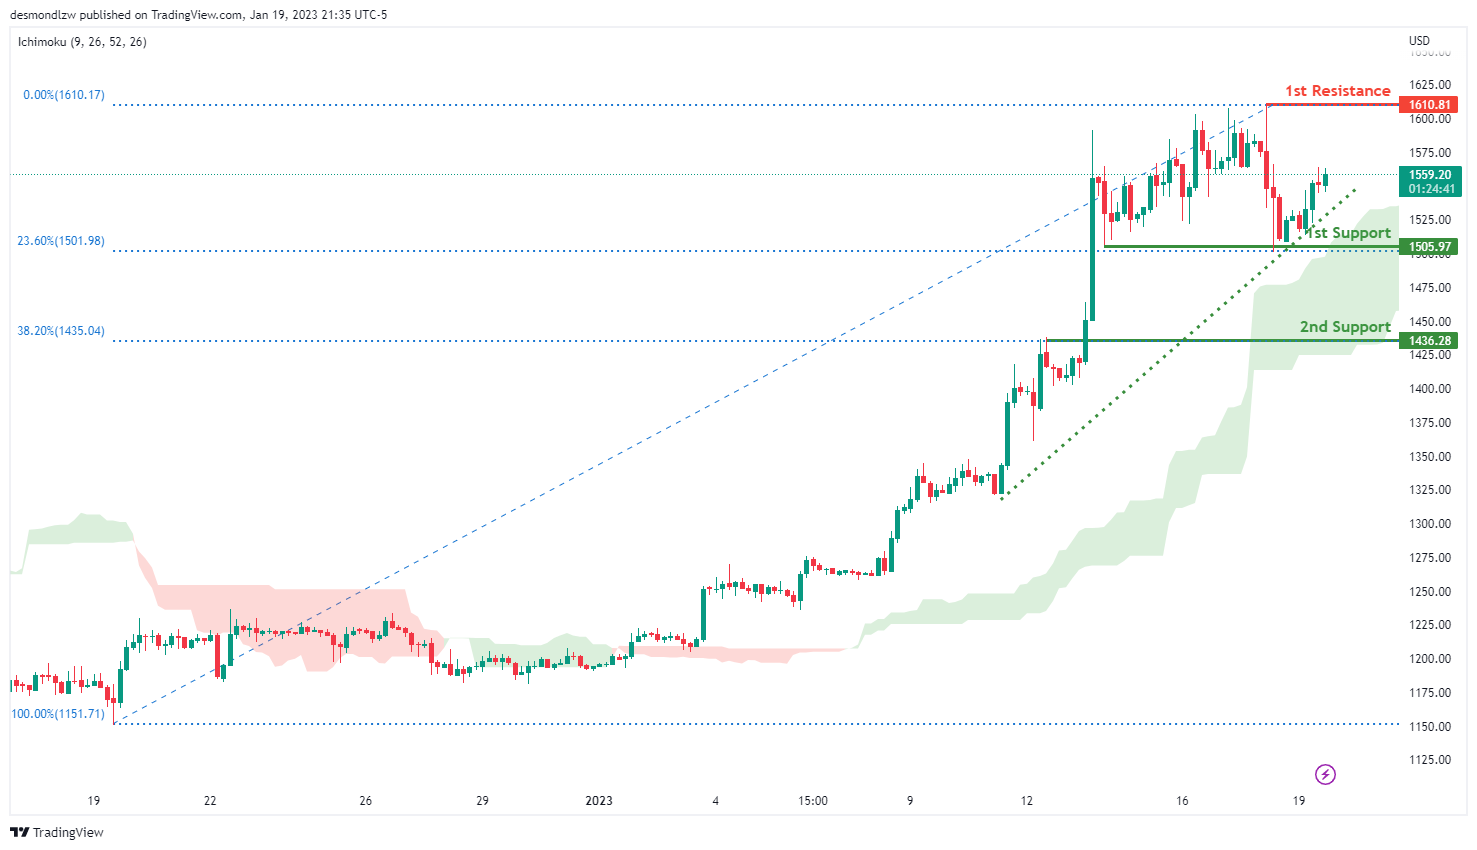
ETHUSD:
Looking at the H4 chart, my overall bias for ETHUSD is bullish due to the current price crossing above the Ichimoku cloud, indicating a bullish market. If this bullish momentum continues, expect the price move to the 1st support at 1505.97 which is recent overlap swing low. It is also in line with the 23.6% Fibonacci line And it may head to the 1st resistance at 1610.81 where the previous swing high is. In an alternative scenario, if the price break through the 1st support line, the price may further down to the 2nd support line 1433.59 where is 38.2% Fibonacci line is.
Areas of consideration:
- H4 time frame, 1st resistance of 1610.81
- H4 time frame, 1st support at 1505.97
- H4 time frame, 2nd support at 1433.59
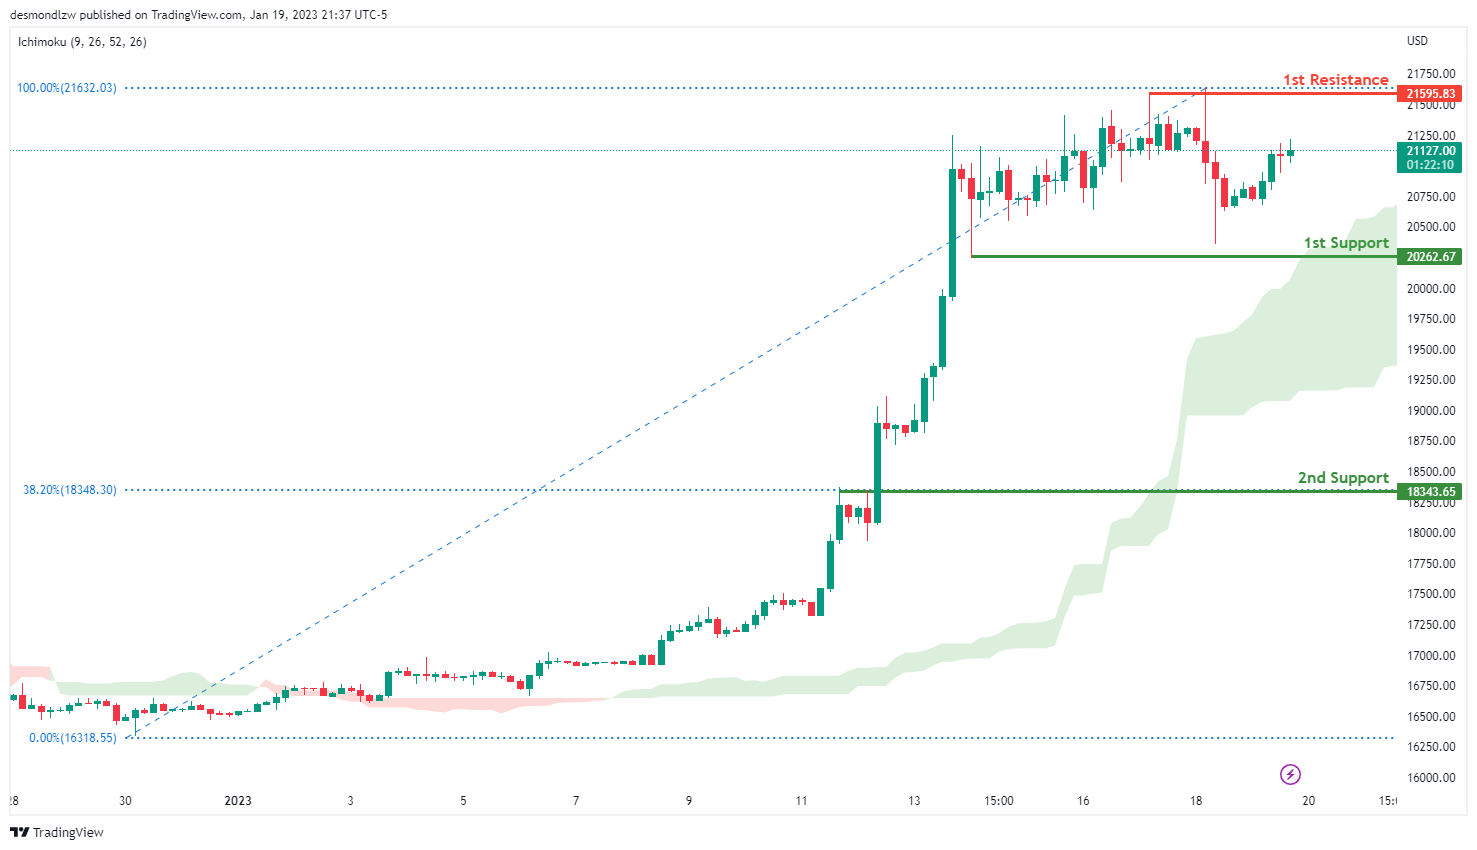
BTCUSD:
Looking at the H4 chart, my overall bias for BTCUSD is bullish due to the current price being above the Ichimoku cloud, indicating a bullish market. If this bullish momentum continues, expect the price to possibly break the 1st resistance at 21595.83 which is the recent swing high area. In an alternative scenario, the price could possibly head back down to retest the 1st support at 20262.67 .The 2nd support line is at 18343.65 where 100% Fibonacci projection and 38.2% Fibonacci rertracement are.
Areas of consideration:
- H4 time frame, 1st resistance 21595.83
- H4 time frame, 1st support at 20262.67
- H4 time frame, 2nd support at 18343.65
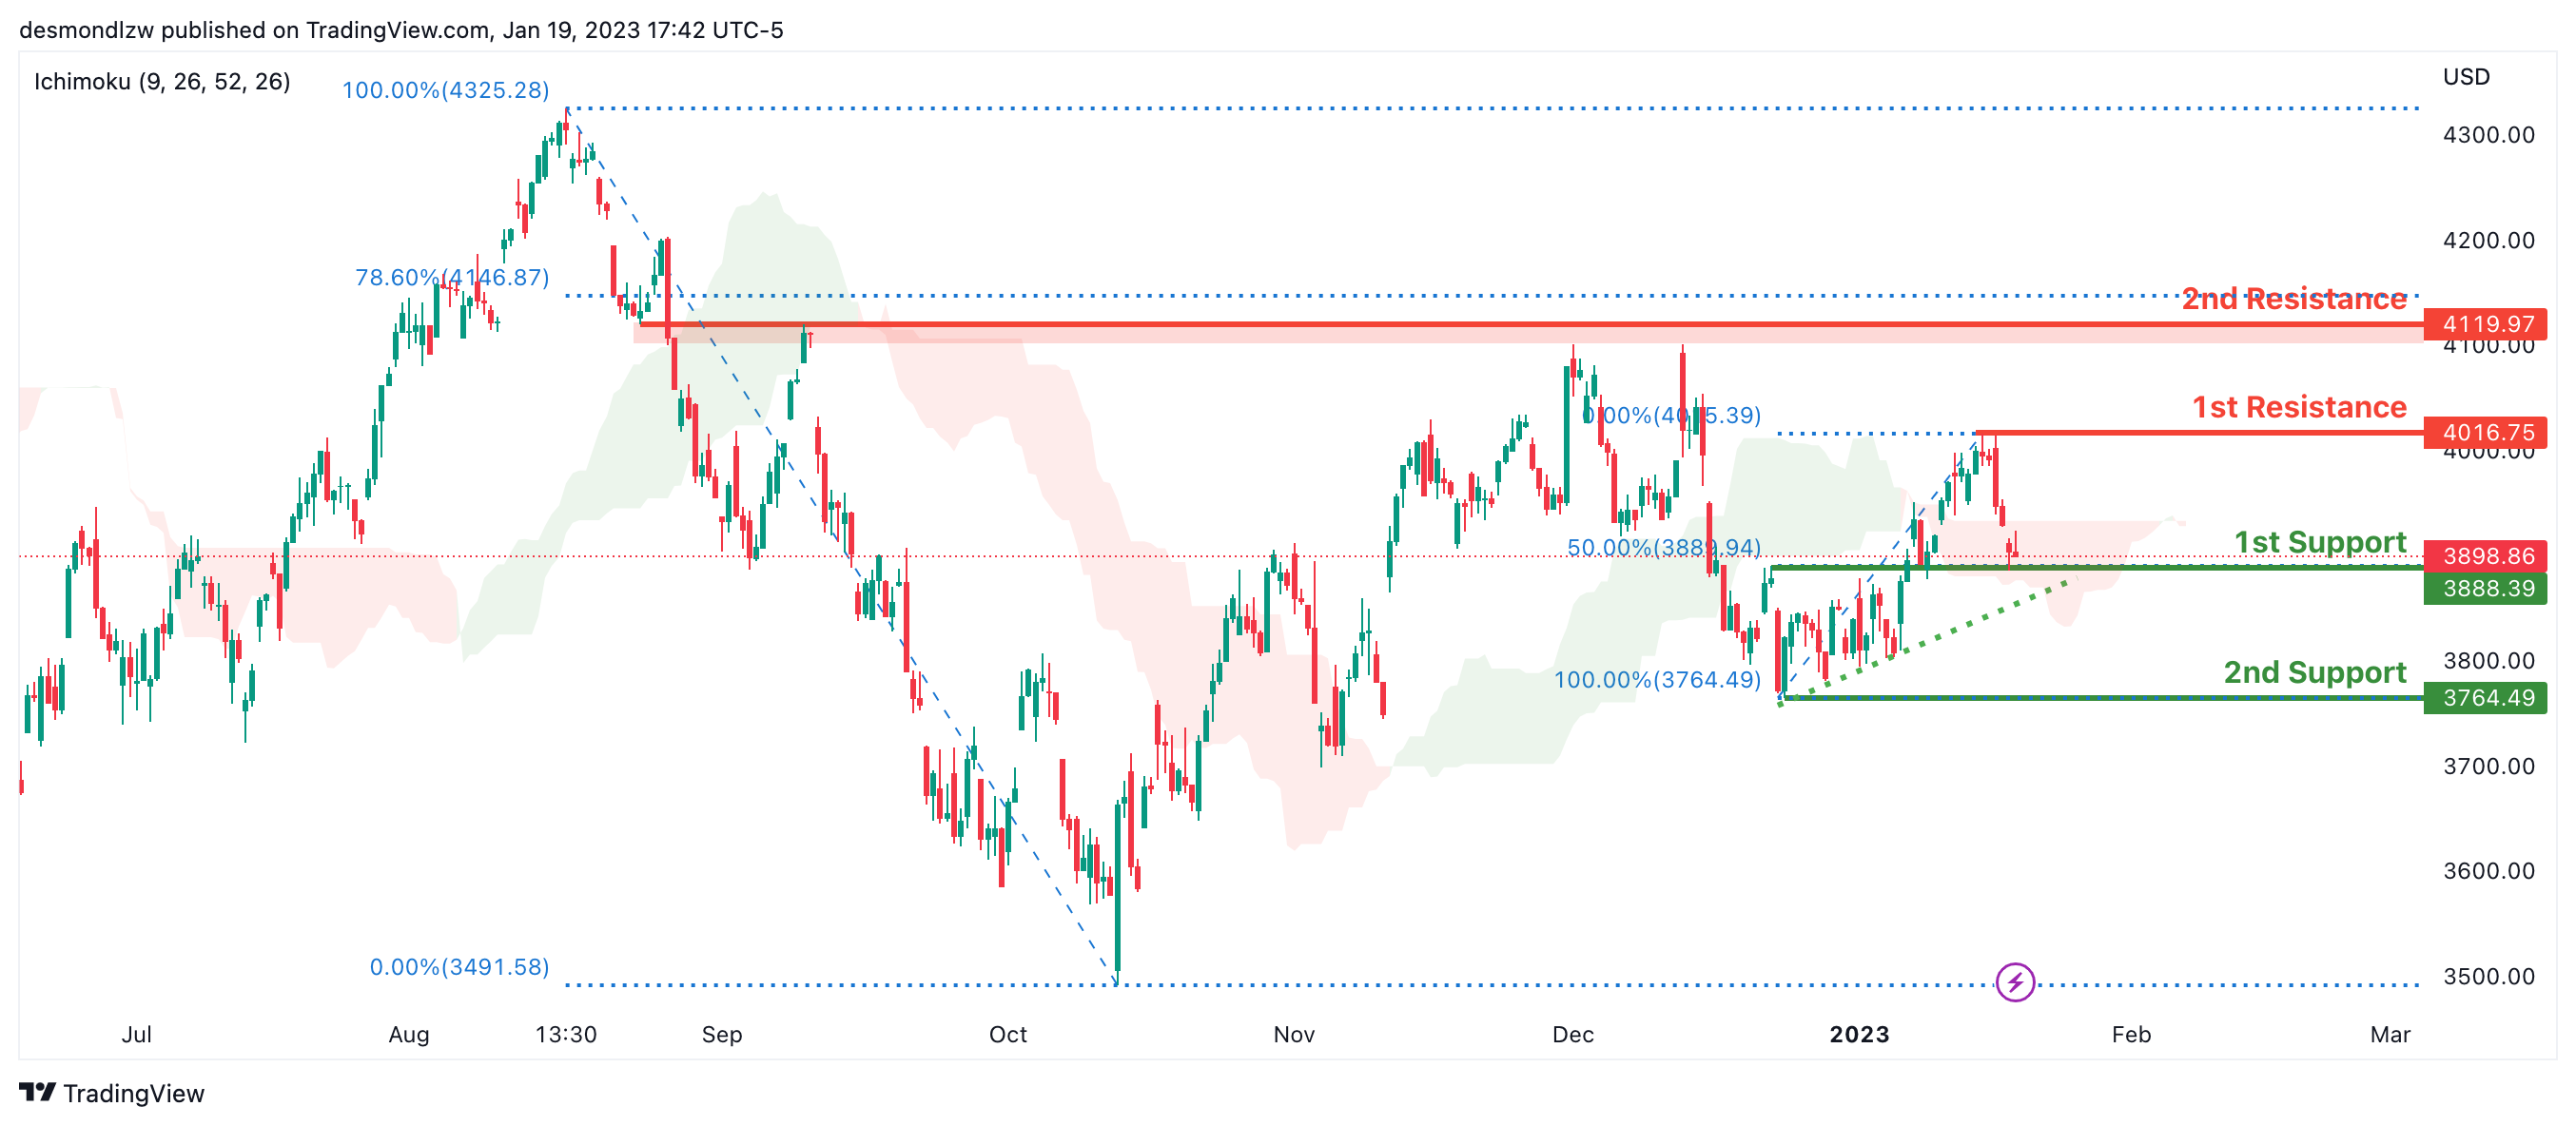
S&P 500:
Looking at the H4 chart, my overall bias for S&P500 is bullish due to the current price being above the Ichimoku cloud, indicating a bullish market. If this bullish momentum continues, expect the price to continue heading towards the 1st resistance at 4119.97, where the 78.6% Fibonacci line is. In an alternative scenario, price could possibly head back down to break the 1st support at 3888.39, where the 50% Fibonacci line is, before heading towards the 2nd support at 3764.49, where the recent swing low is.
Areas of consideration:
- H4 time frame, 1st support at 3888.39
- H4 time frame, 2nd support at 3764.49
- H4 time frame, 1st resistance at 4119.97
The accuracy, completeness and timeliness of the information contained on this site cannot be guaranteed. IC Markets does not warranty, guarantee or make any representations, or assume any liability regarding financial results based on the use of the information in the site.
News, views, opinions, recommendations and other information obtained from sources outside of www.icmarkets.com, used in this site are believed to be reliable, but we cannot guarantee their accuracy or completeness. All such information is subject to change at any time without notice. IC Markets assumes no responsibility for the content of any linked site.
The fact that such links may exist does not indicate approval or endorsement of any material contained on any linked site. IC Markets is not liable for any harm caused by the transmission, through accessing the services or information on this site, of a computer virus, or other computer code or programming device that might be used to access, delete, damage, disable, disrupt or otherwise impede in any manner, the operation of the site or of any user’s software, hardware, data or property.