
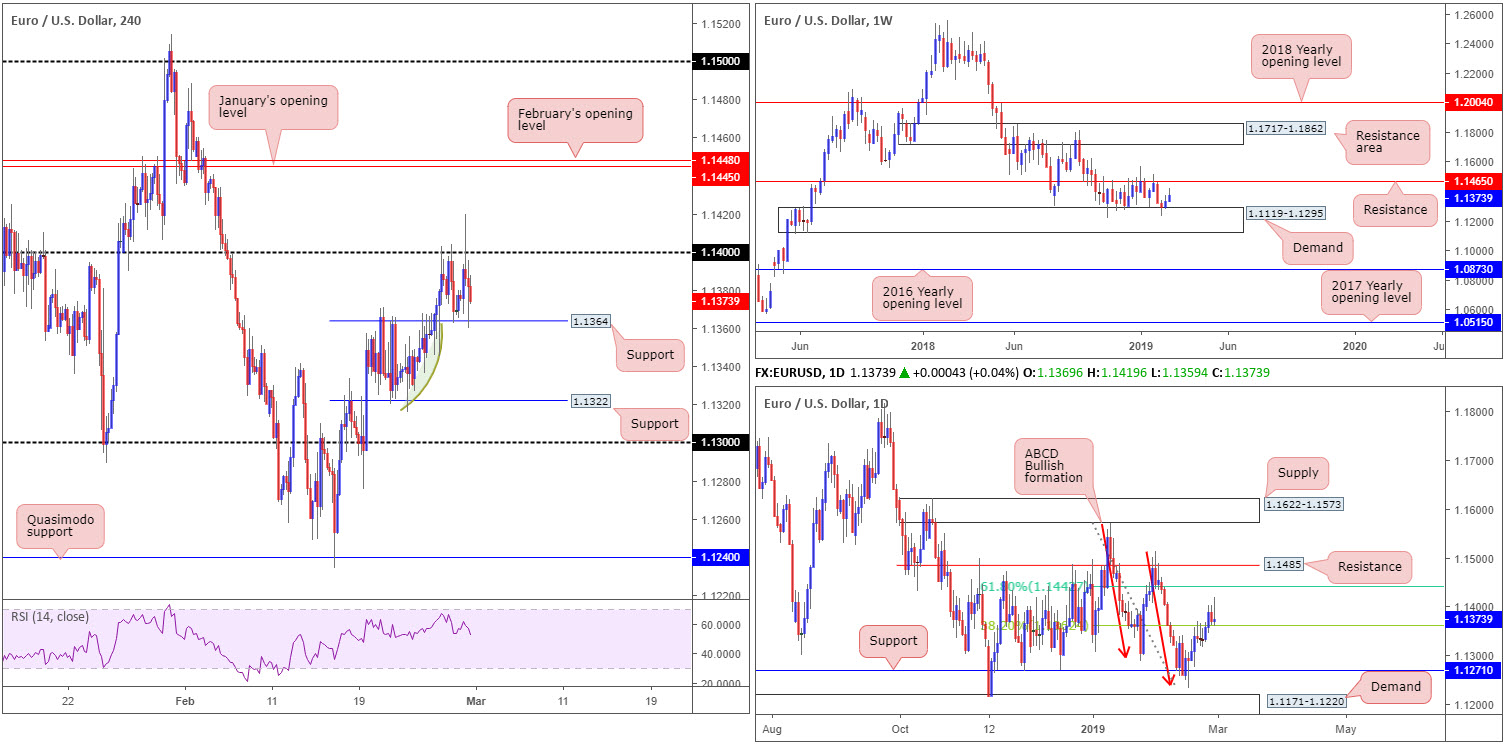
EUR/USD:
Underpinned by a better-than-expected US growth reading as well as an upbeat Chicago PMI, the US dollar index advanced to a high of 96.28 Thursday, registering its second consecutive daily gain. This simultaneously strong-armed the EUR/USD market sub 1.14, and eventually led to a test of a nearby local H4 support coming in at 1.1364. The response from this angle along with hesitancy around 1.14 has confirmed a temporary range. Should we observe the current support hold ground, another attempt to retake 1.14 is likely. A push lower, however, has a reasonably clear run towards H4 support at 1.1322. Note the green arc resembles potentially consumed demand. In other words, limited buyer opposition is likely present between 1.1364/1.1322.
Medium term, however, H4 price remains entrenched within an uptrend, with a higher high expected to take shape beyond 1.14, potentially towards January and February’s opening levels at 1.1445 and 1.1448, respectively.
On more of broader note, weekly price is seen extending gains off its current demand area at 1.1119-1.1295, with the next upside objective not expected to enter the frame until reaching a long-standing support/resistance at 1.1465. The story over on the daily timeframe shows the candles recently broke above its 38.2% Fibonacci resistance value at 1.1362. This level, as highlighted in previous reports, is the first take-profit target for many traders long the daily ABCD bullish completion point (red arrows) around 1.1240. Above this barrier, we have the 61.8% Fibonacci resistance value at 1.1442 in the spotlight – considered the second take-profit target off the ABCD pattern.
Areas of consideration:
Having seen weekly buyers enter the fold from demand (1.1119-1.1295) and daily price exhibit scope to push for higher ground towards 1.1442, along with H4 price shaking hands with local support at 1.1364, the research team remains biased to the upside.
With the above in mind, traders are urged to keep eyes on 1.14. A decisive push above this number has the H4 monthly opening levels highlighted above around 1.1448/45 to target. Traders may look to either buy the breakout here, or, for more conservative traders, wait and see if a retest play is seen before pulling the trigger.
A break below 1.1364, as underlined above, may call for a move to 1.1322. This is a particularly chancy short, though, knowing you’re potentially selling into weekly buying.
Today’s data points: EUR CPI Flash Estimate y/y; EUR Core CPI Flash Estimate y/y; US Core PCE Price Index m/m; US Personal Spending m/m; US ISM Manufacturing PMI; US Revised UoM Consumer Sentiment.
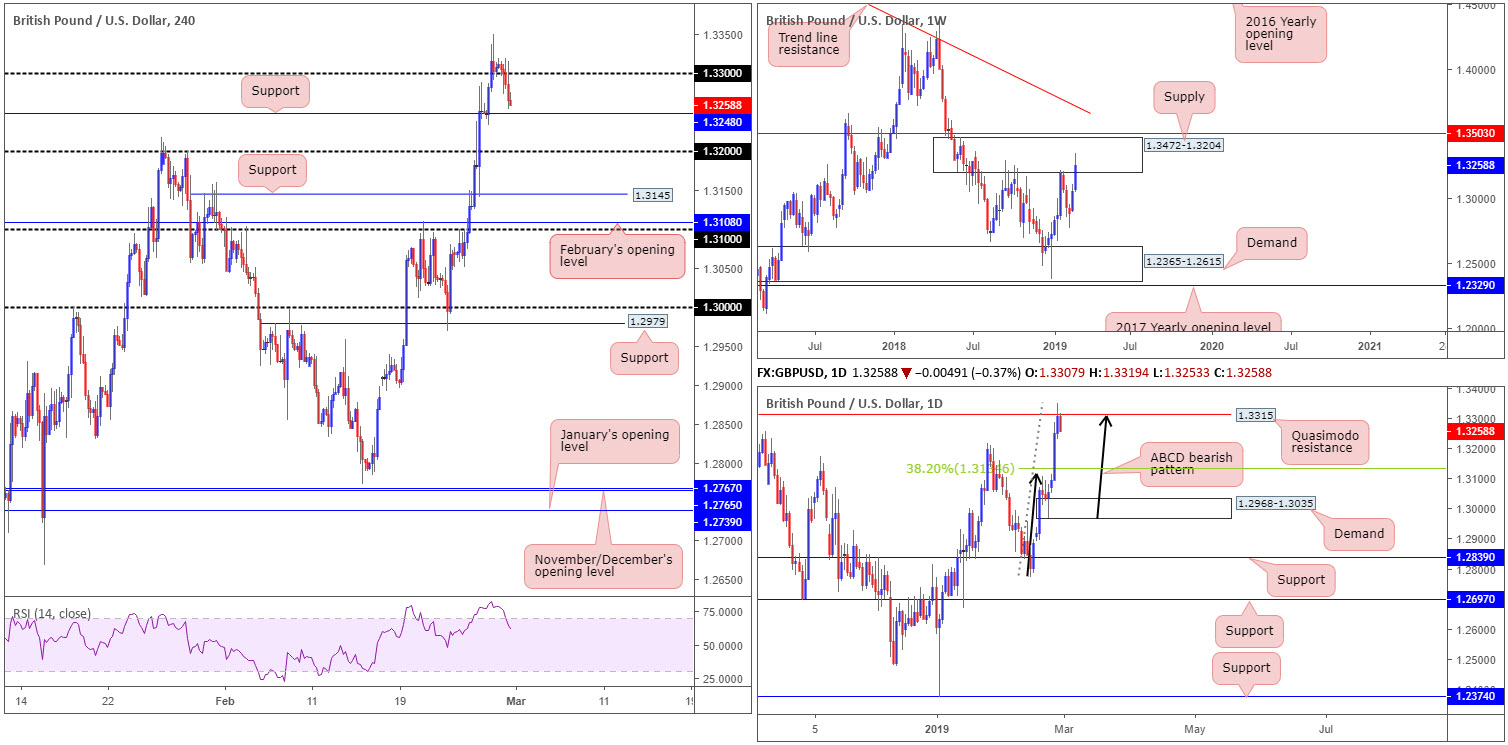
GBP/USD:
Warnings continue to circulate regarding the speed of sterling’s recent advance. This week’s upside has been driven by Brexit optimism, not a fundamental improvement of the UK economy, which has some arguing the GBP is overbought at these levels and some profit taking could be on the cards.
H4 buyers, despite clocking a fresh YTD high at 1.3350 Wednesday, failed to sustain gains above 1.33 and dipped lower Thursday, settling a few pips north of support coming in at 1.3248. According to our technical studies, apart from the RSI indicator displaying an overbought reading, limited resistance is seen on the H4 until we reach 1.34.
Despite H4 showing little in terms of resistance, a formidable ceiling is seen on both weekly and daily timeframes. The current weekly candle is seen invading supply territory pictured at 1.3472-1.3204, which happens to be positioned just south of the 2018 yearly opening level at 1.3503. In parallel with this, daily flow is crossing swords with a Quasimodo resistance level parked at 1.3315. Adding weight to a potential correction from here is the approach: an ABCD bearish formation (black arrows).
Areas of consideration:
For folks who read Thursday’s briefing you may recall the piece highlighting a possible dip back beneath 1.33, targeting nearby H4 support at 1.3248 as the initial take-profit zone, followed closely by the 1.32 handle. Well done to any of our readers who caught this move on the retest of 1.33 as resistance.
Those who remain short are recommended to take into account the two H4 supports underscored above, though also remain cognizant of a possible move beyond these barriers, as the higher timeframes suggest. The daily Fibonacci support value at 1.3134 (the first take-profit target for those short the daily ABCD bearish pattern) is the nearest support target on the higher-timeframe picture. Therefore, we could be at least looking at a move towards H4 support plotted at 1.3145.
Today’s data points: UK Manufacturing PMI; UK Net Lending to Individuals m/m; US Core PCE Price Index m/m; US Personal Spending m/m; US ISM Manufacturing PMI; US Revised UoM Consumer Sentiment.
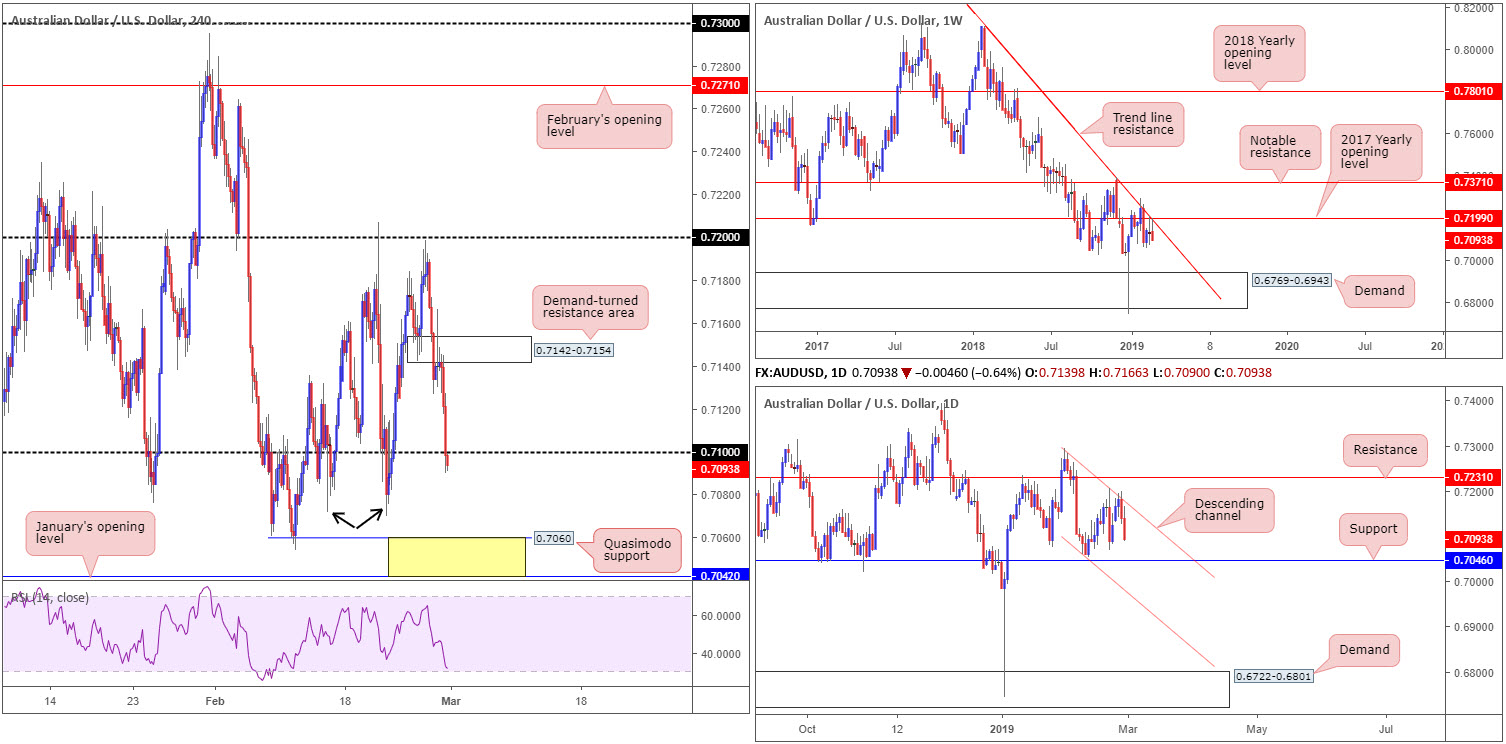
AUD/USD:
The Australian dollar ceded further ground to its US counterpart Thursday, despite running to highs of 0.7166 in early trade on upbeat Aussie private capital expenditure q/q.
For traders who read Thursday’s briefing you may recall the research team highlighting the H4 demand at 0.7142-0.7154 could offer an area of resistance on its recent break. The piece further noted that a retest to the underside of this zone, backed by a supporting H4 bearish candlestick, has 0.71 in view as the initial port of call. A H4 bearish pin-bar formation completed around the underside of the aforementioned area in early Europe, which if traded, offered incredibly appealing risk/reward conditions.
What also attracted us to the current H4 resistance area was weekly price fading 0.7199 on the weekly timeframe: the 2017 yearly opening level, as well as merging trend line resistance (taken from the 2018 yearly high of 0.8135). Further adding weight to the sell side of this market was daily price fading nearby resistance in the shape of a channel formation (taken from the high 0.7295).
Areas of consideration:
With both weekly and daily timeframes offering reasonably clear paths south – the nearest support falls in on the daily timeframe at 0.7046 – a sell sub 0.71 on the H4 timeframe could be on the menu today. Below here, we have possible support from 0.7072ish: a double bottom support (black arrows), tailed closely by Quasimodo support at 0.7060 (positioned a few pips north of daily support priced in at 0.7046: the next support on that scale).
With the above observed, an intraday sell on the retest of 0.71 could be an idea, targeting the aforementioned H4 supports. Should we reach the yellow zone on the H4 timeframe between January’s opening level at 0.7042 and the H4 Quasimodo support at 0.7060, which happens to house daily support at 0.7046 within, this is a potential buy zone worth considering. Though do bear in mind you would potentially be entering long against weekly selling.
Today’s data points: US Core PCE Price Index m/m; US Personal Spending m/m; US ISM Manufacturing PMI; US Revised UoM Consumer Sentiment.
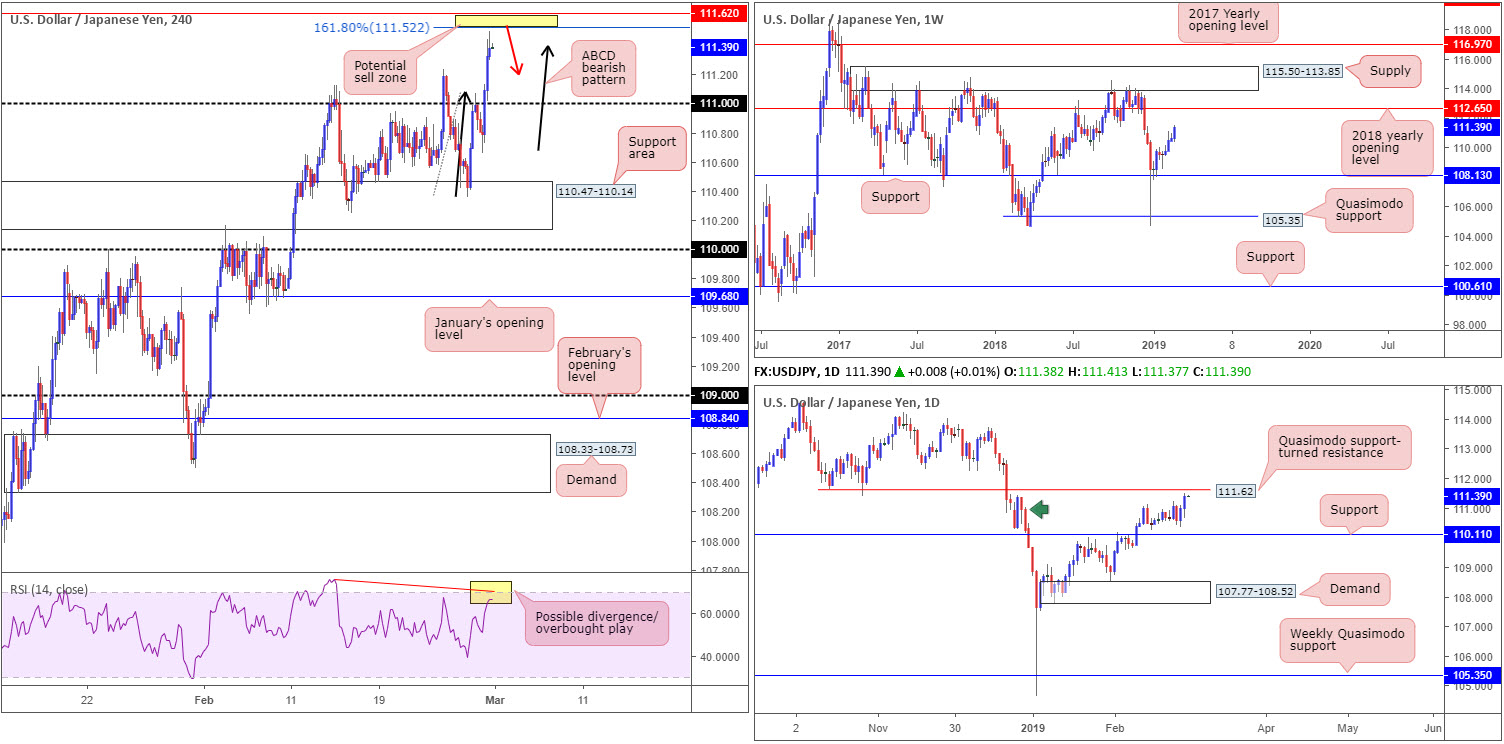
USD/JPY:
Hotter-than-expected US macroeconomic data lifted the USD/JPY to higher ground Thursday, up 0.35% on the day. The break of 111 to the upside on the H4 timeframe has strategically positioned the H4 candles a few pips south of a potential sell zone. Though small in size at 111.62/111.52 (yellow), the area will likely pack a punch, given its construction is made up of a daily Quasimodo support-turned resistance at 111.62 and a H4 ABCD (black arrows) 161.8% Fibonacci ext. point at 111.52. It might also interest some traders to note the H4 RSI indicator is displaying a possible divergence/overbought play.
Besides the range of the zone, the only other grumble is the fact weekly price portends a move beyond here towards the 2018 yearly opening level at 112.65.
Areas of consideration:
Despite weekly price suggesting a move higher, a reaction out of 111.62/111.52 is likely. In view of the area’s size, the research team recommends waiting and seeing if a H4 bearish candlestick pattern develops before pulling the trigger. That way, not only have you identified seller intent, you also have structure to base entry and risk on.
Today’s data points: US Core PCE Price Index m/m; US Personal Spending m/m; US ISM Manufacturing PMI; US Revised UoM Consumer Sentiment.
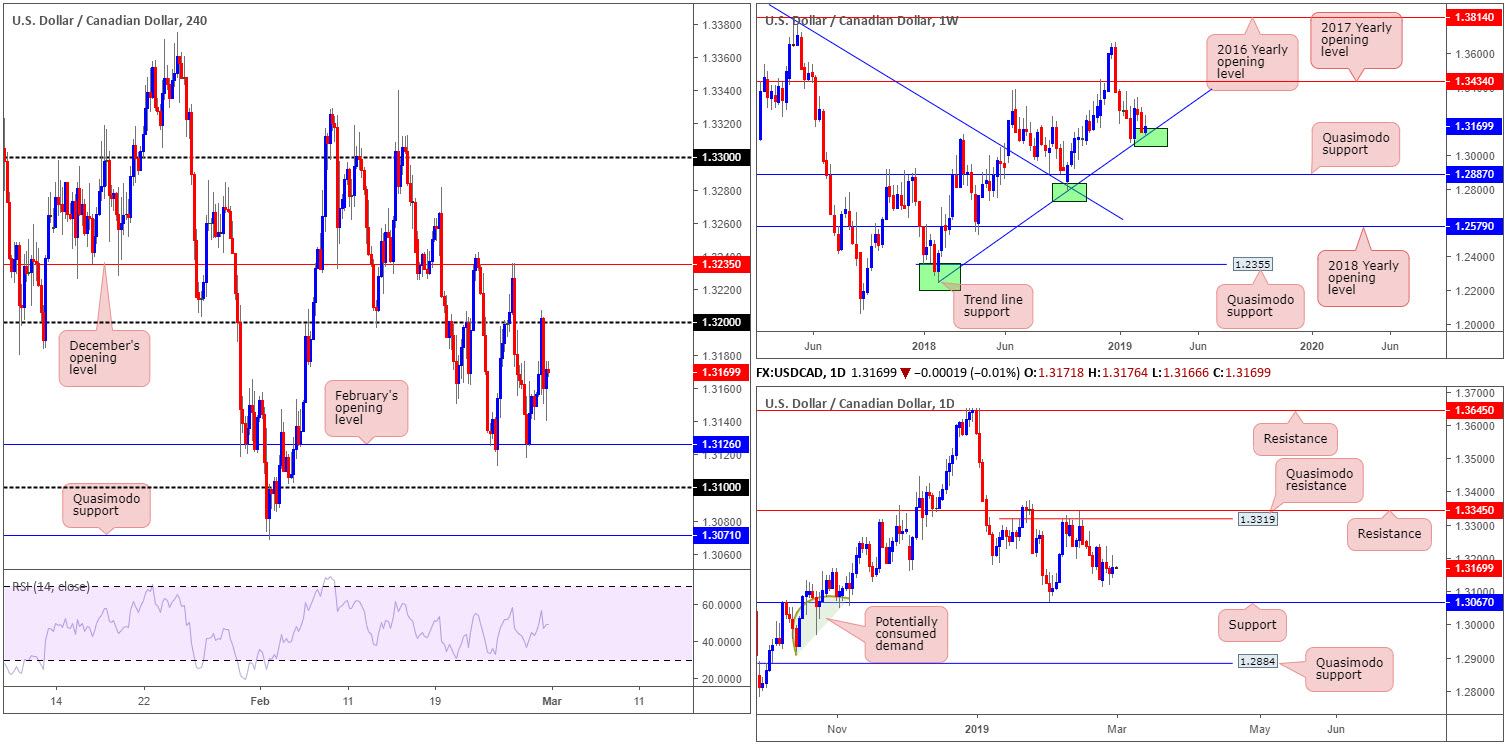
USD/CAD:
Canada’s current account deficit (on a seasonally adjusted basis) expanded by $5.4 billion in the fourth quarter to $15.5 billion. This increase reflected a higher trade in goods and services deficit, which was moderated by a lower investment income deficit (statcan). This, alongside a better-than-expected US growth reading, witnessed the USD/CAD run higher Thursday, though failed to sustain gains beyond 1.32 on the H4 timeframe. Although the day concluded marginally higher, the reaction off 1.32 was relatively fierce, dragging the H4 candles to lows of 1.3140. Overall, H4 structure is capped between 1.32 and February’s opening level at 1.3126.
On a wider perspective, weekly structure is offering support in the shape of a trend line (etched from the low 1.2247), with the possibility of room to trade as far north as the 2017 yearly opening level at 1.3434. Daily structure, on the other hand, has upside resistance planted around 1.3319: a Quasimodo resistance, whereas to the downside we have support at 1.3067.
Areas of consideration:
On the whole, buying is higher probability knowing we’re coming from weekly trend line support. The problem, however, is there’s limited confluence to base a long from on the H4 timeframe. Right now, as highlighted above, we’re consolidating between 1.32/1.3126 and have yet to put in for a higher high since topping on February 14 at 1.3340. Until this happens, which won’t come about until a break of December’s opening level at 1.3235 is observed, neither a long nor short is attractive in this market.
Today’s data points: US Core PCE Price Index m/m; US Personal Spending m/m; US ISM Manufacturing PMI; US Revised UoM Consumer Sentiment; Canadian GDP m/m.
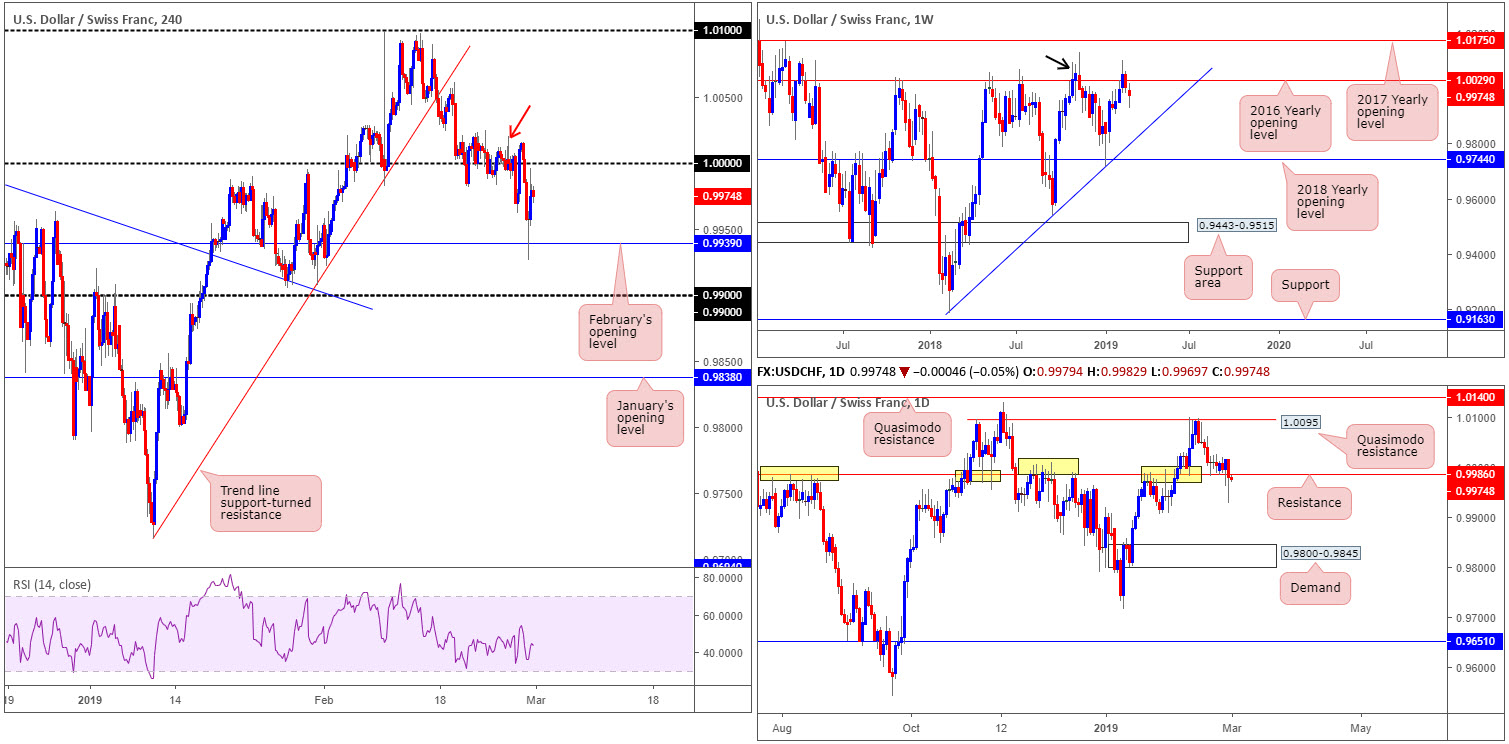
USD/CHF:
Going into the early hours of trade Thursday, H4 action lost grip of 1.0000 (parity). Selling continued to be observed until markets switched to US hours and crossed paths with February’s opening level at 0.9939 on the H4 timeframe. A reasonably modest round of buying entered the fold from here, though failed to reconnect with 1.0000, settling for the day at 0.9979.
As a whole, H4 structure is entrenched within a short-term downtrend after forming a peak back on February 11 at 1.0094. According to this structure, a lower low could be in store.
Supporting a move lower is both weekly and daily timeframes. Weekly buyers struggled to gain a foothold above its 2016 yearly opening level at 1.0029 last week, consequently clawing back prior week gains and breaking a three-week bullish run. As highlighted in the previous weekly briefing, the barrier’s history as a resistance may still draw in sellers as it did in November 2018 (black arrow). In conjunction with weekly action, daily price recently crossed beneath support at 0.9986 (now acting resistance), potentially exposing the 0.9905 Jan 28 low as the next viable support. Beyond here, the research team notes demand pressed at 0.9800-0.9845.
Areas of consideration:
With all three timeframes pointing to a move lower, the underside of 1.0000 is appealing this morning as a platform for sellers. A H4 bearish rotation candle printed from this number (a full or near-full-bodied bearish candle) would, according to the overall picture, likely be enough to entice sellers into the market back towards at least February’s opening level mentioned above at 0.9939, followed by 0.99.
Entry can be taken from the close of the H4 bearish candle, with stop-loss orders positioned either above the candle wick or above the highs marked with a red arrow around 1.0020.
Today’s data points: US Core PCE Price Index m/m; US Personal Spending m/m; US ISM Manufacturing PMI; US Revised UoM Consumer Sentiment.
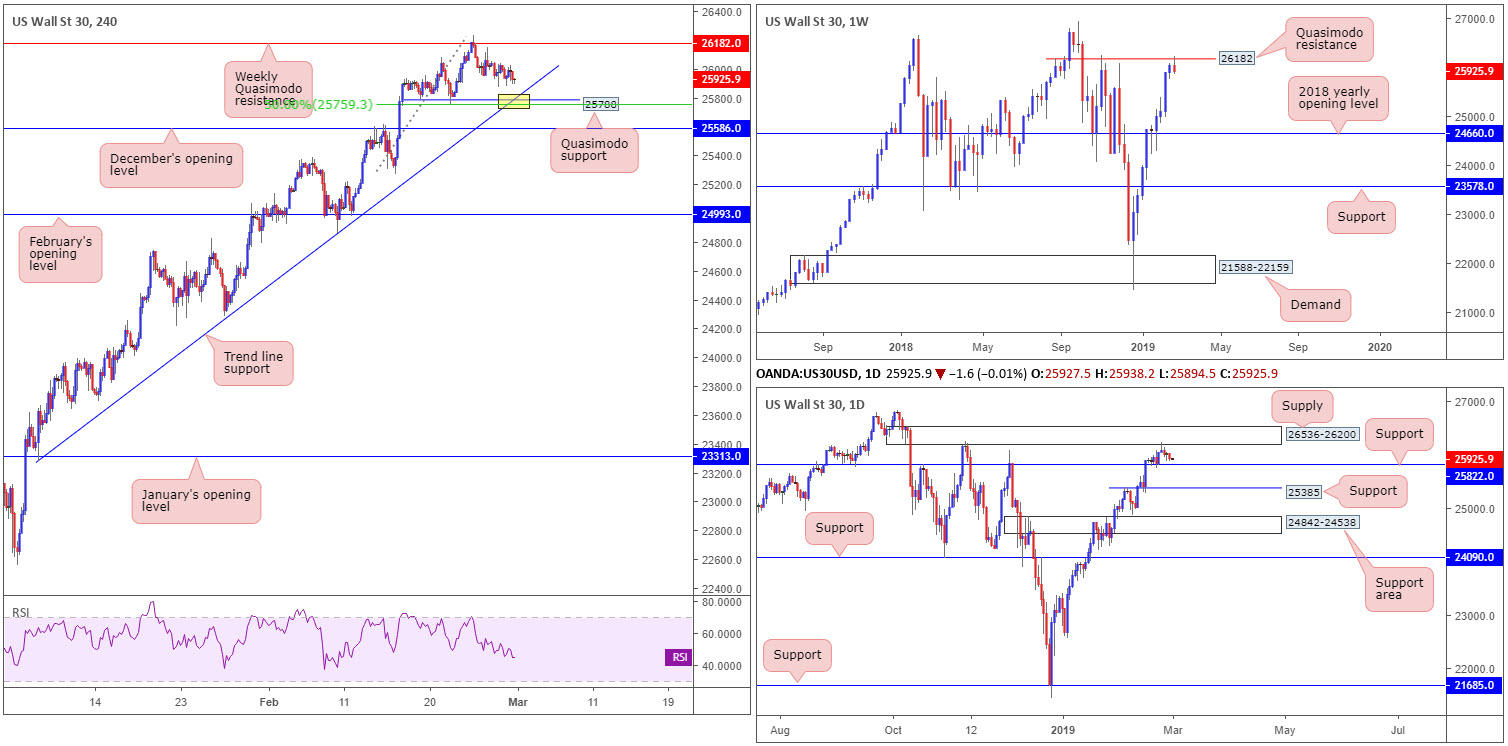
Dow Jones Industrial Average:
Outlook remains unchanged.
US equities saw risk appetite marginally diminish Thursday, as US President Donald Trump said he walked out of his second summit with Kim Jong Un after the two leaders couldn’t agree on a deal to relieve North Korea of US sanctions in exchange for Pyongyang giving up much of its nuclear weapons program.
Technically speaking, though, the index remains unchanged. In view of this, much of the following report will echo thoughts put forward in Thursday’s briefing.
The index is seen flipping between gains/losses amid the weekly Quasimodo resistance at 26182 and a H4 Quasimodo support at 25788, which happens to merge with a trend line support (extended from the low 23277).
From the top of the pile, nevertheless, weekly players are seen fading a Quasimodo resistance plotted at 26182 by way of a bearish pin-bar formation. Adding weight to the sellers’ position is daily price fading supply at 26536-26200 in the form of a bearish pin-bar candlestick pattern. The next downside target on the daily remains sited nearby around support at 25822.
Areas of consideration:
Traders who read Tuesday’s report may recall the piece underlining a possible sell, basing entry and risk levels off the daily bearish pin-bar pattern. Well done to any of our readers who remained short, as traders have more than a 1:1 risk/reward ratio to the daily support level mentioned above at 25822, which may be achieved today.
Intraday movement, however, may witness a reaction take shape off the H4 Quasimodo support mentioned above at 25788 at the point where it fuses with its aforementioned trend line support (yellow). Note 25788 also merges closely with a 50.0% support value at 25759 and is located just beneath daily support at 25822. For traders considering a long play off 25788, waiting for additional confirmation is recommended, as let’s bear in mind where we’re trading from on the weekly timeframe.
Today’s data points: US Core PCE Price Index m/m; US Personal Spending m/m; US ISM Manufacturing PMI; US Revised UoM Consumer Sentiment.
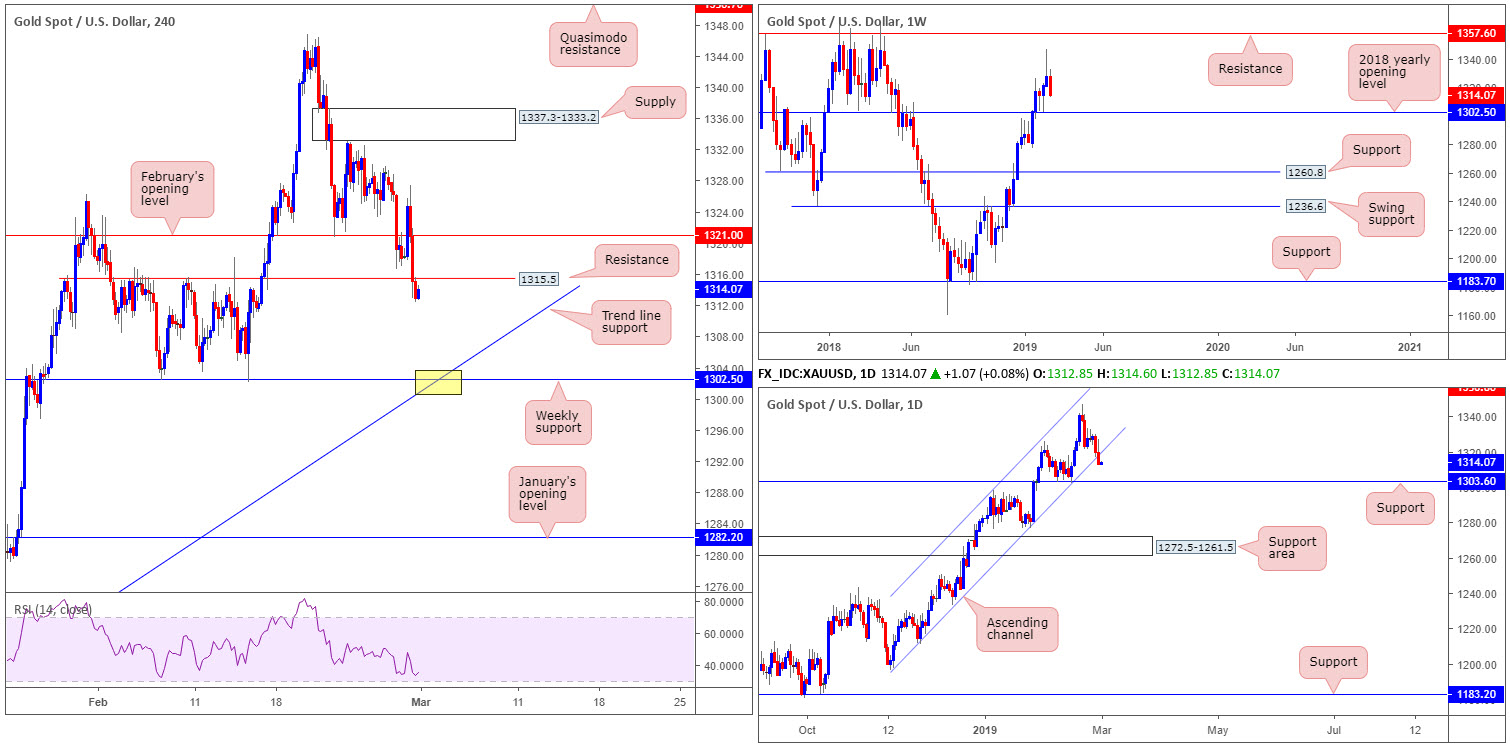
XAU/USD (GOLD):
Demand for the US dollar increased Thursday, consequently pressuring the yellow metal lower for a second consecutive day. Down over 1% this week so far, the next downside objective on the weekly timeframe can be seen around support priced in at 1302.5: the 2018 yearly opening level. As can be seen on the chart, this level boasts attractive history.
A closer reading of price action on the daily timeframe shows recent selling potentially set the stage for further downside towards support plotted just above the aforementioned weekly support at 1303.6.
Lower down on the curve, we can also see the H4 candles engulfed support at 1315.5 (now acting resistance). Breaking this level, according to H4 structure, has placed the spotlight on the weekly support mentioned above at 1302.5, which merges with a H4 trend line support (yellow – extended from the low 1196.0).
Areas of consideration:
The above reading opens two possible scenarios:
- A retest to the underside of 1315.5 on the H4 timeframe could offer traders the opportunity to sell, targeting daily support at 1303.6. For conservative traders, waiting for additional bearish candlestick confirmation is an option (entry/stop parameters can be defined according to this structure).
- Longs at the point where weekly support at 1302.5 and the current H4 trend line converge (yellow) is also an idea, with stop-loss orders plotted just beneath 1297.4.
The accuracy, completeness and timeliness of the information contained on this site cannot be guaranteed. IC Markets does not warranty, guarantee or make any representations, or assume any liability with regard to financial results based on the use of the information in the site.
News, views, opinions, recommendations and other information obtained from sources outside of www.icmarkets.com.au, used in this site are believed to be reliable, but we cannot guarantee their accuracy or completeness. All such information is subject to change at any time without notice. IC Markets assumes no responsibility for the content of any linked site. The fact that such links may exist does not indicate approval or endorsement of any material contained on any linked site.
IC Markets is not liable for any harm caused by the transmission, through accessing the services or information on this site, of a computer virus, or other computer code or programming device that might be used to access, delete, damage, disable, disrupt or otherwise impede in any manner, the operation of the site or of any user’s software, hardware, data or property.


