
EUR/USD:
In recent news, the political situation in Italy stabilized on Thursday after the Italian 5 Star movement and the League completed an agreement on a coalition government. In addition to this, US Commerce Secretary Ross announced the EU, Canada and Mexico will face a 25% tariff on steel and 10% on aluminum from midnight on Thursday.
Despite news flow, the euro chalked up its second consecutive daily gain on Thursday.
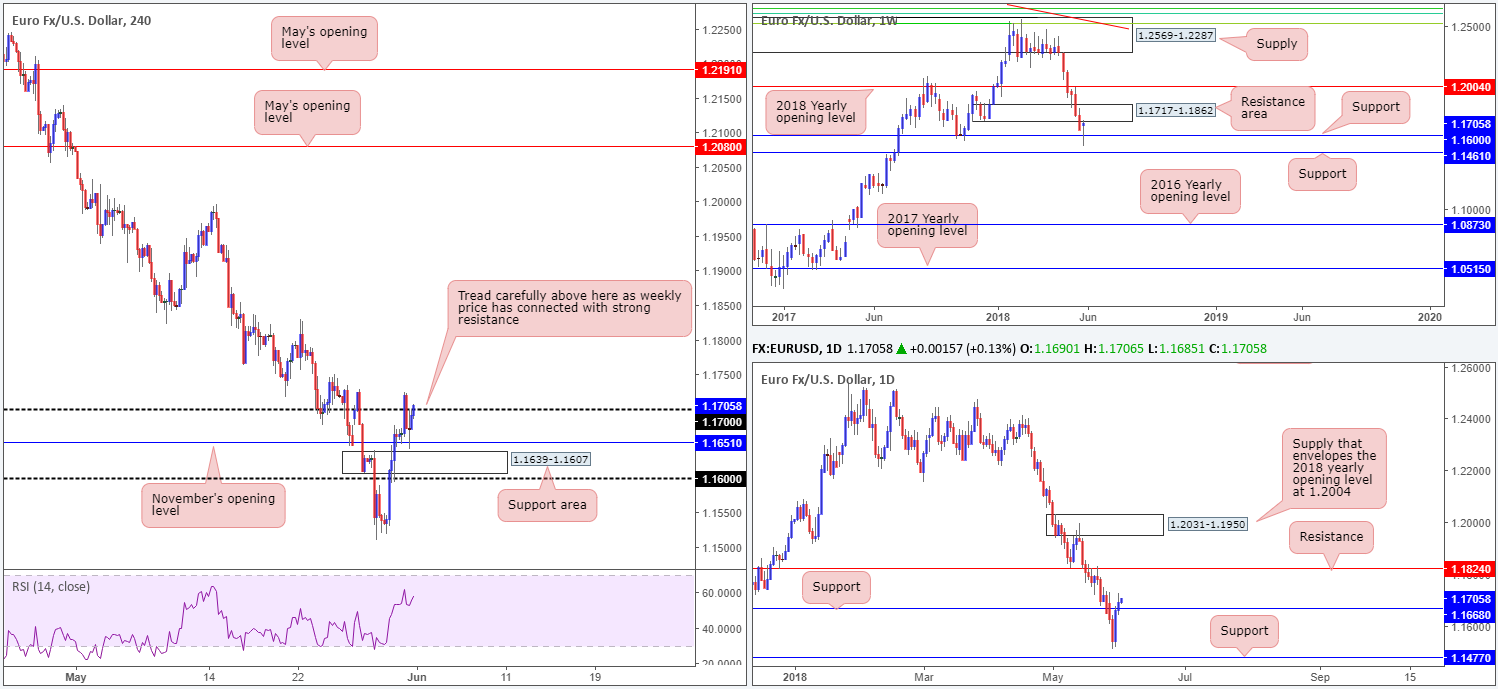
In early London hours, the market attempted to breach the 1.17 handle seen on the H4 timeframe, but fell short around the 1.1724 mark. Shortly after, the pair established support off November’s opening level at 1.1651 and is now, once again, seen experimenting with 1.17.
Moving things over to the higher timeframes, we can see that daily price recently crossed above resistance at 1.1668 (now acting support) and, in turn, has potentially exposed daily resistance plotted at 1.1824. A little higher up on the curve, though, weekly action is presently touching gloves with the underside of a resistance area formed from 1.1717-1.1862, after a rejection off support at 1.1600.
Areas of consideration:
Technically speaking, the underside of the noted weekly resistance area could weigh on the buyers today/next week. As such, initiating long trades above the recently broken daily resistance-turned support at 1.1668 and the 1.17 handle on the H4, is a chancy move, in our humble view.
In light of this conflict, and the fact that we have the mighty NFP scheduled for release later on, opting to remain on the sidelines may be the better path to take right now.
Today’s data points: US job’s figures; US ISM manufacturing PMI.
GBP/USD:
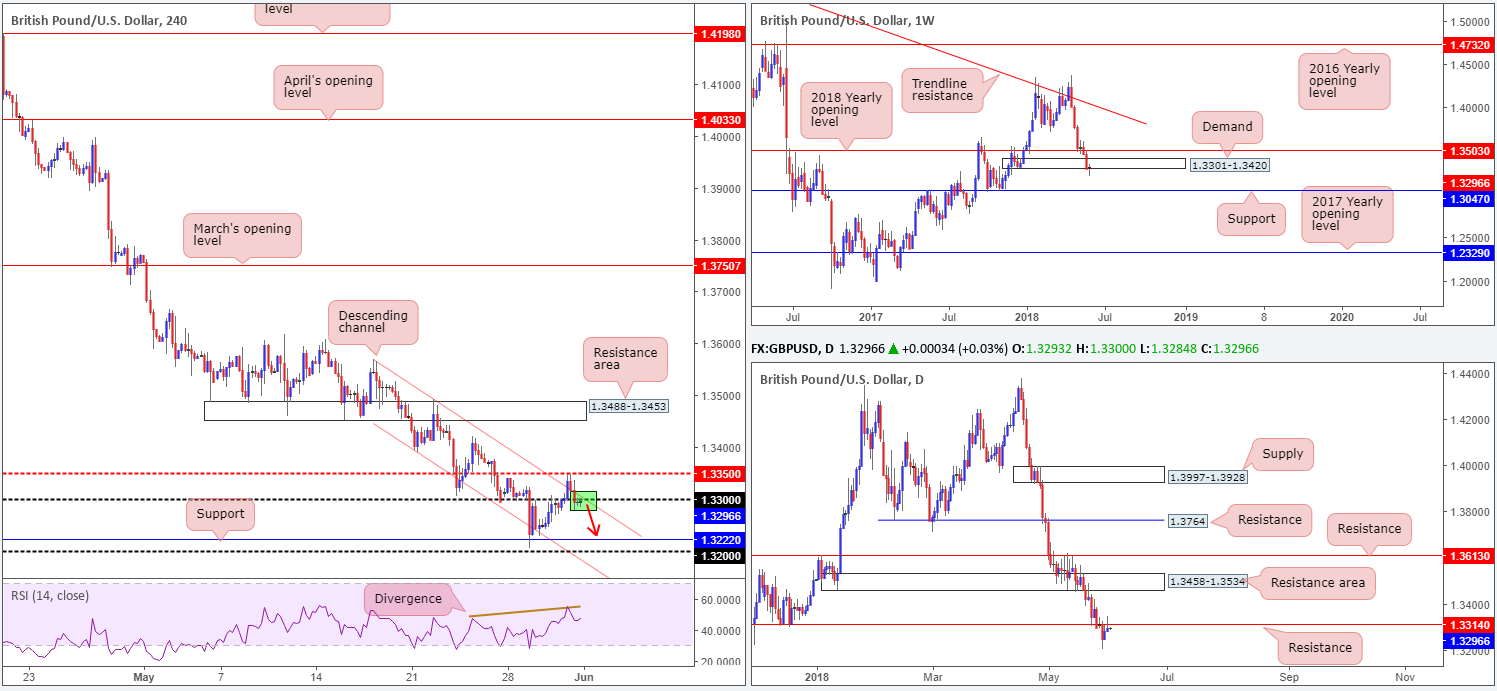
The British pound was unable to build on gains put forward amid London’s morning trade on Thursday, down from peaks near the H4 mid-level resistance 1.3350. The day ended with H4 price reclaiming the 1.33 handle, which simultaneously saw sellers re-enter the descending channel formation drawn from 1.3569/1.3390.
Supporting the underside of 1.33 is a daily resistance level plotted at 1.3314. Also notable from a technical perspective here is that daily action printed a nice-looking bearish pin-bar formation off this level yesterday.
Weekly movement is tricky to read at the moment. Demand at 1.3301-1.3420 experienced a strong blow to its lower edge this week, likely tripping stop-loss orders. Whether this area survives or not is difficult to judge at this point in time. Should it give way, though, the next support target on this scale can be found at 1.3047.
Areas of consideration:
We like the fact that 1.33 fuses with the top edge of the current H4 channel resistance (see green zone), as well as the H4 RSI currently displaying a divergence reading. We also are particularly fond of the noted daily resistance level, owing to its history. Therefore, should H4 price chalk up a bearish candle off 1.33 today (preferably in the shape of a full-bodied formation), shorts could be an option, targeting H4 support set at 1.3222, followed closely by the 1.32 handle.
Today’s data points: UK manufacturing PMI; US job’s figures; US ISM manufacturing PMI.
AUD/USD:
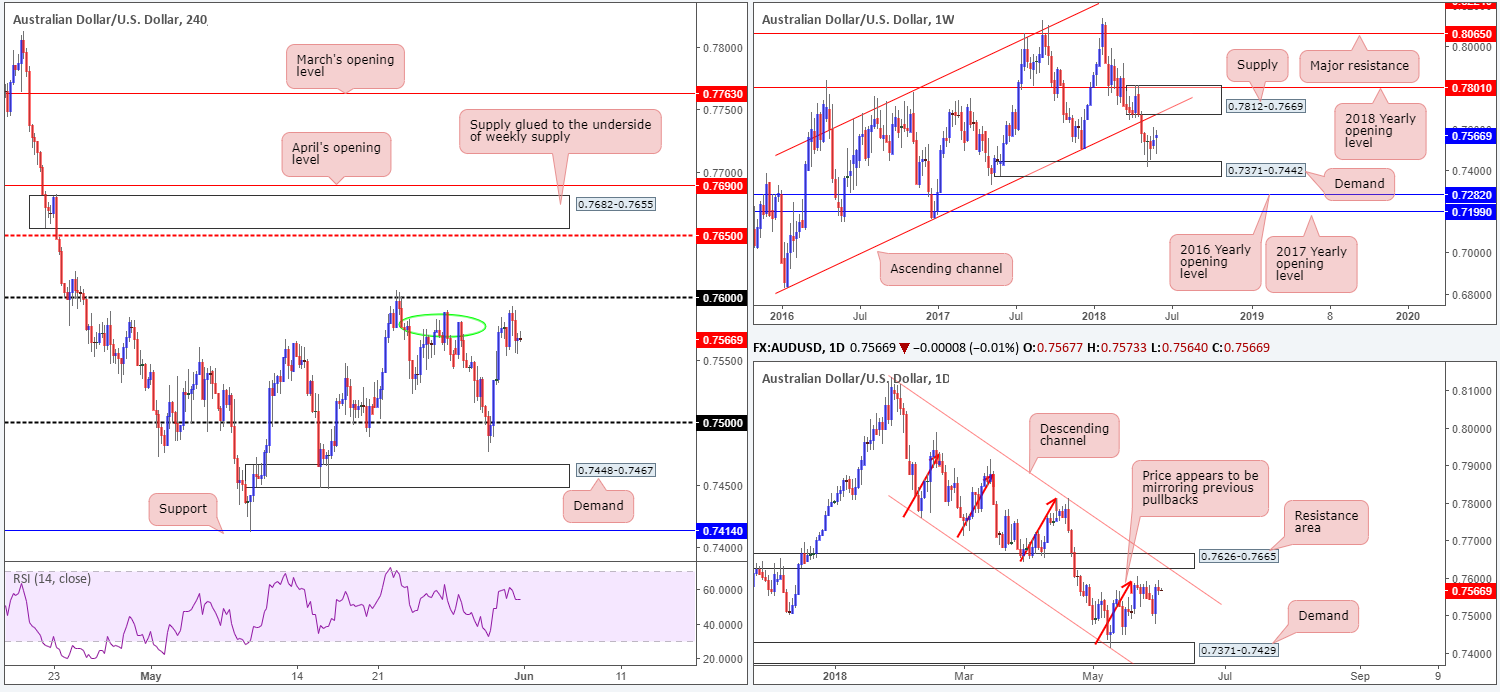
The Australian dollar lost its directional bias amid Thursday’s sessions, trading flat nearby H4 tops around the 0.7580 neighborhood (green circle). Thursday’s private capital expenditure q/q, despite coming in less than stellar, also failed to spark much movement.
For those who missed Thursday’s briefing, here’s where we currently stand on higher-timeframe structure. Upside appears free on the weekly scale until we reach supply noted at 0.7812-0.7669, which happens to intersect beautifully with channel support-turned resistance taken from the low 0.6827. Daily structure, on the other hand, is currently compressing within a descending channel formation (0.8135/0.7758). Interestingly, traders may want to note that the top edge of this channel converges beautifully with a resistance area plotted at 0.7626-0.7665.
Areas of consideration:
As stated in yesterday’s analysis, we feel further buying is likely in this market, with a breach of 0.76 potentially in store. Traders should, however, expect sellers to begin making an appearance around the 0.7626 region since this marks the underside of the current daily resistance area, which itself is located just beneath the aforementioned weekly supply.
At current price, we do not see much to hang our hat on in terms of trade setups. Once, or indeed if, price crosses above 0.76, though, and enters into the jaws of the noted daily resistance area, shorts will be favored.
Today’s data points: Caixin manufacturing PMI; US job’s figures; US ISM manufacturing PMI.
USD/JPY:
USD/JPY prices are effectively unchanged this morning, despite news out of Italy, as well as the US announcing the EU, Canada and Mexico will face a 25% tariff on steel and 10% on aluminum.
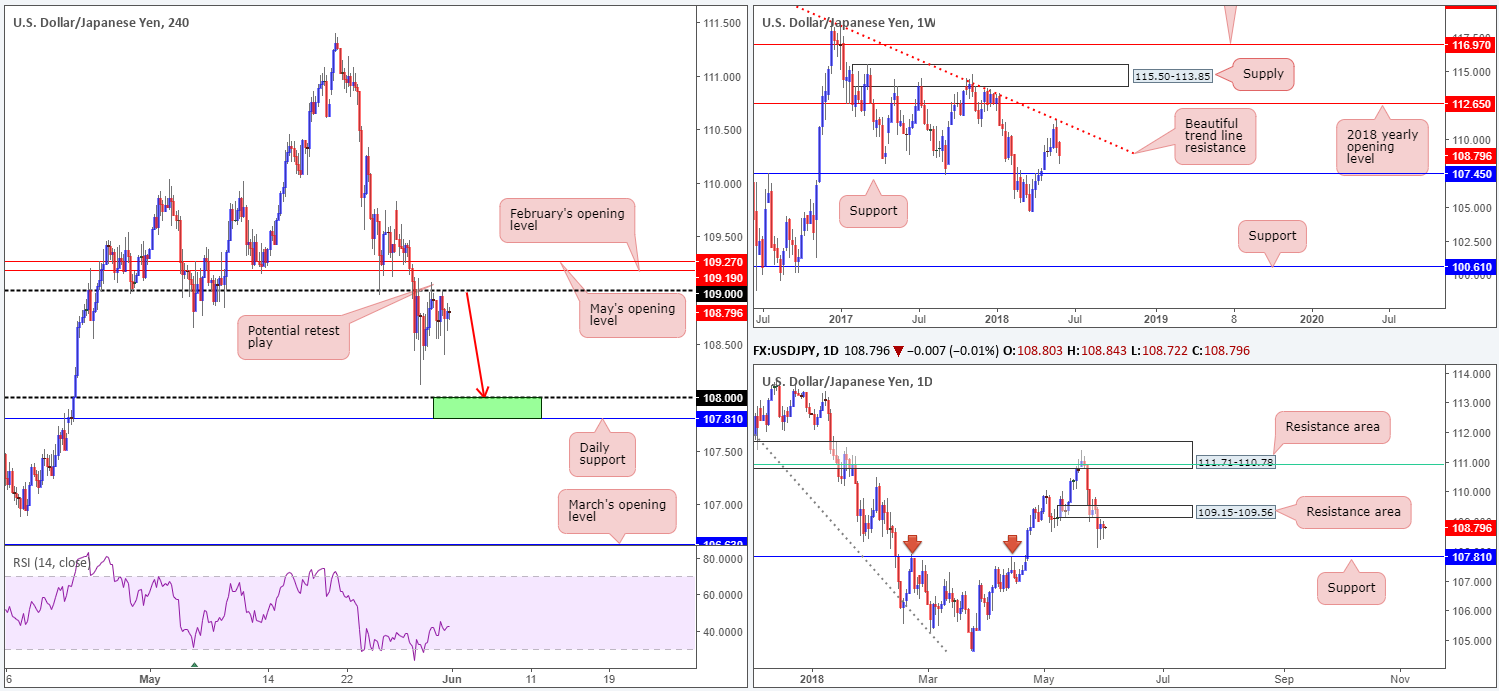
For those who read Thursday’s report you may recall the team underscoring the 109 handle as a possible level for a retest play. Technically speaking, this market has plenty of room to probe lower. The H4 scale shows limited support until we reach the 108 handle, while weekly price is currently targeting support at 107.45 along with daily flow seen eyeing support at 107.81.
Areas of consideration:
The green area marked on the H4 timeframe between daily support at 107.81 and the 108 round number is a zone we expect the buyers to attempt to make an appearance, so this is an area you may want to consider taking profit should you short from the 109 neighborhood. Do bear in mind, though, that weekly price could still pull prices beyond this range to weekly support mentioned above at 107.45, so it may pay to leave a small portion of the position open at 108.
Traders should note, however, that we have the mighty US NFP report scheduled for release later on today, and H4 action could simply be coiling ahead of this major event. Therefore, traders will certainly want to account for this as technicals tend to take a back seat leading up to and during the release.
Today’s data points: US job’s figures; US ISM manufacturing PMI.
USD/CAD:
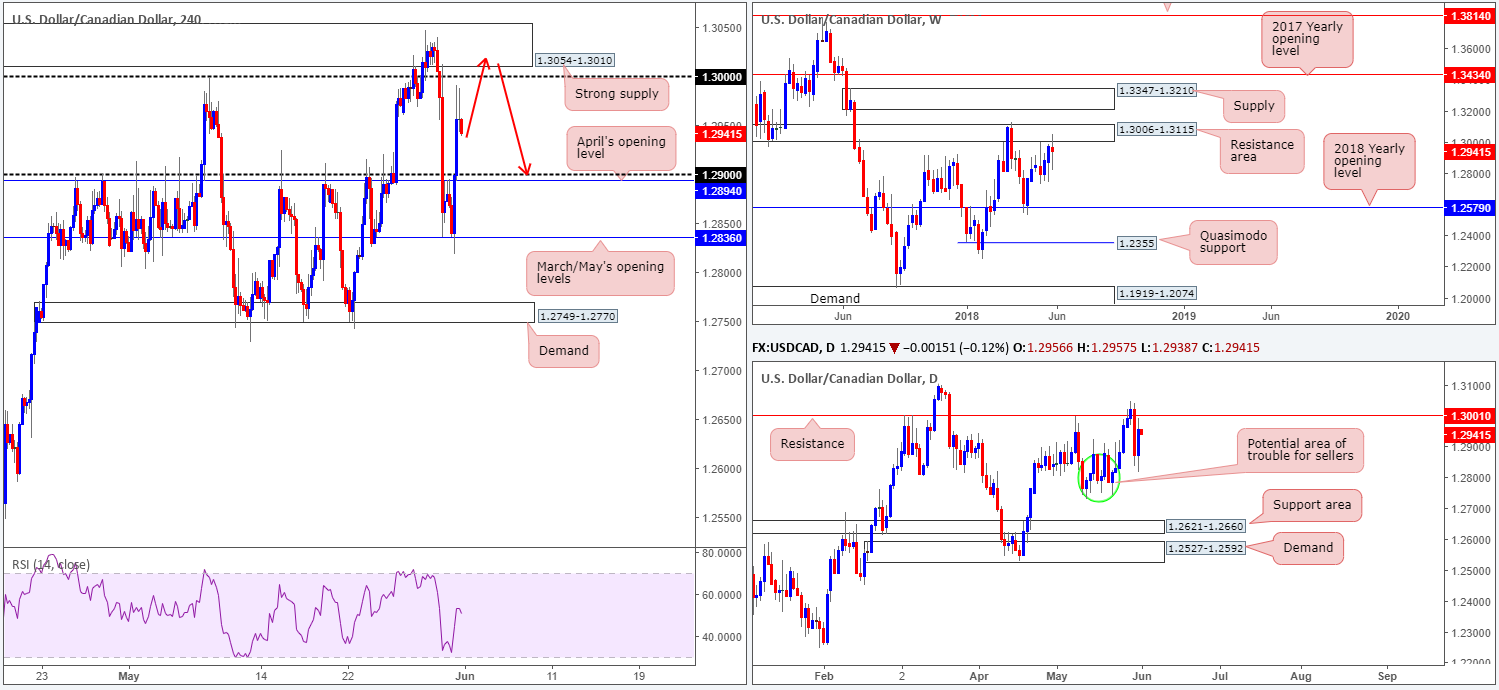
Considerably weaker-than-forecast Canadian GDP data (annualized y/y measure) showed that economic growth slowed in the first quarter of this year to its lowest rate in two years on Thursday, consequently prompting an aggressive move to the upside on USD/CAD. As you can see, the pair found supportive structure off March/May’s opening levels seen on the H4 timeframe at 1.2836, and ripped through offers sited at 1.29, leaving H4 action free to top just south of the key figure 1.30 going into the close.
As can be seen on the weekly timeframe, though, price remains capped at the underside of a weekly resistance area coming in at 1.3006-1.3115, and is on track to close the week out in the shape of an indecision candle. Daily flow, as expected, found active buyers off 1.2752/1.2885 (green circle) yesterday, lifting price action up to just ahead of resistance penciled in at 1.3001.
Areas of consideration:
Eyes are once again on the H4 supply zone drawn just above 1.30 at 1.3054-1.3010 for potential short plays, which happens to be positioned within the walls of the current weekly supply.
An ideal sell signal, similar to the setup posted earlier in the week, would be a H4 bearish pin-bar formation that pierces through 1.30 and tags the noted H4 supply. This will trip stops above 1.30 (providing liquidity to those selling) and bring in sellers from the H4 supply. Entering short on the close of this candle configuration is high probability, in our view. Stop-loss orders are best situated above the aforesaid H4 supply, with the first take-profit target seen around 1.29.
Today’s data points: US job’s figures; US ISM manufacturing PMI.
USD/CHF:
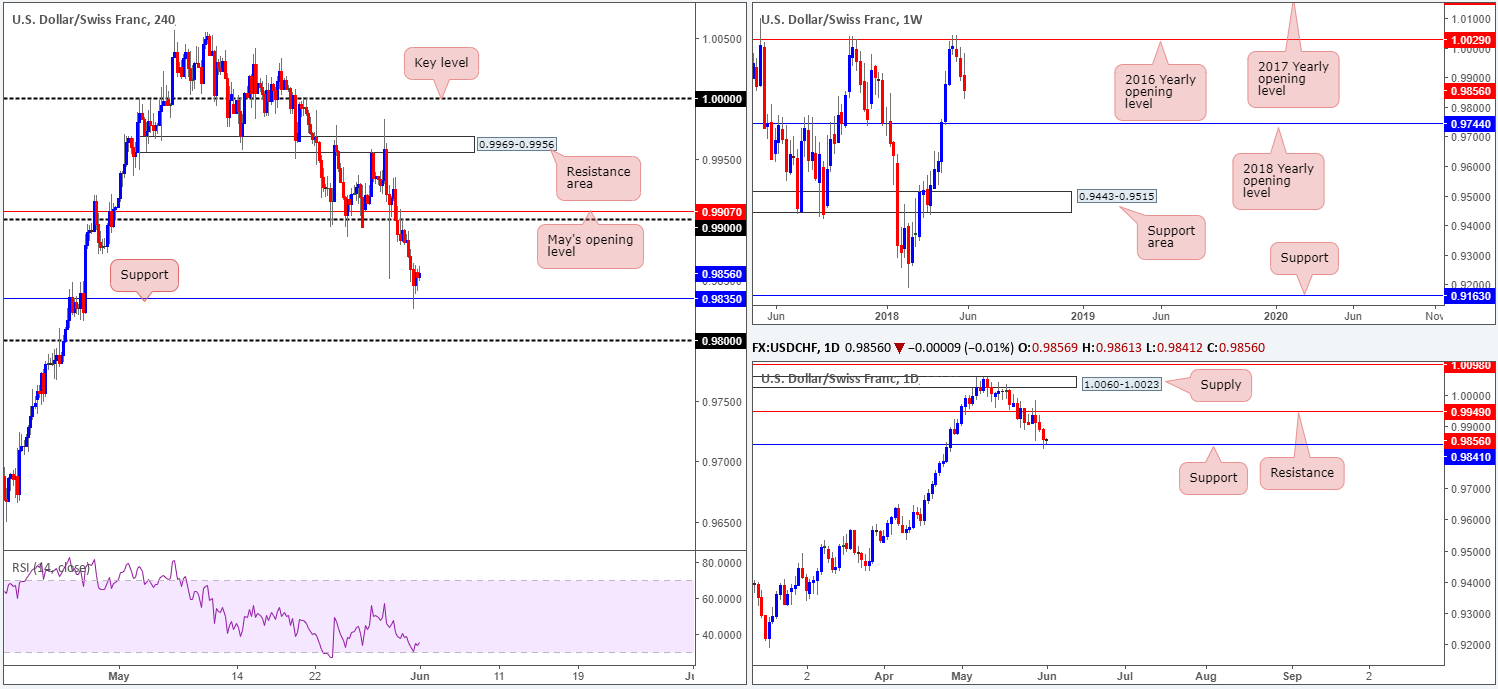
During the course of Thursday’s sessions, the Swiss Franc was reasonably well bid on safe-haven grounds as global trade war tensions ramped up again in early trade.
Well done to any of our readers who managed to jump aboard yesterday’s move off 0.99, as it was a noted setup to watch for in Thursday’s report. As is evident from the H4 timeframe, the pair continued pressing lower until H4 support at 0.9835, where movement mildly pared losses going into the closing bell. It should not really come as much of a surprise to see this barrier hold ground, since it fuses closely with daily support priced in at 0.9841.
Despite this bullish presence, though, weekly flow continues to emphasize a bearish climate. After a strong push lower from the 2016 yearly opening level at 1.0029, there’s really not very much support seen in view until the unit reaches the 2018 yearly opening level marked at 0.9744.
Areas of consideration:
Neither a long nor short seems attractive at current price. Irrespective of the direction one selects, you’ll face higher-timeframe opposition. On account of this, the team has labelled this market as ‘flat’ for now, with the option of reassessing structure following today’s NFP.
Today’s data points: US job’s figures; US ISM manufacturing PMI.
Dow Jones Industrial Average:
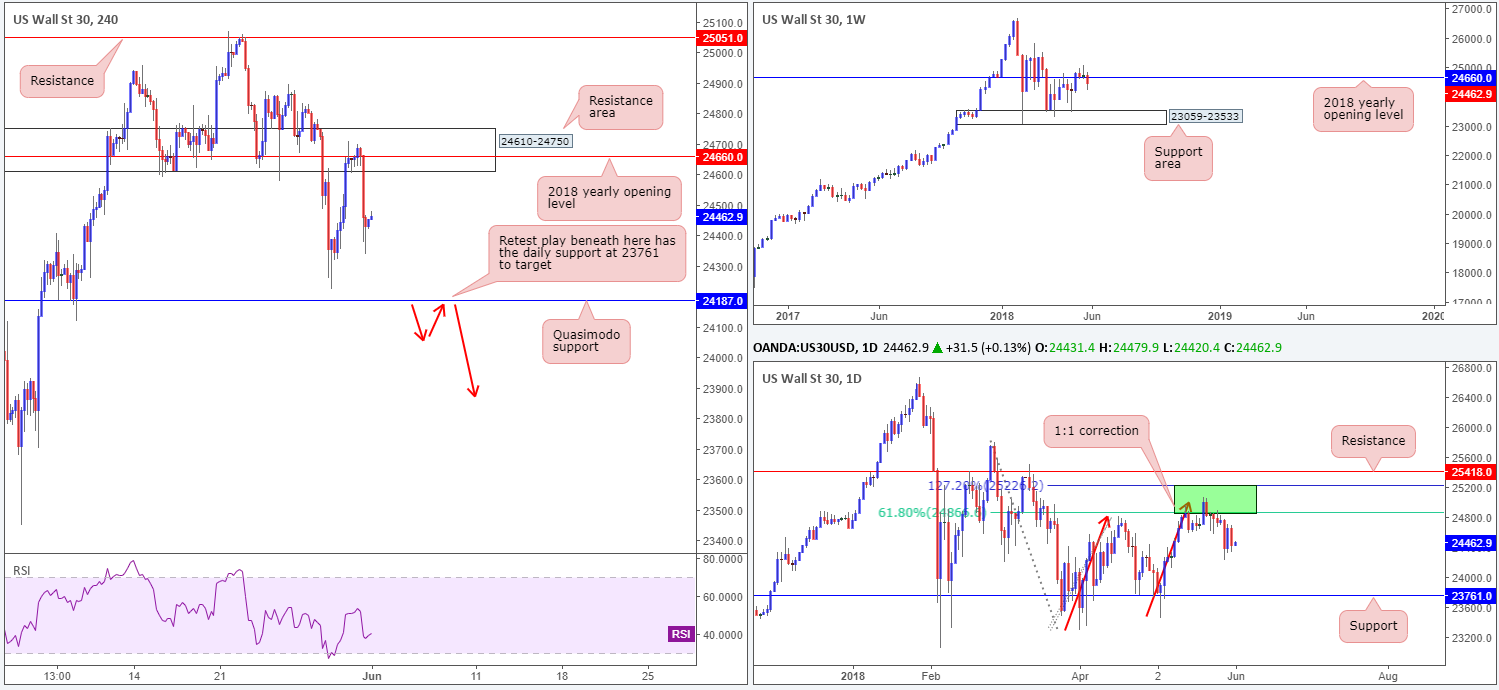
US Commerce Secretary Ross announced the EU, Canada and Mexico will face a 25% tariff on steel and 10% on aluminum from midnight on Thursday, emphasizing a strong possibility of a trade war.
US equities responded negatively to the recent news. The index aggressively turned lower from the H4 resistance area priced in at 24610-24750, which happens to hold the 2018 yearly opening level seen printed on the weekly timeframe at 24660 within its walls. For those who read Thursday’s report you may recall the team highlighting this area as a potential sell zone, so well done to any of our readers who jumped aboard this move!
Yesterday’s selling, as you can probably see, forced weekly action sub 24666: the 2018 yearly opening level on the weekly timeframe. Daily movement shows room to press as far south as support drawn from 23761, and H4 action is seen poised to challenge a H4 Quasimodo support marked at 24187.
Areas of consideration:
Those who are short from 24610-24750, reducing risk to breakeven may now be a good idea. Ultimately, though, the expectation going forward is for further downside to at least the noted H4 Quasimodo support. A break beyond this number would be a strong cue that the unit could approach the aforementioned daily support. As you can see, the potential reward for huge gains is certainly possible for sellers here!
For folks who missed the initial short, all may not be lost. Waiting for H4 price to close below 24187 could be an option. A retest to the underside of this number is worthy of a sell, in our view, targeting the noted daily support (as per the red arrows).
Traders may also want to note, however, that we have the mighty US NFP report scheduled for release later on today. Technicals tend to take a back seat leading up to and during the release, so do trade with caution.
Today’s data points: US job’s figures; US ISM manufacturing PMI.
XAU/USD (Gold)
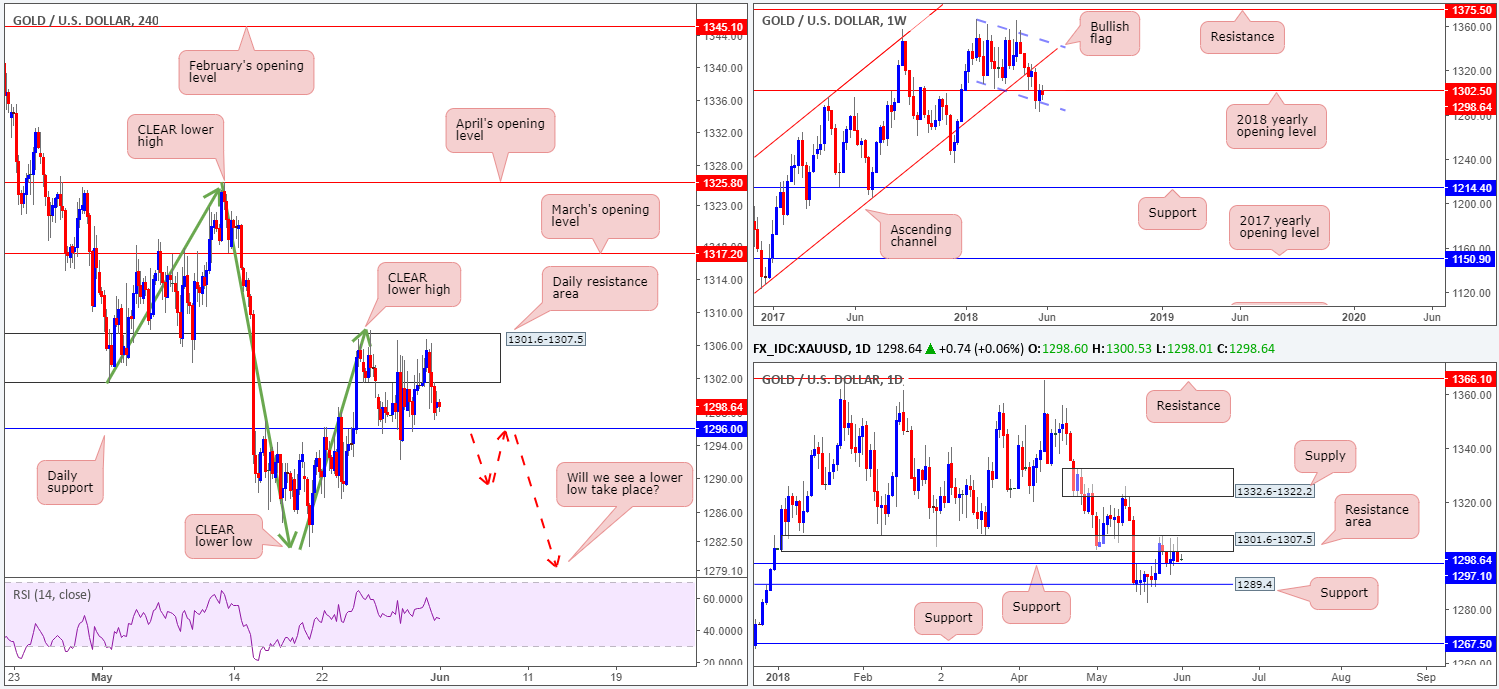
Since the beginning of the week, the yellow metal has traded in a somewhat directionless state between a daily resistance area at 1301.6-1307.5 and a daily support drawn from 1296.0. Overall, though, our bias remains unchanged. Despite the market’s ranging behavior, further downside is still possible in this market we believe. Our confidence largely comes from knowing that the 2018 yearly opening level sited on the weekly timeframe at 1302.5 resides within the daily resistance area.
Areas of consideration:
We’re eventually expecting a lower low to form on the H4 scale (a break of the swing low 1285.8). So, waiting and seeing if H4 price can close below the noted daily support and chalk up a retest as resistance (see red arrows) is recommended, as this would be considered a high-probability shorting opportunity.
With today’s NFP just around the corner, however, traders are reminded that technical could possibly take a back seat during the event.
The use of the site is agreement that the site is for informational and educational purposes only and does not constitute advice in any form in the furtherance of any trade or trading decisions.
The accuracy, completeness and timeliness of the information contained on this site cannot be guaranteed. IC Markets does not warranty, guarantee or make any representations, or assume any liability with regard to financial results based on the use of the information in the site.
News, views, opinions, recommendations and other information obtained from sources outside of www.icmarkets.com.au, used in this site are believed to be reliable, but we cannot guarantee their accuracy or completeness. All such information is subject to change at any time without notice. IC Markets assumes no responsibility for the content of any linked site. The fact that such links may exist does not indicate approval or endorsement of any material contained on any linked site.
IC Markets is not liable for any harm caused by the transmission, through accessing the services or information on this site, of a computer virus, or other computer code or programming device that might be used to access, delete, damage, disable, disrupt or otherwise impede in any manner, the operation of the site or of any user’s software, hardware, data or property.


