
A note on lower timeframe confirming price action…
Waiting for lower timeframe confirmation is our main tool to confirm strength within higher timeframe zones, and has really been the key to our trading success. It takes a little time to understand the subtle nuances, however, as each trade is never the same, but once you master the rhythm so to speak, you will be saved from countless unnecessary losing trades. The following is a list of what we look for:
- A break/retest of supply or demand dependent on which way you’re trading.
- A trendline break/retest.
- Buying/selling tails/wicks – essentially we look for a cluster of very obvious spikes off of lower timeframe support and resistance levels within the higher timeframe zone.
- Candlestick patterns. We tend to only stick with pin bars and engulfing bars as these have proven to be the most effective.
We search for lower timeframe confirmation between the M15 the H1 timeframes, since most of our higher-timeframe areas begin with the H4. Stops are usually placed 5-10 pips beyond confirming structures.
EUR/USD:
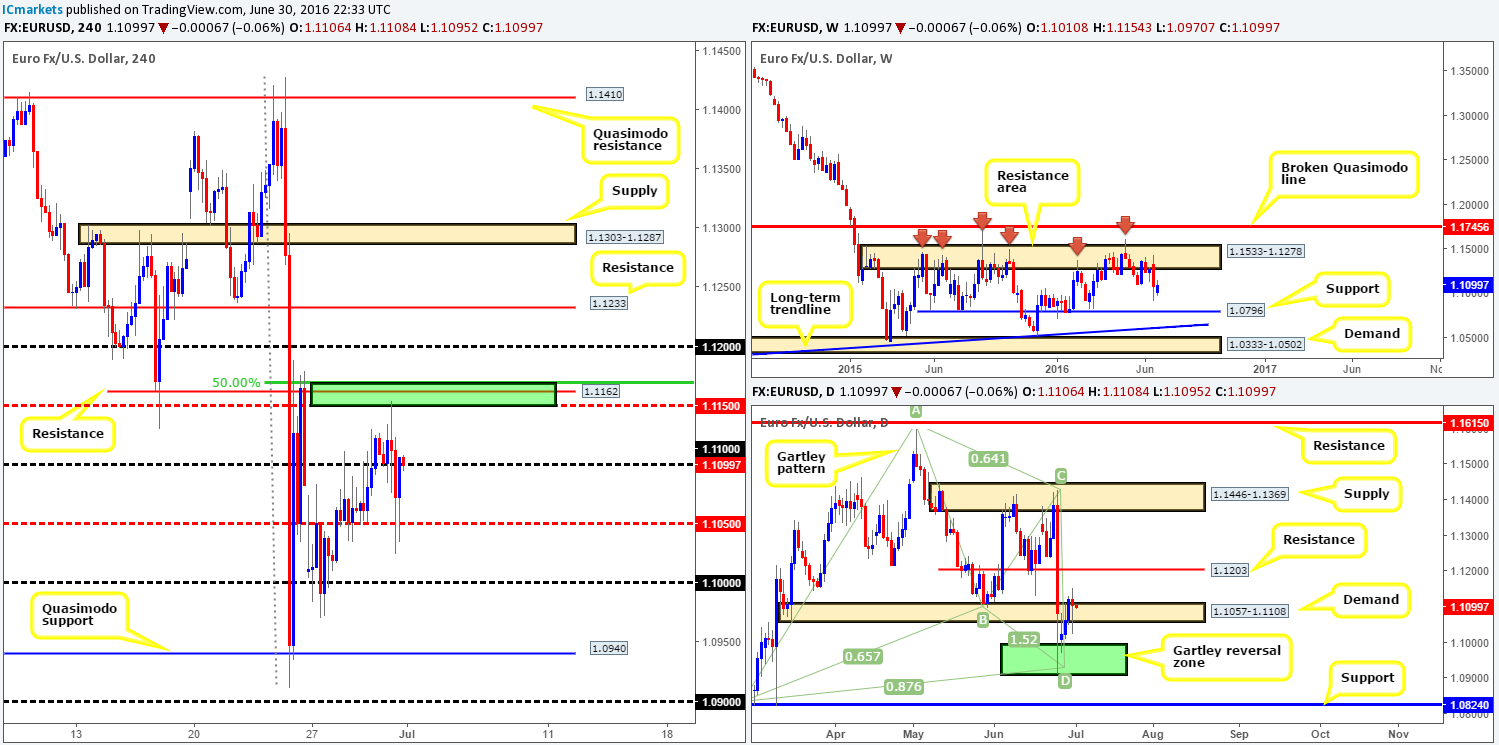
Starting from the top this morning, we can see that the buyers and sellers remain battling for position between a large weekly resistance area drawn from 1.1533-1.1278 and a weekly support line seen at 1.0796. The upper zone has held price lower since May 2015, whilst the lower level, which has also been an active barrier for around the same time, suffered a breach during the month of November 2015.
Moving down to the daily candles, the shared currency has been etching out consecutive highs since rebounding from the daily Gartley reversal zone (1.0910/1.0994). This has, as you can see from the chart, taken out daily supply at 1.1057-1.1108 which for the time being is providing demand. In the event that the buyers remain dominant here, price could surge higher to connect with daily resistance registered at 1.1203.
Stepping across to the H4 chart, mid-morning trade over in London yesterday saw offers filled at the H4 mid-way resistance point 1.1150 (also brings together a H4 resistance at 1.1162 and a H4 50.0% Fib resistance at 1.1170 [green box]). Well done to any of our readers who managed to short this zone as it was a noted move to watch for in our previous report. Unfortunately we missed it as we were unable to pin down lower timeframe confirmation!
In that the pair is now finding support above the 1.11 handle, where does one go from here? Well, buying is a possibility since price is loitering around a daily demand at the moment with little overhead resistance seen on both the weekly and daily timeframes until the 1.12 mark (see above).
Our suggestions: To buy from 1.11 today, however, we would require a lower timeframe buy signal to avoid the dreaded whipsaw which is very common around psychological numbers. Furthermore, we would strongly advise closing partial profits at 1.1150 and reducing risk to breakeven due to the possibility of residual offers may still lurk around this prior H4 sell zone.
A lower timeframe buy signal for our team is either a break of a supply followed by a subsequent retest, a trendline break/retest or simply a collection of well-defined buying tails around the higher timeframe level.
Levels to watch/live orders:
- Buys: 1.11 region [Tentative – confirmation required] (Stop loss: dependent on where one confirms this area).
- Sells: Flat (Stop loss: N/A).
GBP/USD:
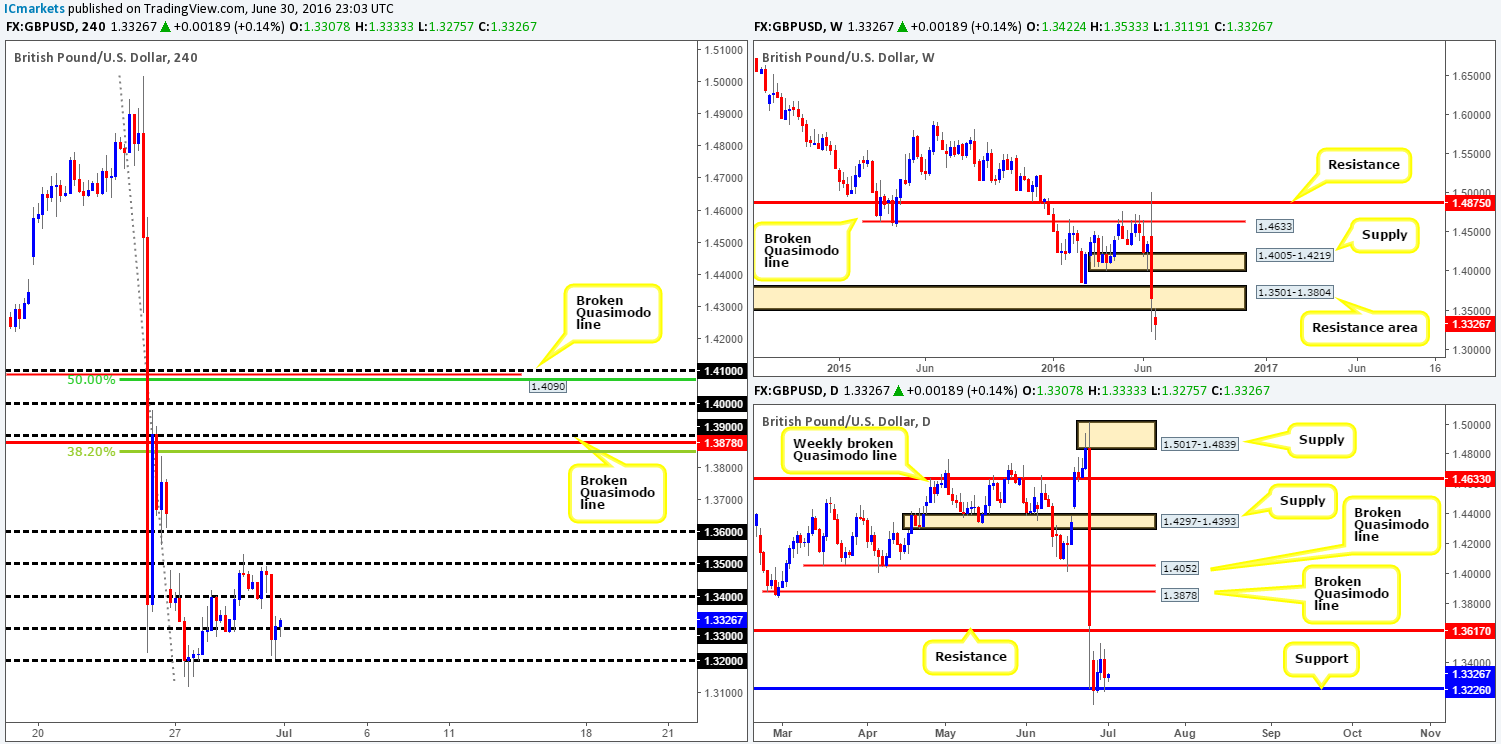
Cable’s bullish recovery took a turn for the worst yesterday, as the BoE’s Governor Mark Carney suggested rates may be cut in the summer to deal with the fallout of the ‘Brexit’ vote. Close to 200 pips were lost in the space of an hour on the back of this comment, consequently forcing prices to touch base with lows of 1.3205 going into the London close.
Technically, weekly bears still appear in good shape in this market as they remain below the weekly resistance area at 1.3501-1.3804. However, both the H4 and daily charts show supportive structure is beginning to form around the 1.32 region – essentially the referendum lows.
Our suggestions: One could always look to buy above the 1.33 handle today, but be warned that weekly bears are likely lurking overhead (see above). For us, we have chosen to remain flat in this market going into the weekend, due to both an unfavorable technical picture and the ongoing political uncertainty surrounding this pair.
Levels to watch/live orders
- Buys: Flat (Stop loss: N/A).
- Sells: Flat (Stop loss: N/A).
AUD/USD:
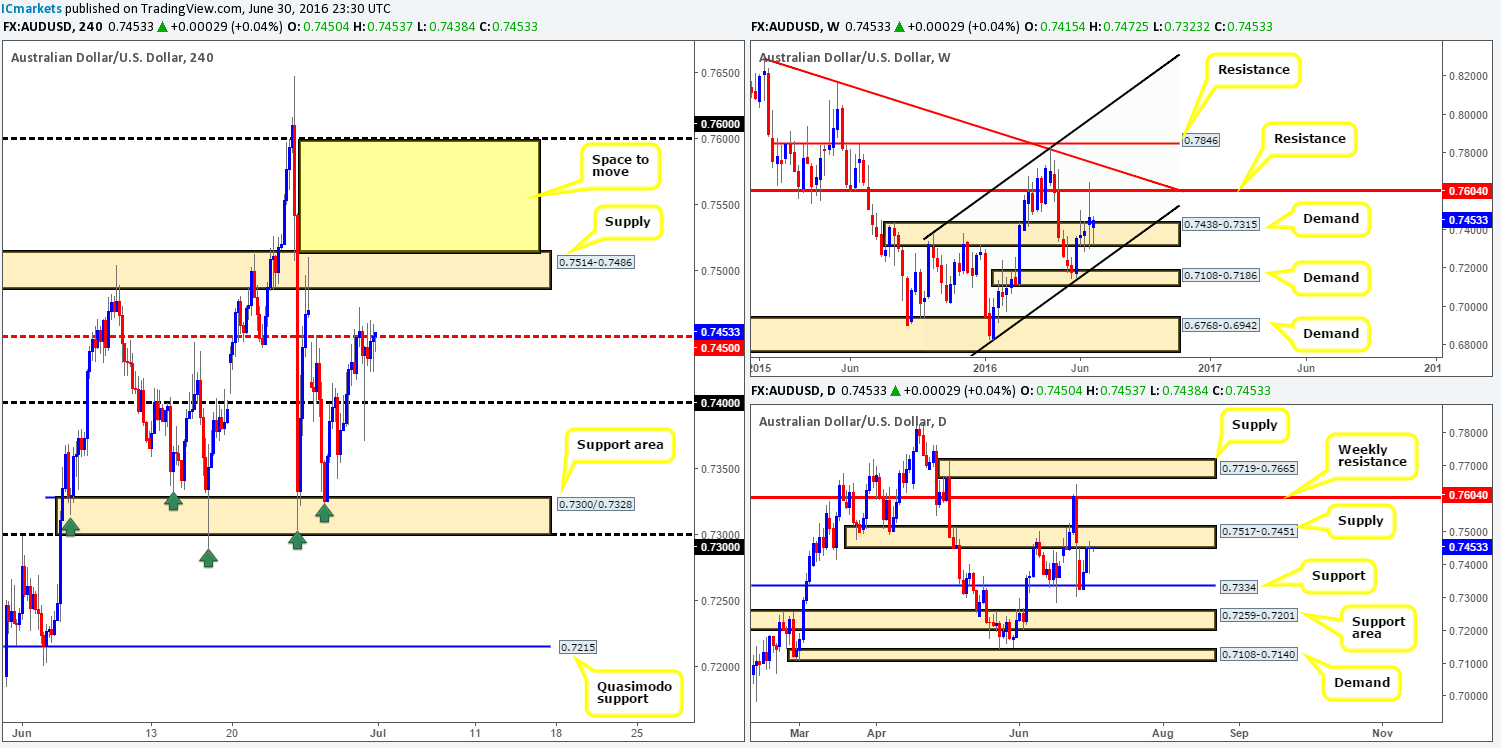
Despite the commodity currency ranging just over 100 pips during the course of yesterday’s trading, price closed the day unchanged. In spite of this, a truckload of stops were likely triggered around the 0.74 handle as London began the day by aggressively spiking down to lows of 0.7371.
In that the Aussie is now seen chewing on the underside of a H4 mid-way resistance line at 0.7450, what’s the vibe like on the higher timeframes. Well, weekly action continues to reflect more of a bullish stance from weekly demand at 0.7438-0.7315. Not only this, but there’s room on the weekly chart seen to extend up to weekly resistance at 0.7604. Conversely, daily movement remains flirting with the underside of a daily supply fixed at 0.7517-0.7451. The next upside target beyond this zone is the aforementioned weekly resistance line.
Our suggestions: Much the same as in yesterday’s report, our team is humbly going to pass on selling this market due to weekly structure (see above). All is not lost though! Should the Aussie continue to climb today, as the weekly timeframe suggests, a close above H4 supply at 0.7514-0.7486 would be interesting. This move would, as far as we can see, achieve the following:
- Remove offers from the current H4 supply and open the trapdoor for a rally up to the 0.76 handle (a nice take-profit target which coincides beautifully with weekly resistance at 0.7604).
- Clear offers around the current daily supply area and likely set the stage for a continuation move up to the weekly resistance at 0.7604.
- A retest of the H4 supply as demand would, as long as a lower timeframe buying signal is seen (please see the top of this report for confirming techniques), be enough for us to consider buying this market as let’s not forget that we’re actually buying alongside weekly flow (see above).
Levels to watch/live orders:
- Buys: Watch for price to consume H4 supply at 0.7514-0.7486 and look to trade any retest seen thereafter (lower timeframe confirmation required).
- Sells: Flat (Stop loss: N/A).
USD/JPY:
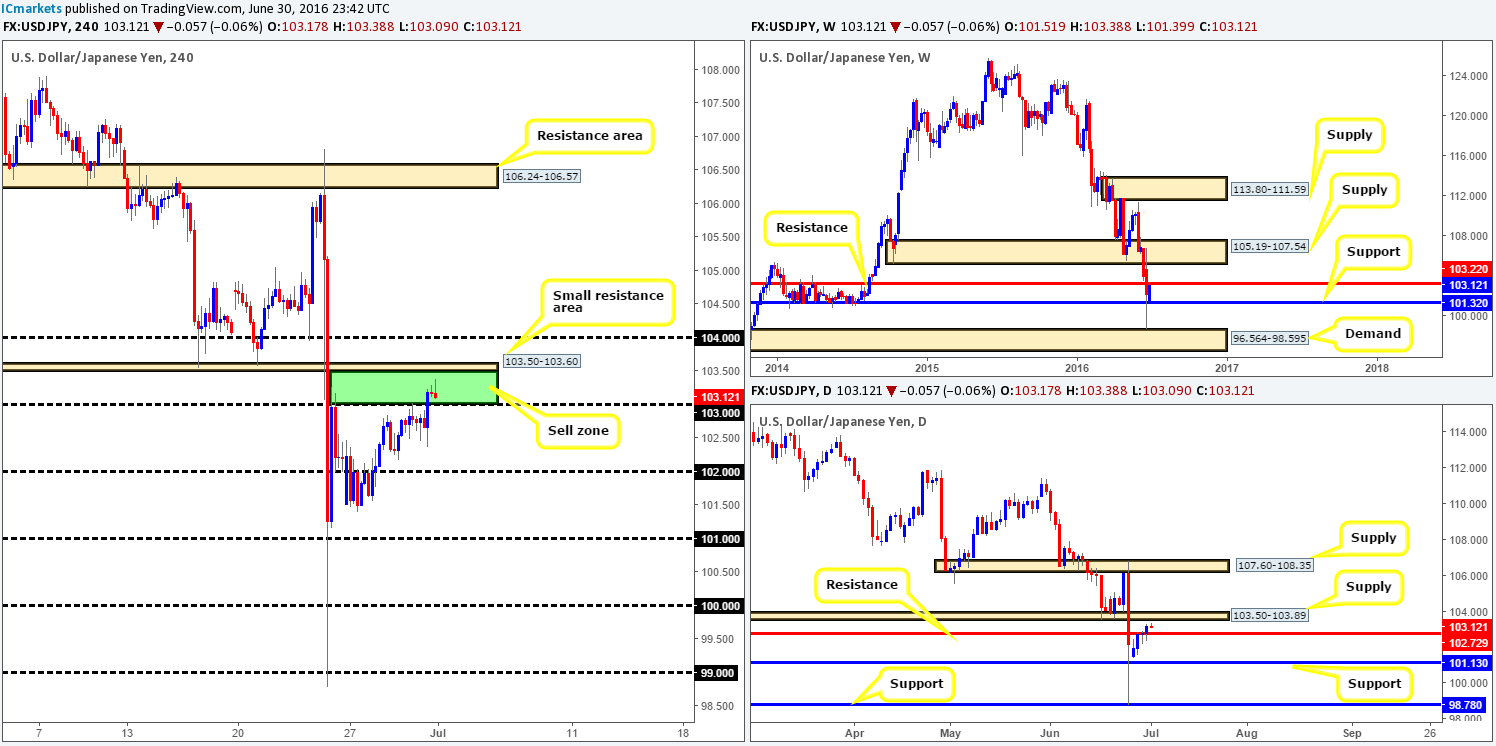
The value of the USD/JPY increased for the fourth consecutive day yesterday, bringing the pair to highs of 103.29 by the close. Consequent to this, weekly price has now connected with a long-term weekly resistance line coming in at 103.22. In conjunction with this, daily action is also seen trading within touching distance of a daily supply base carved from 103.50-103.89.
Our suggestions: Put simply, our team is looking to sell on the close of the current H4 pin bar, as it’s forming within a green H4 sell zone comprised of the 103 handle and a small H4 resistance area at 103.50-103.60. What makes this barrier so strong is the fact that the weekly resistance line mentioned above at 103.22 slices through the middle of this zone! The only grumble of course is that price may find support at 103 before dropping lower!
We would also advise any of our readers who are interested in taking this trade to be conservative in regards to stop placement. Our stop will be placed at 103.66 – just above the current H4 resistance area since this will give the trade room to breathe.
Levels to watch/live orders:
- Buys: Flat (Stop loss: N/A).
- Sells: Looking to sell on the close of the current H4 candle with a stop placed at 103.66.
USD/CAD:
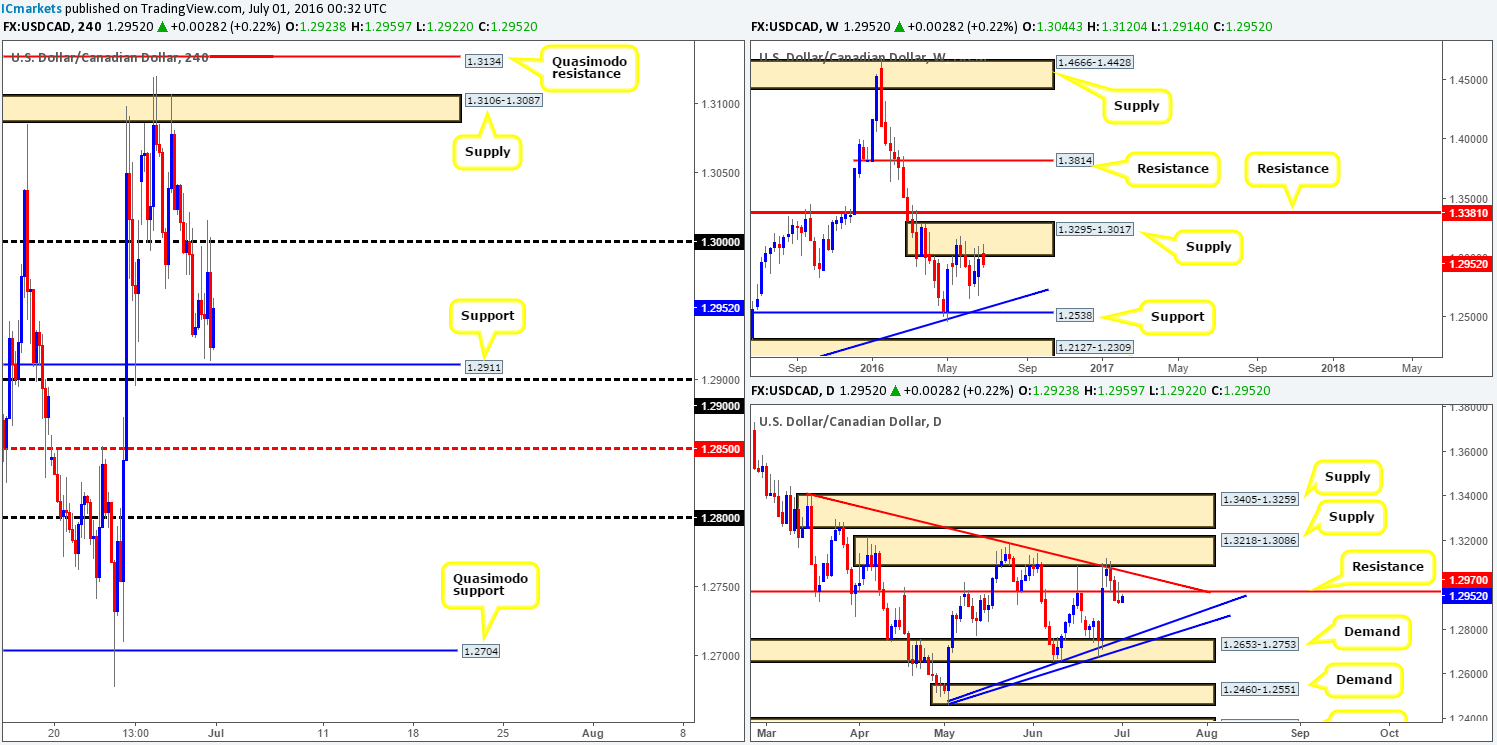
From the weekly chart, we can see that supply at 1.3295-1.3017 continues to hold this market lower. Assuming that the bid-side of this market remains weak, it is possible we may see this pair strike the weekly trendline support taken from the high 1.1278 sometime next week. In-line with weekly expectations, the daily chart shows price retested daily resistance at 1.2970 yesterday and held firm. The next downside target from this line can be seen around the daily trendline support extended from the low 1.2460. Despite the higher timeframes indicating selling to be the better option, H4 action remains trading just ahead of H4 support at 1.2911, which, as you can see, is positioned just above the 1.29 handle.
Our suggestions: As we mentioned in Thursday’s report, selling this market will only be possible for us on a close below 1.29. Should this come to fruition today, we’d also require price to retest 1.29 as resistance along with a lower timeframe sell signal to avoid being whipsawed. For those who agree with our approach, you may want to check out the top of this report for a list of the lower timeframe entry techniques that we use. In regards to targets, we’ll ultimately be looking to close 50% at the H4 mid-way support 1.2850, followed closely by the 1.28 handle, as at this point price will be nearing the aforementioned daily trendline.
Levels to watch/live orders:
- Buys: Flat (Stop loss: N/A).
- Sells: Watch for price to consume the 1.29 handle and look to trade any retest seen thereafter (lower timeframe confirmation required).
USD/CHF:
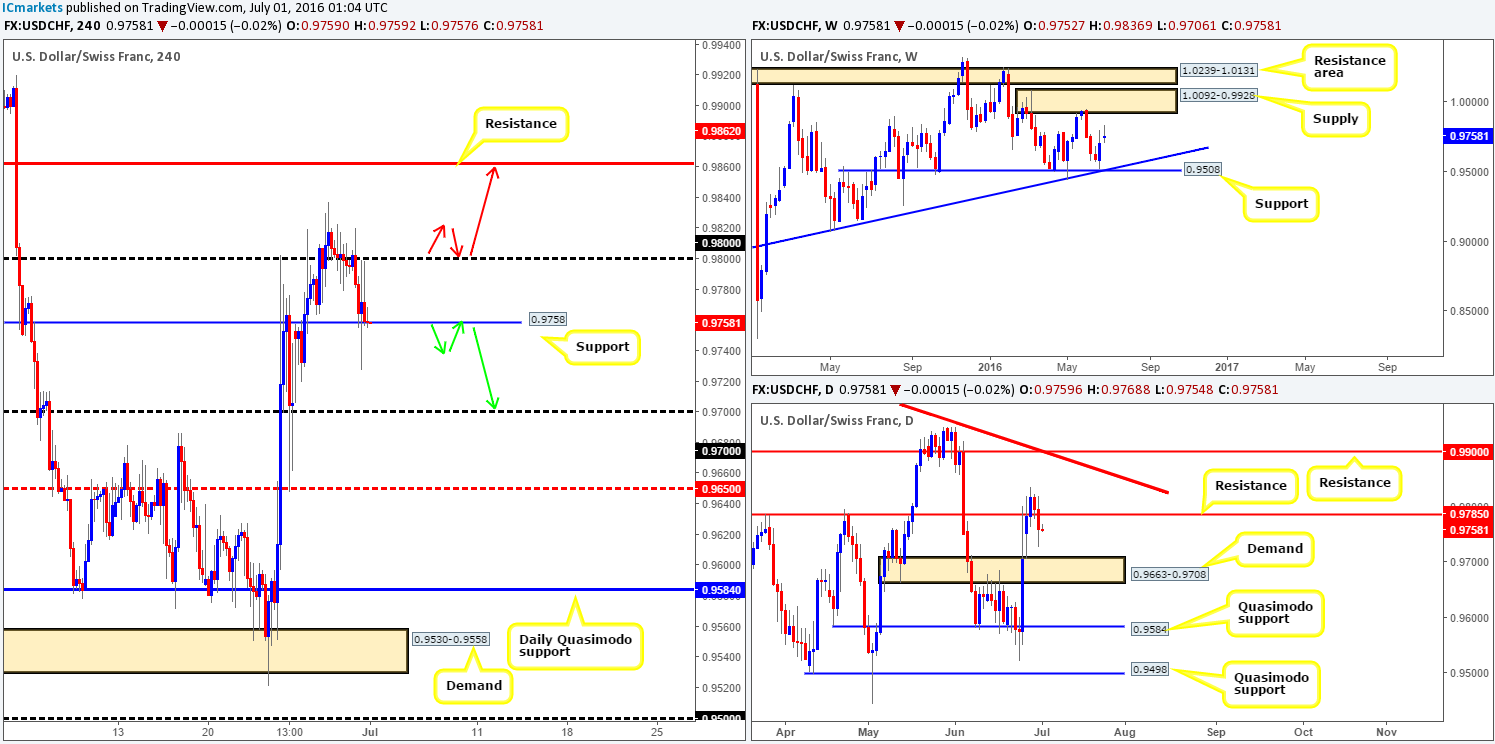
Month-end flows saw the USD/CHF pair push down to H4 support at 0.9758 yesterday. The whipsaw seen through this level was likely due to comments made by the BoE regarding the possibility of rate cuts this summer.
Our team has absolutely no interest in trading between the above said H4 support line and the 0.98 handle today. What we are interested in, however, are the barriers seen beyond these lines. To the downside, the 0.97 handle awaits, whilst to the upside, we have our eye on the H4 resistance at 0.9862.
Thanks to yesterday’s sell-off, the Swissy took out daily support at 0.9785 (now acting resistance), and appears clear to trade down to daily demand drawn from 0.9663-0.9708. The top-side of this area, as you can probably already see, lines up beautifully with the 0.97 handle – the next downside target on the H4 timeframe. Despite this, let’s not forget that the weekly chart remains well-bid following last week’s bullish move from just above weekly support at 0.9508, with room seen to stretch up to weekly supply at 1.0092-0.9928.
Our suggestions: As far as we see, there’s equal opportunity to trade this pair both long and short today. If price closes below the current H4 support, short trades are possible down to 0.97, likewise, a close above 0.98 opens up the gates for a potential long trade towards the H4 resistance at 0.9862.
Now, we would not simply pull the trigger upon a close beyond one of the above said barriers. This is breakout trading and this has never agreed with us! To trade here would require price to retest the broken line (as per the colored arrows), followed by a lower timeframe signal before risking capital (see the top of this report for information on lower timeframe entry signals).
Levels to watch/live orders:
- Buys: Watch for price to consume the 0.98 handle and look to trade any retest seen thereafter (lower timeframe confirmation required).
- Sells: Watch for price to consume H4 support at 0.9758 and look to trade any retest seen thereafter (lower timeframe confirmation required).
DOW 30:
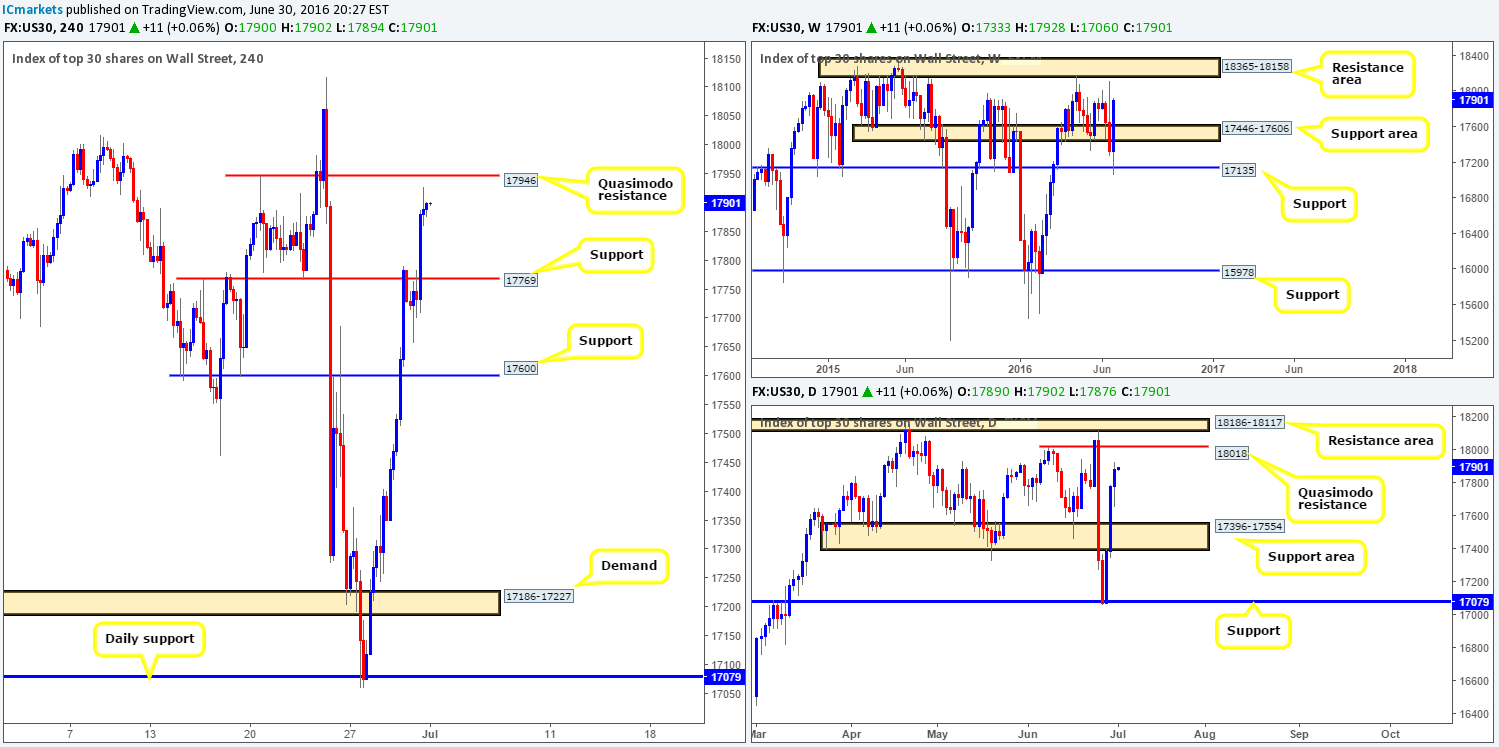
Stocks rallied for a third consecutive day yesterday, peaking at highs of 17928. H4 resistance at 17769, although managing to suppress buying pressure for the majority of the London session, was taken out going into US trade (now acting support).
Seeing as price is now inches away from connecting with the H4 Quasimodo resistance line at 17946, and daily action is seen within shouting distance of a daily Quasimodo resistance at 18018, where does one go from here? Well, both of these barriers are attractive. Our only grumble here is the fact that the weekly picture shows room for this market to continue marching north until at least the weekly resistance area at 18365-18158.
Our suggestions: In light of the above points, our team has decided that the more conservative route to take in this market is to look at shorting the daily Quasimodo resistance line at 18018. The reasons for why are as follows:
- Selling from the H4 Quasimodo resistance line at 17946 is highly likely to be whipsawed as traders may look to tag in the aforementioned daily Quasimodo level.
- By trading the daily Quasimodo level one also has the choice of placing their stop above the daily resistance area seen at 18186-18117 (glued to the underside of the aforementioned weekly resistance area).
Levels to watch/live orders:
- Buys: Flat (Stop loss: N/A).
- Sells: 18018 [Dependent on the approach and time of day this line could be good for a market order] (Stop loss: 18208).
Gold:
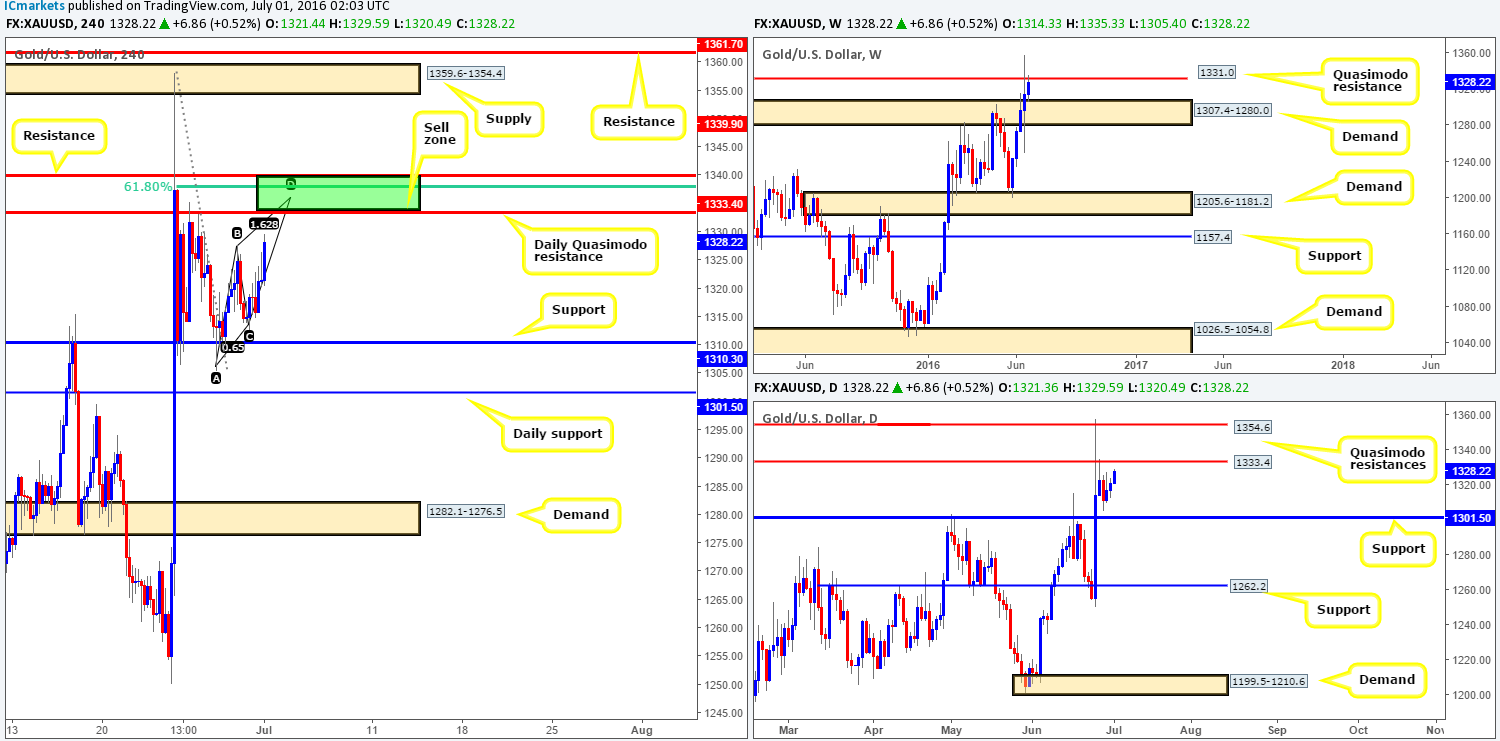
Going into this morning’s open, we can see the yellow metal is extremely well-bid. Consequent to this, price is currently approaching the daily Quasimodo resistance band at 1333.4, which, in our book, is a very interesting level for the following reasons:
- Weekly bears also testing a weekly Quasimodo resistance at 1331.0.
- H4 61.8% Fib resistance line at 1337.9 sits just above the daily Quasimodo line.
- A H4 resistance level at 1339.9 seen above the aforementioned H4 Fib level.
- H4 AB=CD approach which tops out at 1335.8.
The green box on the H4 chart is, as far as we can see, a very high-probability reversal zone since it shows a strong band of confluence! Therefore, we will be looking to short this unit at 1332.8 with a stop-loss order placed above at 1341.1. The first take-profit target will depend on how the H4 approaches as we usually look to take partial profits at the first area of demand.
Levels to watch/live orders:
- Buys: Flat (Stop loss: N/A).
- Sells: 1332.8 [Pending order] (Stop loss: 1341.1)


