
EUR/USD:
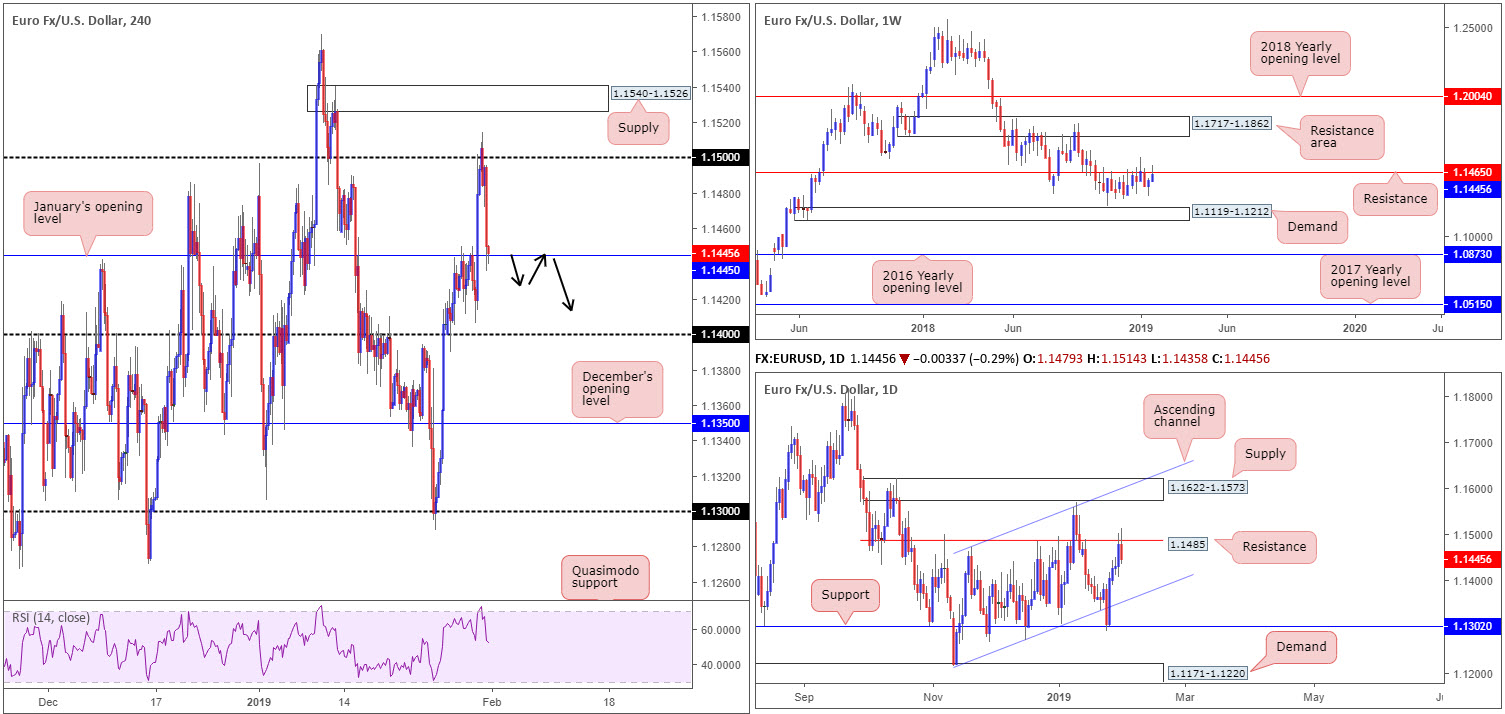
Despite a reasonably impressive run to the upside this week, the single currency went back to playing on the defensive Thursday. Resistance elbowed its way into the spotlight in the form of the 1.15 handle on the H4 timeframe after price failed to sustain gains beyond 1.1514. Exacerbated on ECB’s Weidmann comments regarding poor German growth figures and several years until ECB’s normalization, the H4 candles clocked session lows of 1.1435, though remains supportive at January’s opening level drawn from 1.1445 at the time of writing.
Weekly and daily structure, nonetheless, reveal further selling could be in store. Weekly movement is seen fading resistance coming in at 1.1465, along with daily price witnessing a measured response off resistance priced in at 1.1485. The nearest area of support on the bigger picture falls in around the daily ascending channel support (etched from the low 1.1215).
Areas of consideration:
Ultimately, the research team feels the euro will continue to search lower ground against its US counterpart today and possibly into next week. With that being the case, entering long from January’s opening level at 1.1445 is chancy. A H4 close below this number, on the other hand, that’s followed up with a retest as resistance in the shape of a bearish candlestick formation (traders have the option of using this structure to define entry and stop parameters) could, knowing we’re coming from resistance on the higher timeframes, be worthy of consideration, targeting 1.14 as the initial take-profit target.
Today’s data points: EUR CPI Flash Estimate y/y; EUR Core CPI Flash Estimate y/y; US Average Hourly Earnings m/m; US Non-Farm Employment Change; US Unemployment Rate; US ISM Manufacturing PMI; US Revised UoM Consumer Sentiment.
GBP/USD:
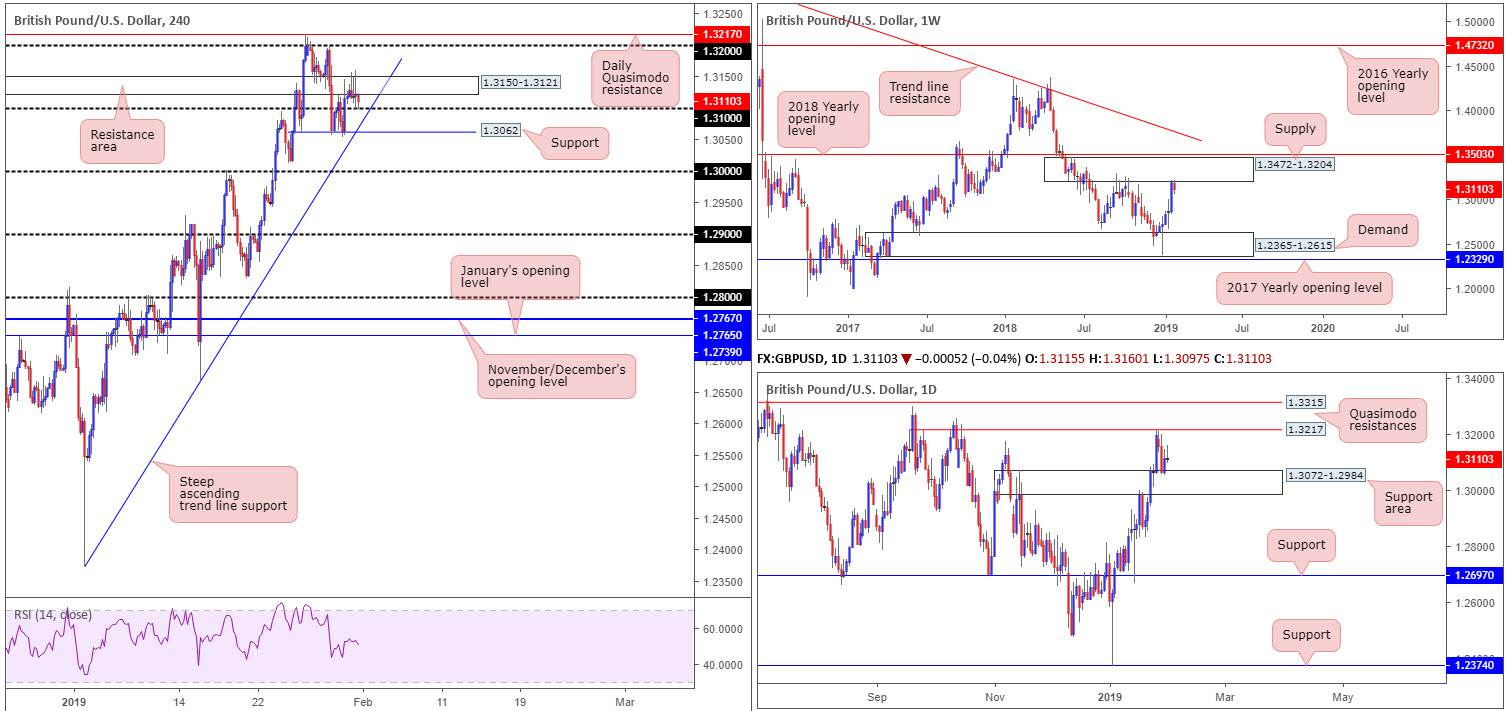
Hindered on Brexit concerns and technical structure, the GBP/USD experienced choppy action Thursday, consequently finishing the day unmoved.
H4 structure, as you can probably see, is constrained. The resistance area at 1.3150-1.3121 provided hefty intraday resistance yesterday, while to the downside nearby support draws from the 1.31 handle, shadowed closely by a steep trend line support (extended from the low 1.2373) along with another layer of support (resembles a triple-bottom formation) seen at 1.3062. Beyond this barrier, limited support is visible until key figure 1.30 enters the mix.
In addition to the above, higher-timeframe areas continue to offer a mixed opinion. Weekly price is engaging with the lower boundary of supply drawn from 1.3472-1.3204. Tailed closely by a 2018 yearly opening level at 1.3503, the current supply, which already capped upside successfully once already in October 2018, houses a healthy chance of repeating history here. A closer reading of the market, however, reveals recent selling pressured the pair towards a support area coming in at 1.3072-1.2984, which has held ground thus far. The important thing to consider here is the daily area fuses with the layer of H4 support mentioned above at 1.3062, as well as the 1.30 handle.
Areas of consideration:
Outlook remains unchanged due to lacklustre movement.
According to our technical studies on all three timeframes, neither a long nor short appears attractive from a medium-term standpoint. Irrespective of the direction one selects, you’ll face opposing structure. For that reason, opting to remain on the sidelines remains the safer path to take.
Today’s data points: UK Manufacturing PMI; US Average Hourly Earnings m/m; US Non-Farm Employment Change; US Unemployment Rate; US ISM Manufacturing PMI; US Revised UoM Consumer Sentiment.
AUD/USD:
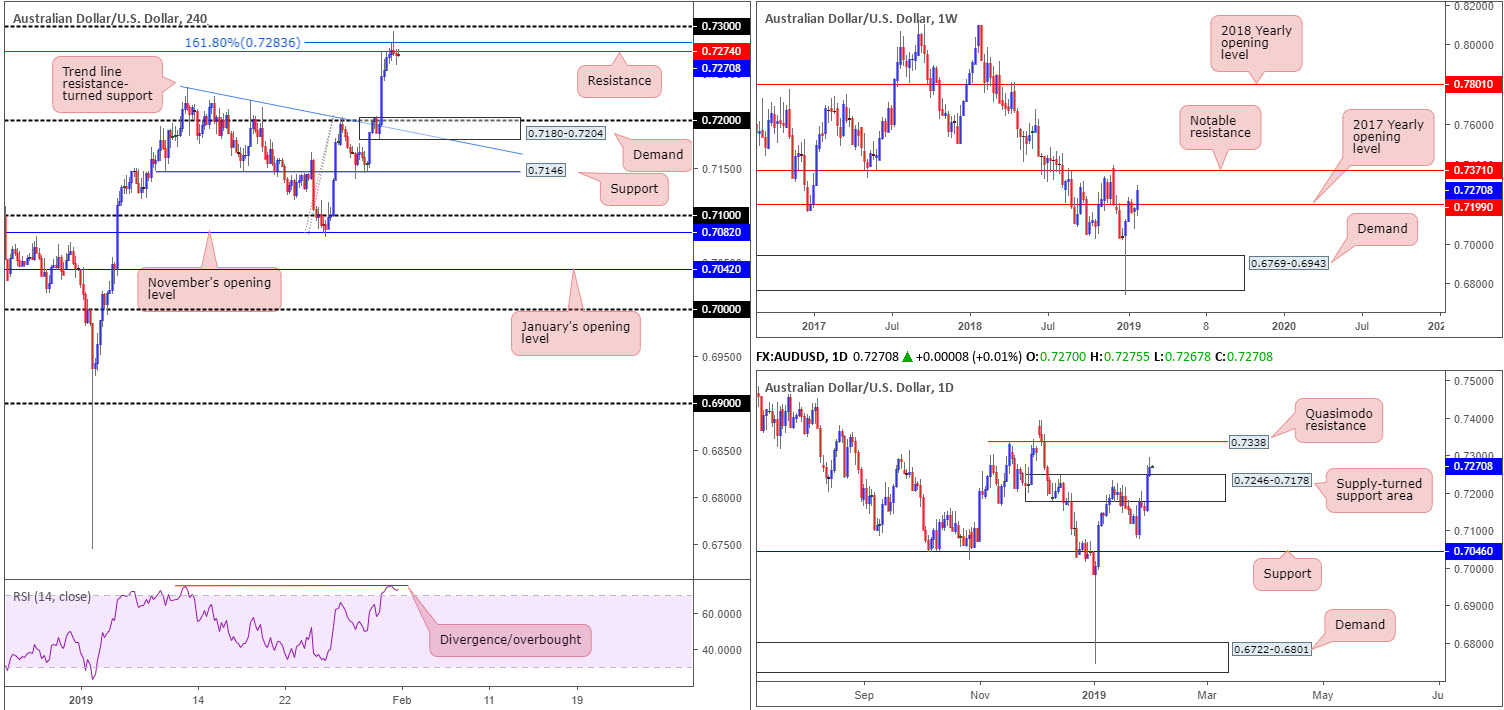
Upbeat data out of China in the early hours of Thursday morning provided the commodity-driven Australian dollar fresh impetus. Things, however, turned sour following open markets in the US, topping a few pips south of the 0.73 handle and retreating lower by way of a bearish pin-bar configuration. Additional H4 resistance is seen close by in the form of a 161.8% Fibonacci ext. point at 0.7283 and resistance carved from 0.7274. Sellers are also likely drawn to this region due to the RSI indicator displaying a divergence reading deep within overbought terrain.
Regardless of the story on the H4 timeframe, the higher-timeframe picture continues to reflect a relatively strong bullish stance. Weekly flow, thanks to recent buying, overthrew resistance at 0.7199: the 2017 yearly opening level and perhaps unlocked the pathway north towards notable resistance at 0.7371. The story on the daily timeframe has the pair cycling above the top edge of a supply-turned support area stationed at 0.7246-0.7178. The move above this area likely filled stop-loss orders from a large portion of traders short here and filled a number of breakout buyers, too. The next port of call beyond these walls falls in at a Quasimodo resistance level at 0.7338.
Areas of consideration:
Assuming the higher-timeframe analysis is accurate, selling H4 structure is difficult towards 0.72. However, having observed a strong H4 bearish pin-bar pattern (entry/stop parameters can be defined according to this pattern) emerge from between 0.73/0.7274, it may be worth the risk, as long as risk/reward parameters are correctly factored into the trade (at least a 1:2 ratio).
In terms of buying opportunities, many traders are unlikely to commit until 0.73 is consumed. Above 0.73, the next area of resistance is seen at the daily Quasimodo resistance level mentioned above at 0.7338.
Today’s data points: US Average Hourly Earnings m/m; US Non-Farm Employment Change; US Unemployment Rate; US ISM Manufacturing PMI; US Revised UoM Consumer Sentiment.
USD/JPY:
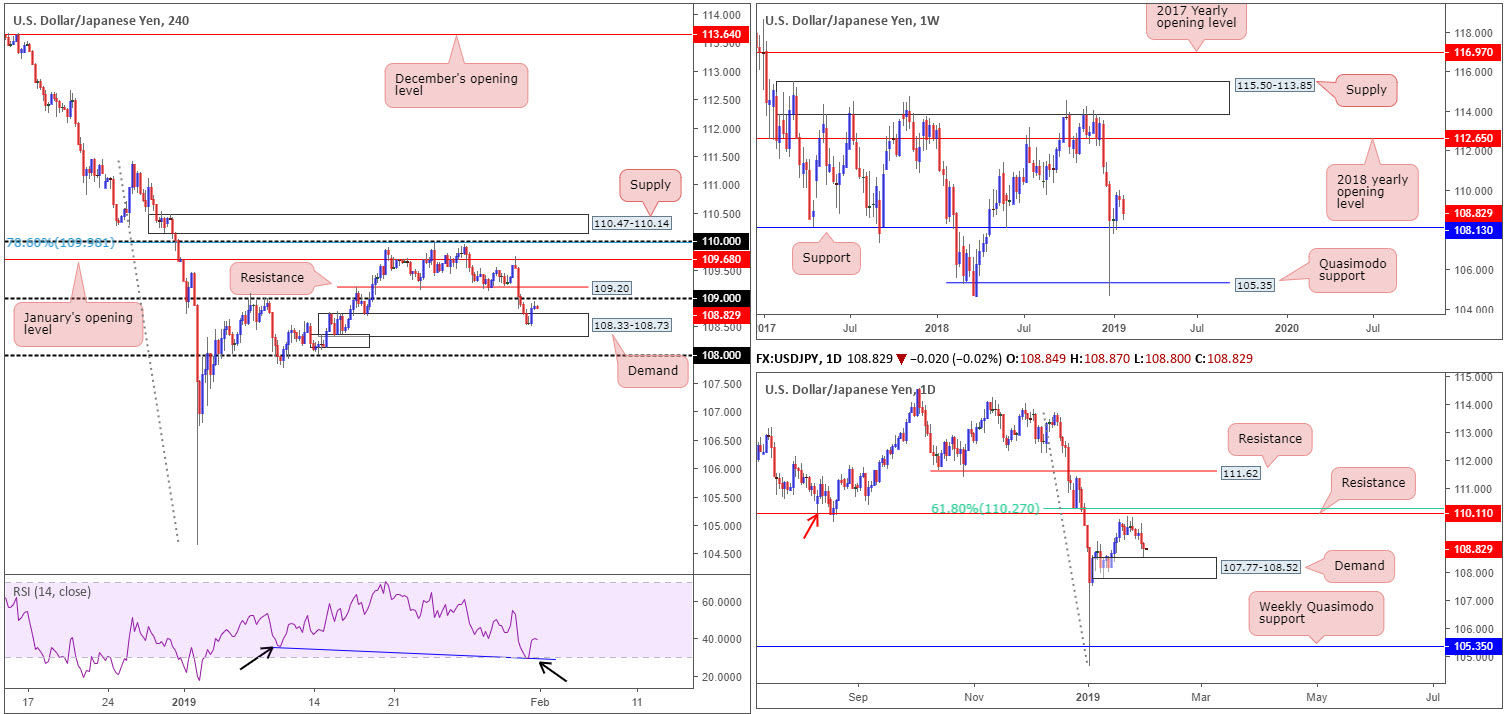
Rebounding from H4 demand at 108.33-108.73 Thursday (area forms part of a stacked demand configuration), the H4 candles clocked highs at 108.94: a couple of pips south of the 109 handle. The H4 RSI indicator printing a strong divergence reading off the top of its oversold value may have helped entice buying yesterday, too. What’s also interesting is daily demand at 107.77-108.52 entered the mix yesterday.
At this stage, a double whammy of demand from the H4 and daily timeframes is visible, and could bring about further upside today. The next resistance objective on the daily timeframe can be seen around resistance pencilled in at 110.11, followed closely by a 61.8% Fibonacci resistance value at 110.27.
Another point worthy of breath is weekly support at 108.13 resides within the current daily demand zone, though is located a few pips beneath the current H4 demand area.
Areas of consideration:
Entering long in this market at current price may be tempting on the basis of H4 and daily demand, though it is worth noting active sellers likely occupy the nearby round number 109, tailed closely by another layer of resistance at 109.20.
On account of this, to become buyers in this market the research team notes two possible scenarios:
- Wait and see if the H4 candles close above 109.20. This likely frees the path north towards at least January’s opening level at 109.68, followed by the 110 handle. Conservative traders might opt to wait and see if the unit retests 109.20 as support before pulling the trigger.
- Should price trade lower and engulf the current H4 demand, the unit has 108 to target, which, in view of its connection with weekly support at 108.13, may produce a hefty bounce. As round numbers are prone to fakeouts, waiting for additional bullish candlestick confirmation to form is an option. That way, not only do we have buyer intent, we also have structure offering entry and stop levels to work with according to the candle pattern’s rules of engagement.
Today’s data points: US Average Hourly Earnings m/m; US Non-Farm Employment Change; US Unemployment Rate; US ISM Manufacturing PMI; US Revised UoM Consumer Sentiment.
USD/CAD:
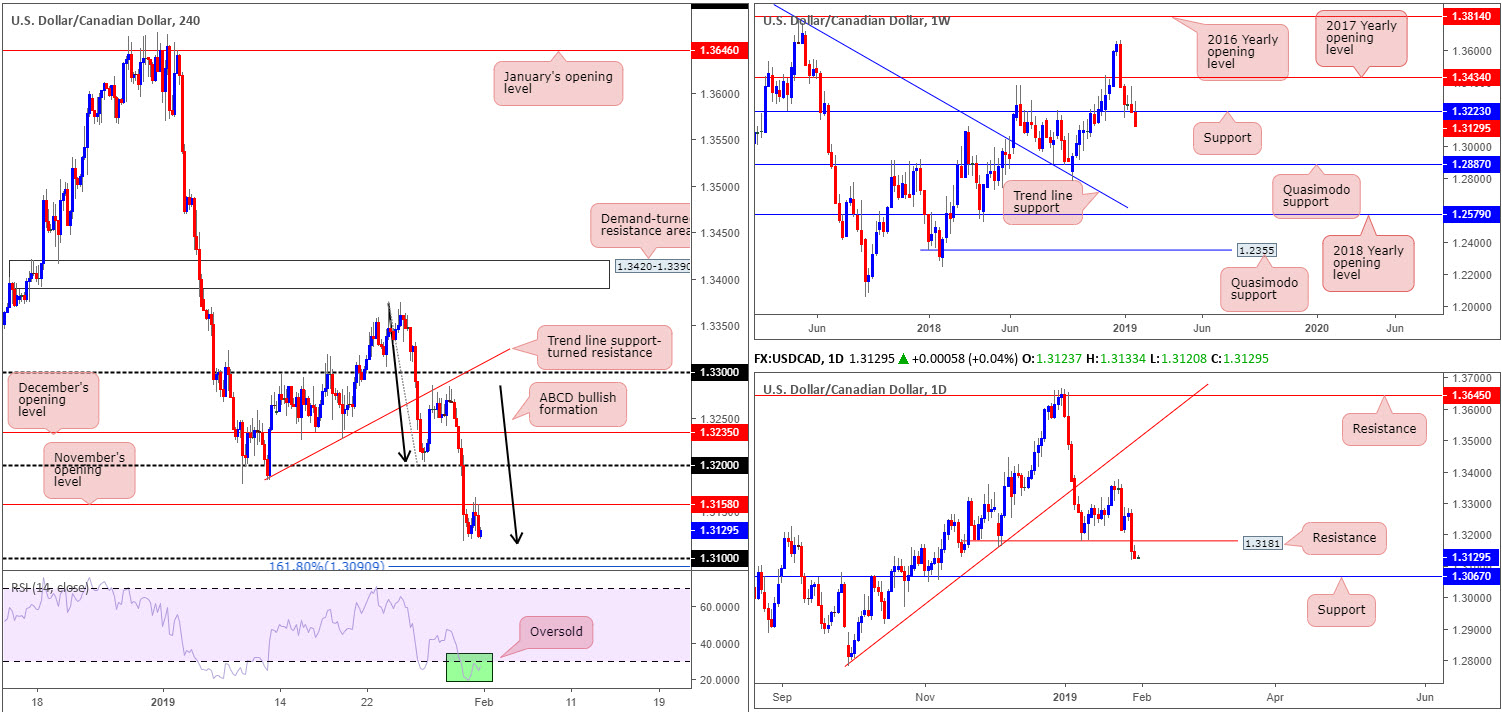
Despite soft Canadian data in the form of November GDP and December PPI, the USD/CAD pair failed to conquer November’s opening level at 1.3158 as H4 resistance Thursday. This places a question mark on the ABCD (black arrows) bullish pattern as a viable support, seen north of 1.31. According to the research team, it’s possible the H4 candles may continue to press for lower ground to bring in buyers from 1.31, given the 161.8% Fibonacci ext. point is seen ten pips south of this level at 1.3090 (in connection with the current ABCD formation). Lastly, it might also be worth taking into account the RSI indicator is trading within oversold territory.
From a technical standpoint on the higher timeframes, recent selling dragged weekly price beyond its support level at 1.3223, opening up downside to additional selling as far south as Quasimodo support at 1.2887. Daily price also recently cleared orders from Quasimodo support at 1.3181 (now acting resistance) and is now eyeing notable support priced in at 1.3067.
Areas of consideration:
Outlook remains unchanged due to lacklustre movement.
On account of the above, both higher-timeframe charts portend further downside towards at least daily support at 1.3067. The flip side to this is H4 structure shows reasonably strong support off 1.31 (see above in bold), which is likely to produce at least a bounce back up to November’s opening level at 1.3158. As round numbers are prone to whipsaws (or stop runs), waiting for a H4 bullish candlestick configuration to form is recommended before pressing the buy button. As long as entry and stop levels based off the candlestick structure offers more than a 1:1 ratio in terms of risk/reward to 1.3158, a bounce remains high probability.
Today’s data points: US Average Hourly Earnings m/m; US Non-Farm Employment Change; US Unemployment Rate; US ISM Manufacturing PMI; US Revised UoM Consumer Sentiment.
USD/CHF:
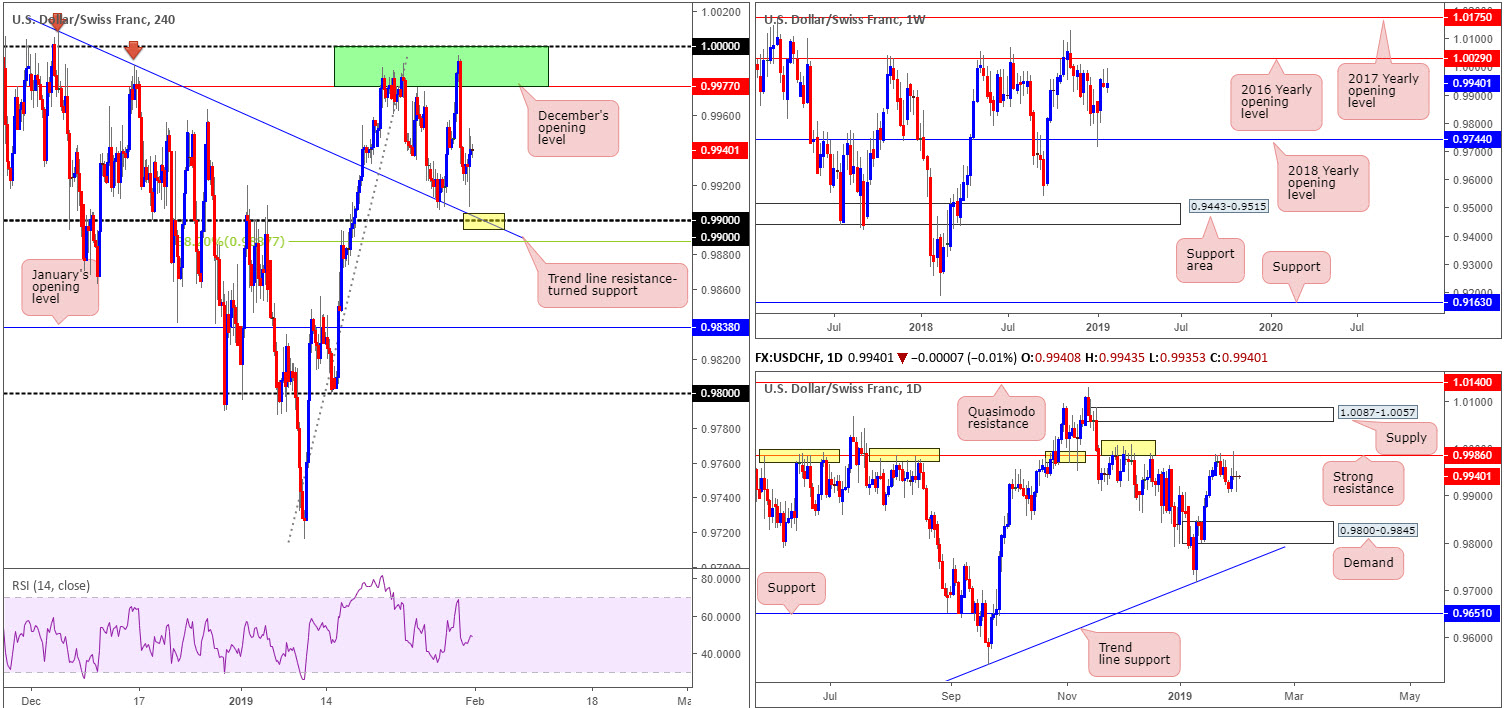
Following a crisp daily bearish pin-bar formation off daily resistance at 0.9986 Wednesday, Thursday’s movement responded printing a bullish pin-bar pattern. The bullish formation is unlikely to carry much weight due to weekly price seen in the process of constructing its second consecutive bearish pin-bar pattern, positioned south of the 2016 yearly opening level at 1.0029.
As is evident from the weekly and daily timeframes, downside is reasonably free of support until reaching daily demand propped up at 0.9800-0.9845.
The green area marked on the H4 timeframe between 1.0000 (parity) and December’s opening level at 0.9977, remains on the radar. The research team likes this area due to its relationship with daily structure: the daily resistance level at 0.9986 is seen housed within its limits. The next downside target on the H4 scale is the 0.99 handle, which happens to merge nicely with H4 trend line resistance-turned support (extended from the high 1.0008).
Areas of consideration:
Outlook remains unchanged due to lacklustre movement.
The point at which the 0.99 handle fuses with the H4 trend line resistance-turned support mentioned above (yellow) has ‘bounce’ written all over it. We also like the nearby 38.2% Fibonacci support value at 0.9887 hovering nearby the level, as this could be used to determine stop-loss placement for longs off 0.99.
For conservative traders concerned regarding the market’s position on the higher timeframes, waiting for additional confirmation to form off 0.99 may be an idea. However, it must be stressed a bounce is all we feel will take shape from 0.99, therefore drilling down to the lower timeframes and searching for confirming action there might be the best path to take in order to keep risk/reward parameters healthy.
Once, or indeed if, we print a decisive close beyond 0.99 today, downside shows scope towards January’s opening level at 0.9838, which essentially represents the top edge of daily demand mentioned above at 0.9800-0.9845. As such, a H4 close below 0.99 that’s followed up with a strong retest as resistance would, according to the surrounding picture on the higher timeframes, be good for shorts (stop-loss orders best placed beyond the rejecting candle’s wick).
Today’s data points: US Average Hourly Earnings m/m; US Non-Farm Employment Change; US Unemployment Rate; US ISM Manufacturing PMI; US Revised UoM Consumer Sentiment.
Dow Jones Industrial Average:
In recent sessions, US equities advanced marginally higher amid optimistic vibes surrounding US/China trade talks. Commentary from US President Trump stated the US has not extended the 1 March deadline for China talks, though says he thinks everything will be agreed to when he meets China President Xi.
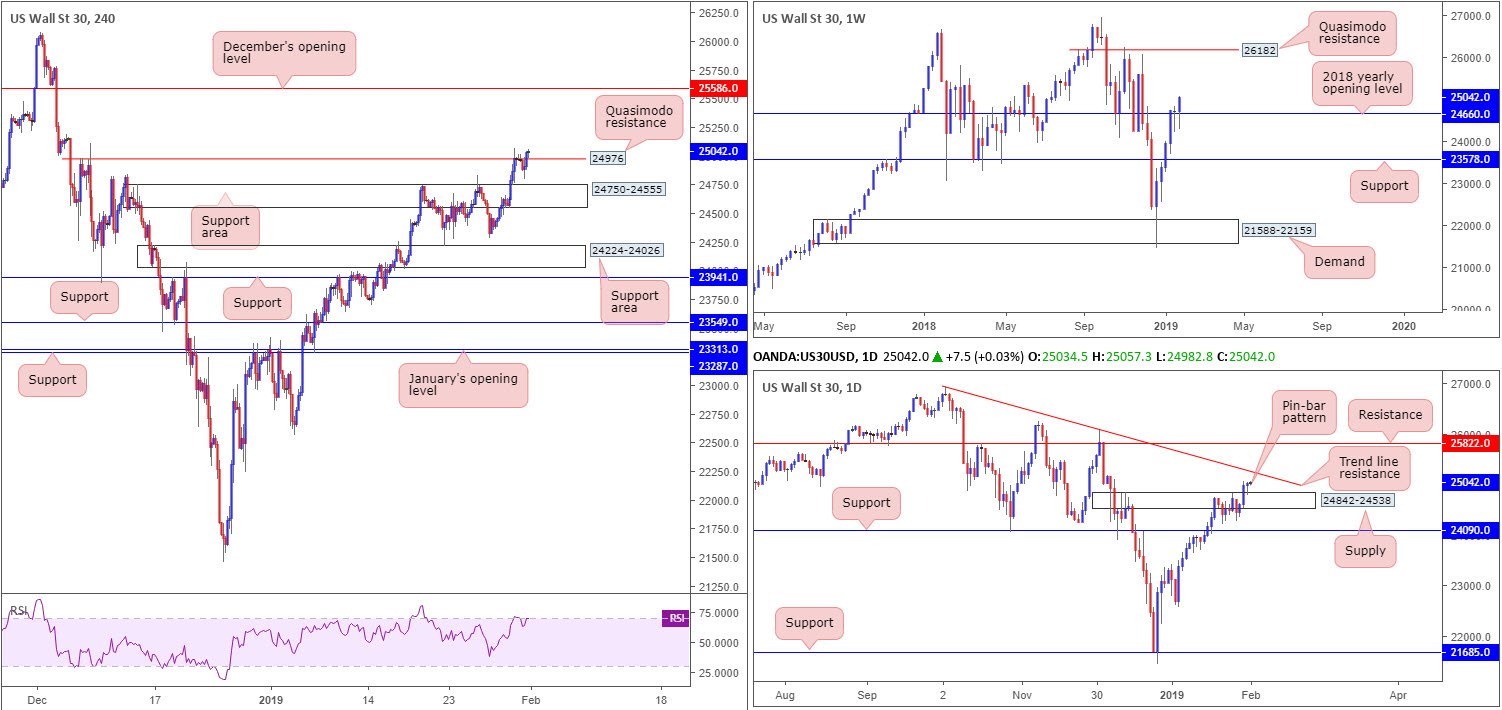
Technically speaking, sellers lost their flavour reasonably quickly around the H4 Quasimodo resistance level at 24976, with Thursday’s action concluding a few points above the level. Key resistance on the H4 scale now rests at December’s opening level drawn from 25586.
While H4 action appears poised to continue gravitating north, higher-timeframe structure highlights nearby resistance in the shape of a daily trend line barrier (taken from the high 26939). Beyond here, though, resistance at 25822 is in sight. Weekly flow, on the other hand, is establishing a floor on top of its 2018 yearly opening level at 24660, with eyes on Quasimodo resistance at 26182 as the next upside objective.
Areas of consideration:
The H4 close above H4 Quasimodo resistance at 24976, alongside daily price forming a bullish pin-bar pattern upon retesting the top edge of supply at 24842-24538 (now acting support area) and weekly price signaling further buying, a long in this market at current price (with stops plotted beneath the daily bullish pin-bar tail at 24795)is certainly an option today. Reducing risk to breakeven upon testing the aforementioned daily trend line resistance is worthy of consideration as strong sellers may reside here. A break above this angle will draw December’s opening level mentioned above on the H4 timeframe at 25586 firmly into the spotlight as a viable target.
Today’s data points: US Average Hourly Earnings m/m; US Non-Farm Employment Change; US Unemployment Rate; US ISM Manufacturing PMI; US Revised UoM Consumer Sentiment.
XAU/USD (GOLD):
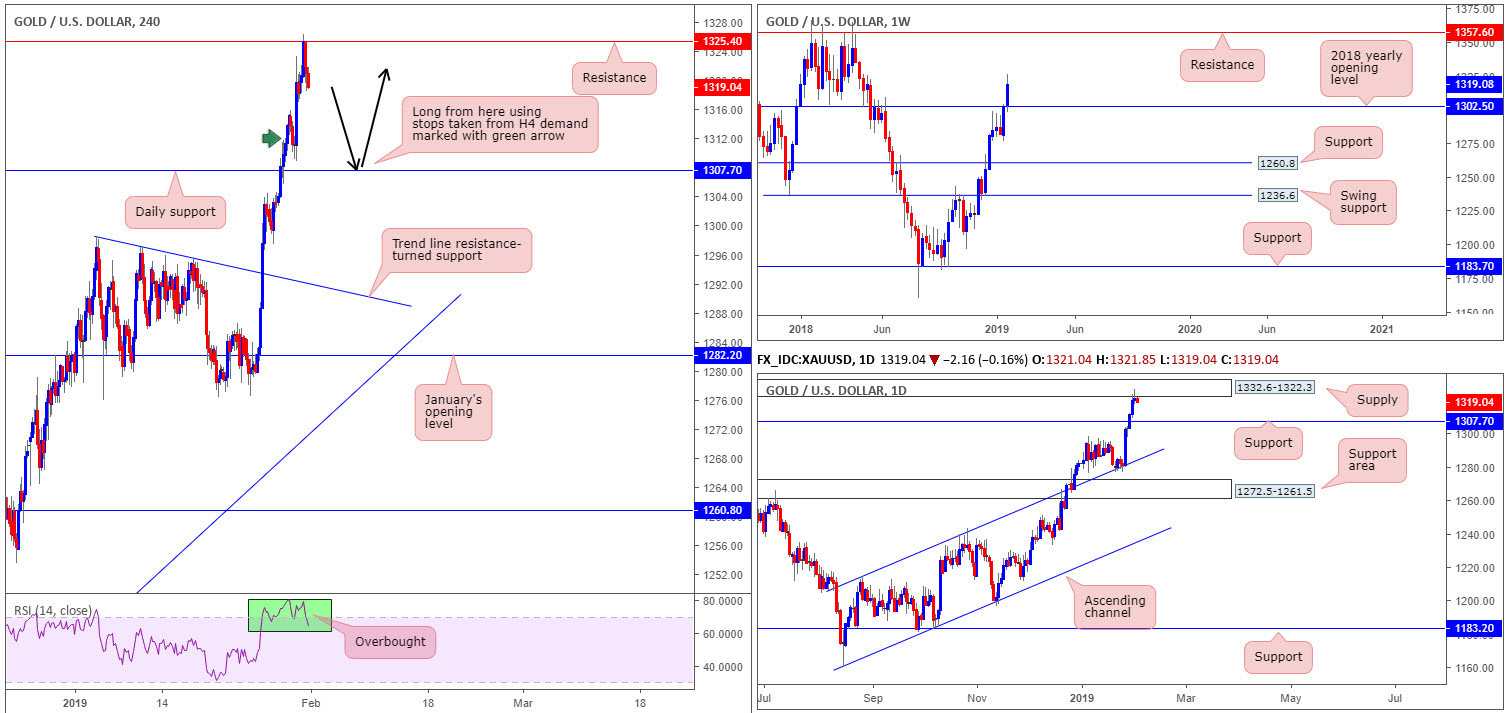
For traders who read Thursday’s briefing you may recall the piece highlighted a potential pullback from the H4 resistance level at 1325.4, as it’s housed within the walls of a daily supply zone plotted at 1332.6-1322.3. In addition to this, it was also noted the H4 RSI indicator was (still is) trading within overbought terrain.
Well done to any of our readers who managed to jump aboard this move. The next downside target falls in around daily support at 1307.7. As you can probably see, though, there is a H4 demand sited a few pips north of this level around the 1312.8 neighbourhood which could bounce price. Trade this demand area with caution, as a stop run beneath the zone will likely take shape in order to accumulate liquidity (sell orders) to enter long.
Ultimately, we do not expect the yellow metal to extend much past the aforementioned daily support, owing to the weekly picture’s structure. The candles on this timeframe recently conquered its 2018 yearly opening level at 1302.5, possibly freeing the runway north towards resistance marked at 1357.6.
Areas of consideration:
In the event our analysis proves to be correct, the market will eventually cross swords with daily support highlighted above at 1307.0. This level – coupled with weekly price eyeing levels in the 1350s region and a firm bullish candlestick signal (entry/stop parameters can be taken from this structure) out of the H4 timeframe – is enough evidence to consider a long, targeting the noted daily supply zone as the initial port of call.
The use of the site is agreement that the site is for informational and educational purposes only and does not constitute advice in any form in the furtherance of any trade or trading decisions.
The accuracy, completeness and timeliness of the information contained on this site cannot be guaranteed. IC Markets does not warranty, guarantee or make any representations, or assume any liability with regard to financial results based on the use of the information in the site.
News, views, opinions, recommendations and other information obtained from sources outside of www.icmarkets.com.au, used in this site are believed to be reliable, but we cannot guarantee their accuracy or completeness. All such information is subject to change at any time without notice. IC Markets assumes no responsibility for the content of any linked site. The fact that such links may exist does not indicate approval or endorsement of any material contained on any linked site.
IC Markets is not liable for any harm caused by the transmission, through accessing the services or information on this site, of a computer virus, or other computer code or programming device that might be used to access, delete, damage, disable, disrupt or otherwise impede in any manner, the operation of the site or of any user’s software, hardware, data or property.


