
DXY:
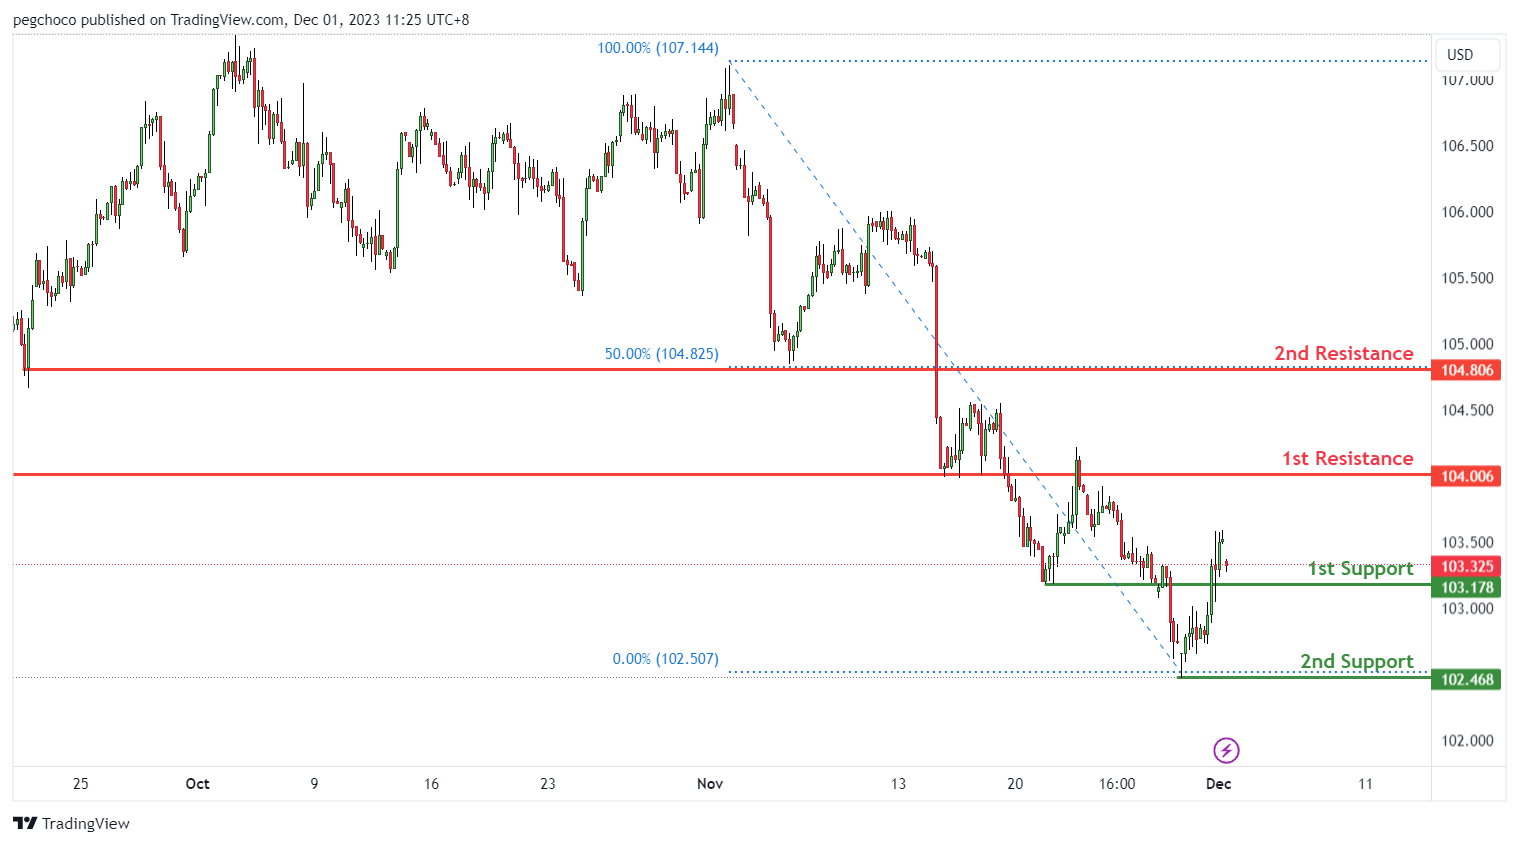
The chart for DXY (US Dollar Index) displays a bullish overall momentum. Potential price action suggests a bullish bounce off the 1st support.
The 1st support at 103.17 is identified as a pullback support. It’s a significant level where buying interest may emerge, potentially propelling the DXY towards further gains.
The 2nd support at 102.46 is another support level, characterized as a swing low support, reinforcing its importance as a potential area of buying interest.
On the resistance side, the 1st resistance at 104.00 is categorized as a pullback resistance, serving as a significant barrier where selling interest could intensify, potentially slowing the DXY’s upward movement.
The 2nd resistance at 104.80 is noted as another pullback resistance, further reinforcing potential resistance factors for the currency index.
EUR/USD:
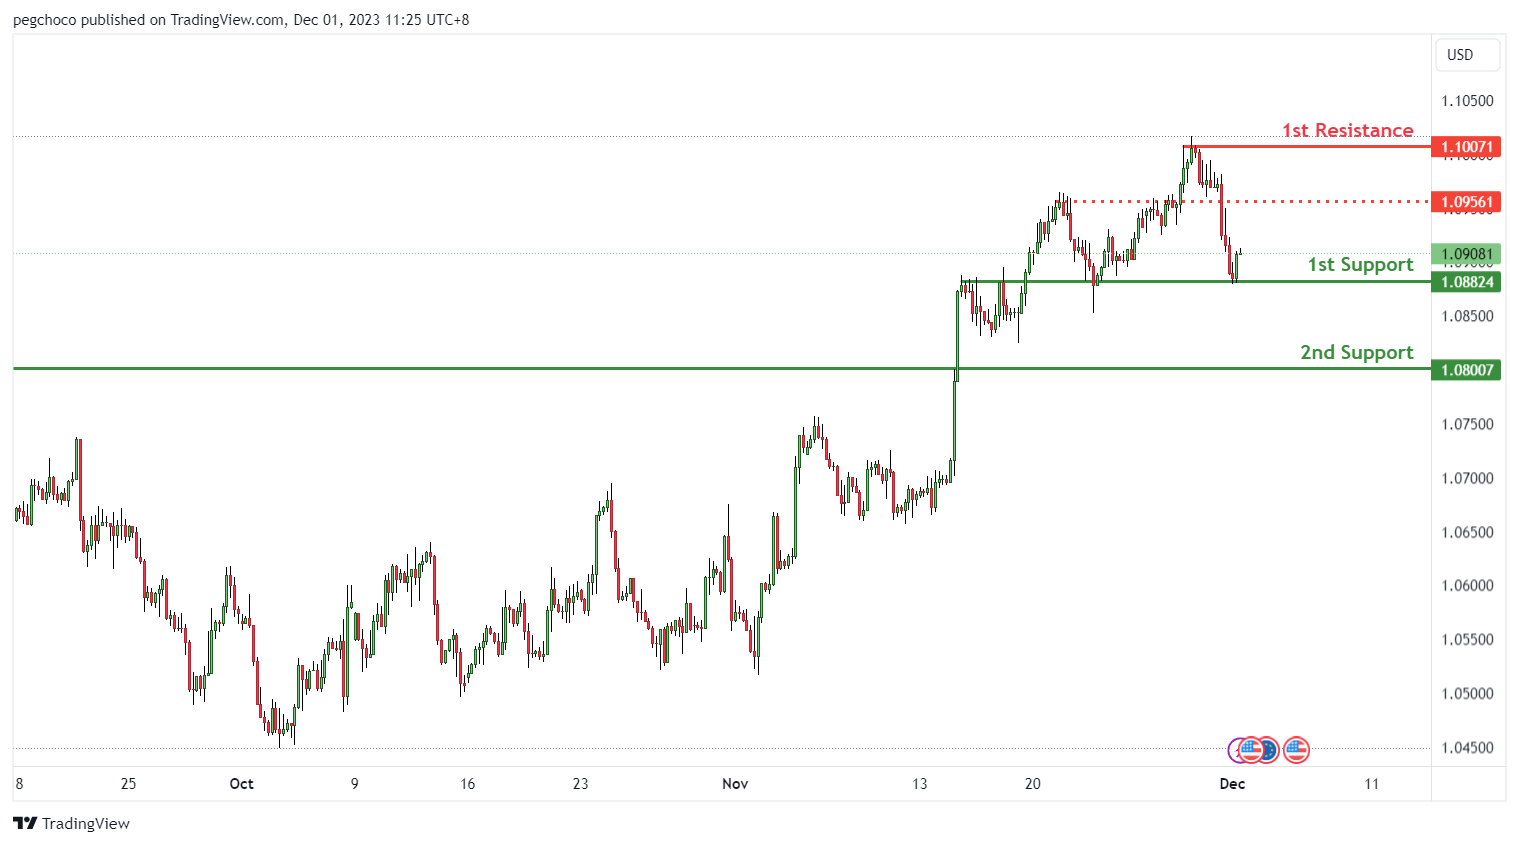
The EUR/USD chart exhibits a bullish overall momentum, indicating potential for a bullish continuation towards the 1st resistance.
The 1st support at 1.0882 is identified as an overlap support, a significant level where buying interest may emerge, providing essential backing for the currency pair.
The 2nd support at 1.08 is categorized as pullback support, reinforcing its importance as a potential area of buying interest.
On the resistance side, the 1st resistance at 1.1007 is a swing high resistance, serving as a substantial barrier where selling interest could intensify, potentially slowing EUR/USD’s upward movement.
Additionally, there is an intermediate resistance at 1.0956, characterized as pullback resistance, further reinforcing potential resistance factors for the currency pair.
EUR/JPY:
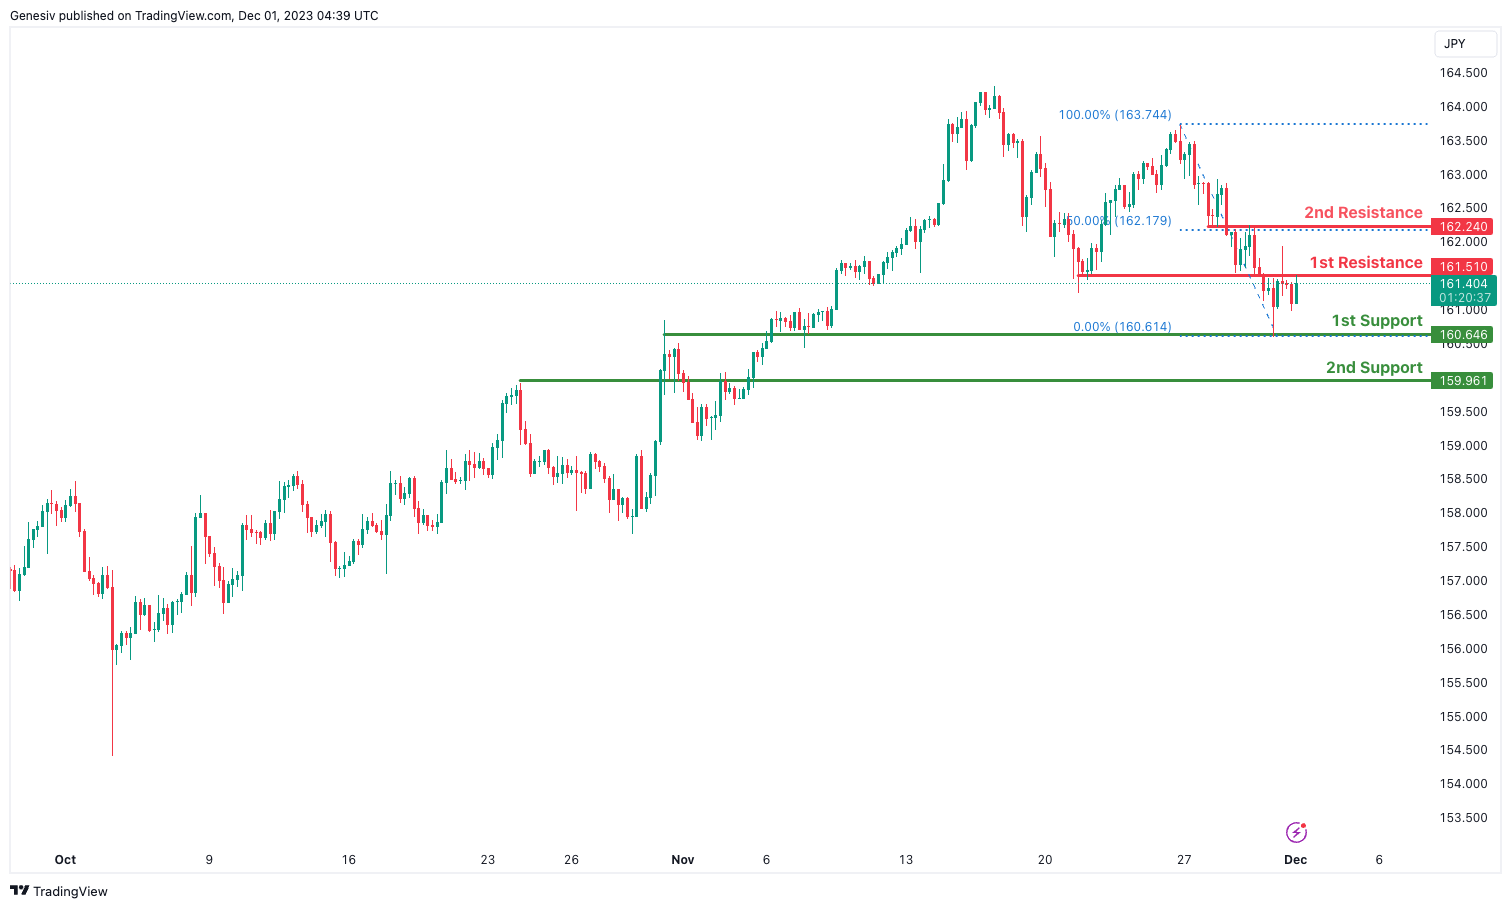
The analyzed instrument is EUR/JPY, and the overall momentum of the chart is currently bearish.
There is a potential for the price to make a bearish reaction off the 1st resistance and drop to the 1st support.
The 1st support level is identified at 160.64, and its favorable characteristic is attributed to being an overlap support.
The 2nd support level is situated at 159.96, and its favorable aspect is derived from being a pullback support.
On the resistance side, the 1st resistance is positioned at 161.51, and it is considered significant due to being an overlap resistance.
The 2nd resistance is located at 162.24, and its significance is derived from being an overlap resistance and aligning with the 50% Fibonacci Retracement.
.
EUR/GBP:
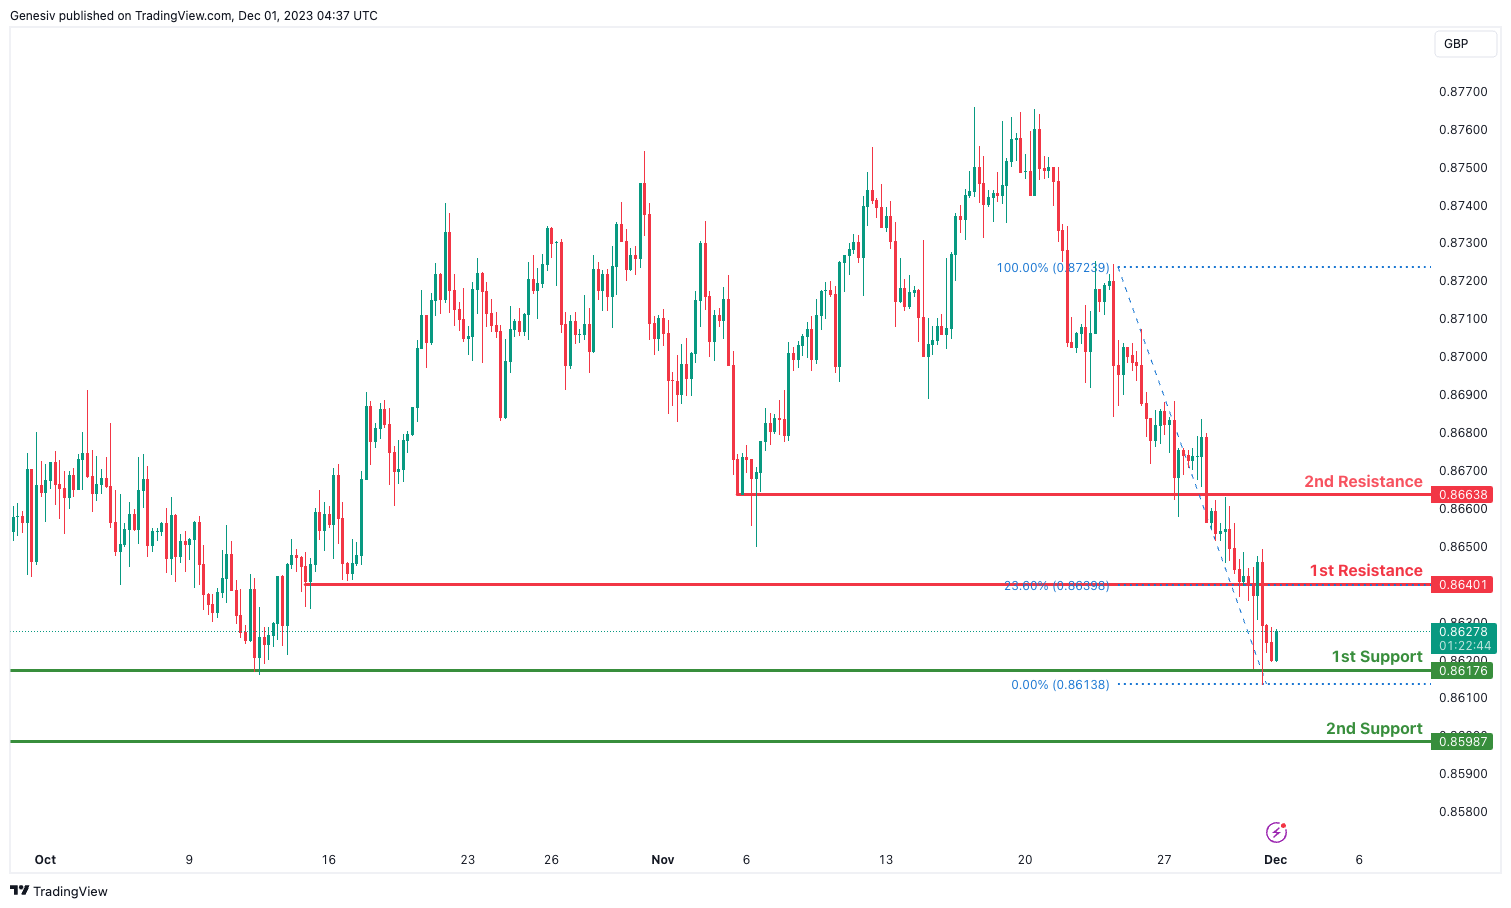
The analyzed instrument is EUR/GBP, and the overall momentum of the chart is currently bullish.
There is a potential for the price to make a bullish continuation towards the 1st resistance.
The 1st support level is identified at 0.8617, and its favorable characteristics include being a multi-swing low support.
The 2nd support level is situated at 0.8598, and its favorable aspect is derived from being a swing low support.
On the resistance side, the 1st resistance is positioned at 0.8640, and it is considered significant due to being a pullback resistance and coinciding with the 23.60% Fibonacci Retracement.
The 2nd resistance is located at 0.8663, and its significance is derived from being an overlap resistance.
GBP/USD:
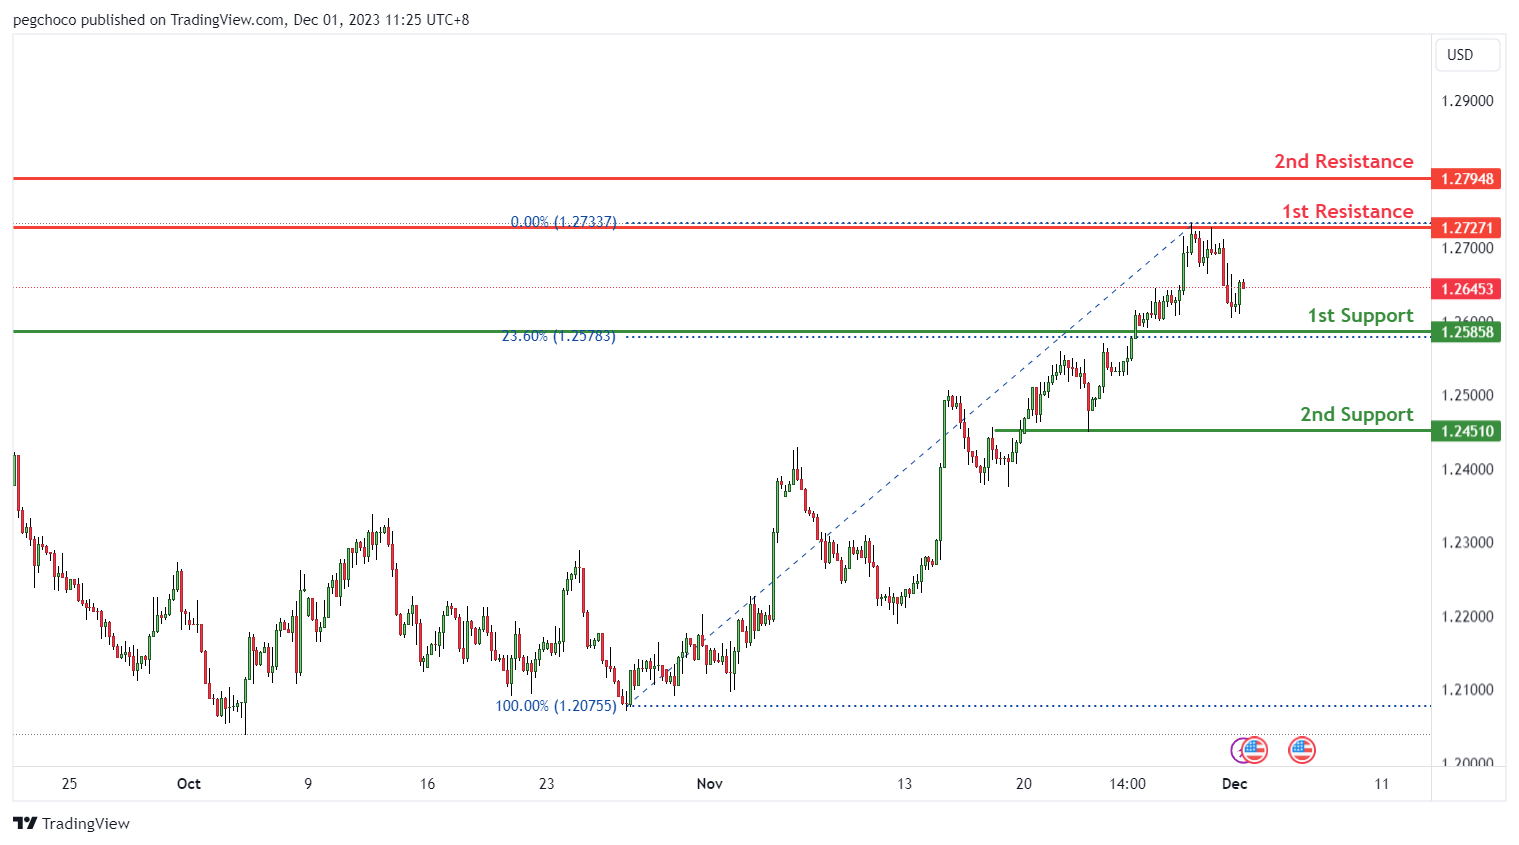
The GBP/USD chart maintains a bullish overall momentum, suggesting potential for a bullish continuation towards the 1st resistance.
The 1st support at 1.2585 is identified as an overlap support, featuring a 23.60% Fibonacci retracement, signifying its significance as a level where buying interest may emerge and reinforce GBP/USD’s upward movement.
The 2nd support at 1.2451 is another overlap support level, adding to its importance as a potential area for buyer activity.
On the resistance side, the 1st resistance at 1.2727 is characterized as an overlap resistance, representing a notable barrier where selling interest could intensify, potentially limiting the currency pair’s upward ascent.
The 2nd resistance at 1.2794 is also noted as an overlap resistance, further strengthening the potential resistance factors for GBP/USD.
GBP/JPY:
The overall momentum of GBP/JPY is bullish, suggesting a potential continuation of the upward movement in price. There is a possibility that the price could make a bullish bounce off the 1st support and head towards the 1st resistance.
1st support at 186.72: This level is identified as a pullback support, suggesting that it has previously acted as a significant price level where buyers have shown interest. It’s a level to watch for potential bullish reactions or a temporary halt in the bearish momentum.
2nd support at 185.99: The 2nd support level is marked as multi-swing low support, indicating its importance as a potential area of buying interest. Additionally, this level aligns with the 61.8% Fibonacci Retracement, adding strength to the support level. Traders may anticipate potential support around this level.
1st resistance at 188.18: This level is characterised as pullback resistance, as it could indicate a potential pause or correction in the bullish trend.

USD/CHF:
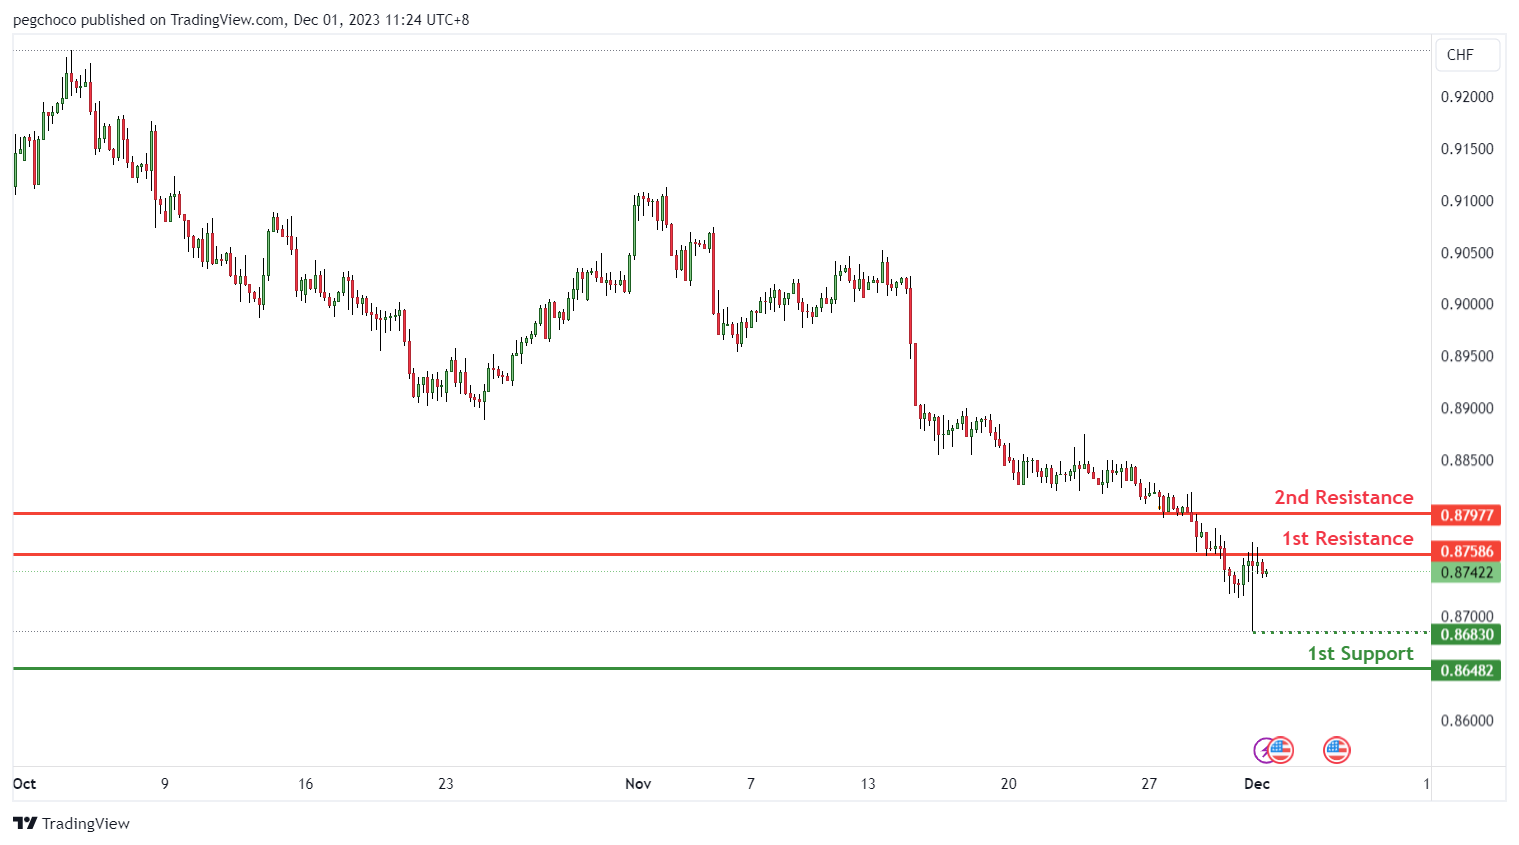
The USD/CHF chart exhibits a bearish overall momentum, indicating potential price action where it may initially rise towards the 1st resistance in the short term before reversing off it and moving downward towards the 1st support.
The 1st support at 0.8648 is identified as a pullback support, signifying its importance as a significant level where buying interest may emerge, potentially providing support for USD/CHF.
An intermediate support level at 0.8683, characterized as a swing low support, adds further significance, potentially reinforcing the support for the currency pair.
On the resistance side, the 1st resistance at 0.8758 is categorized as an overlap resistance, serving as a significant barrier where selling interest could intensify, potentially leading to a reversal in the USD/CHF movement.
Additionally, there is a 2nd resistance at 0.8797, noted as a pullback resistance, further strengthening potential resistance factors for the currency pair.
USD/JPY:
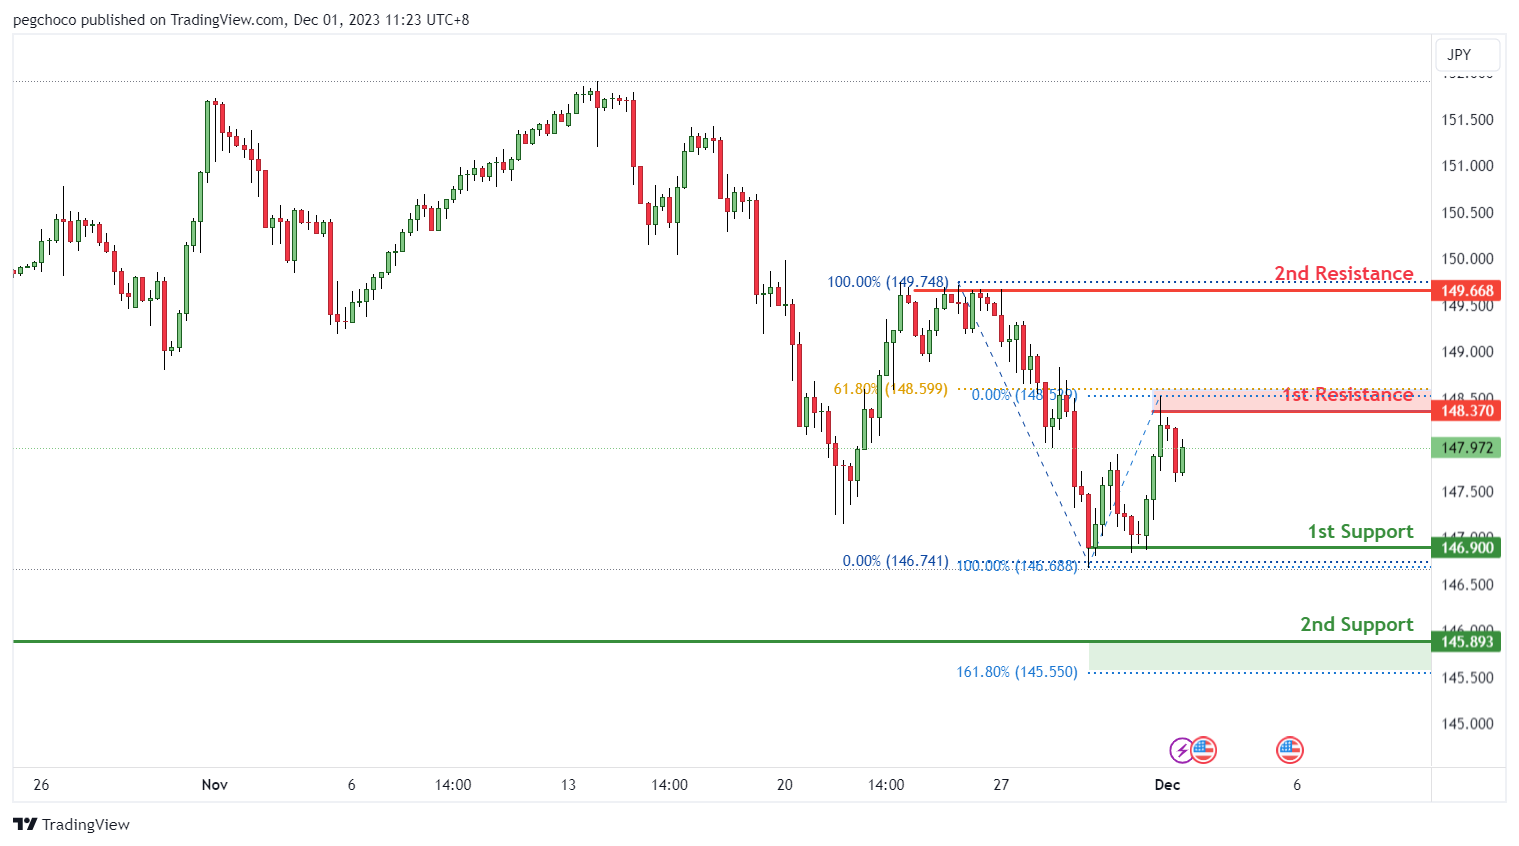
The USD/JPY chart maintains a bearish overall momentum, suggesting potential for a bearish continuation towards the 1st support.
The 1st support at 146.90 is identified as a multi-swing low support, signifying its significance as a level where buying interest may emerge, potentially providing essential support for USD/JPY.
The 2nd support at 145.89 is characterized as a swing low support, adding to its importance as a potential area for buyer activity.
On the resistance side, the 1st resistance at 148.37 is categorized as a swing high resistance, featuring a 61.80% Fibonacci retracement, representing a notable barrier where selling interest could intensify, potentially limiting the currency pair’s upward movement.
The 2nd resistance at 149.66 is also noted as a multi-swing high resistance, further strengthening potential resistance factors for USD/JPY
.
USD/CAD:
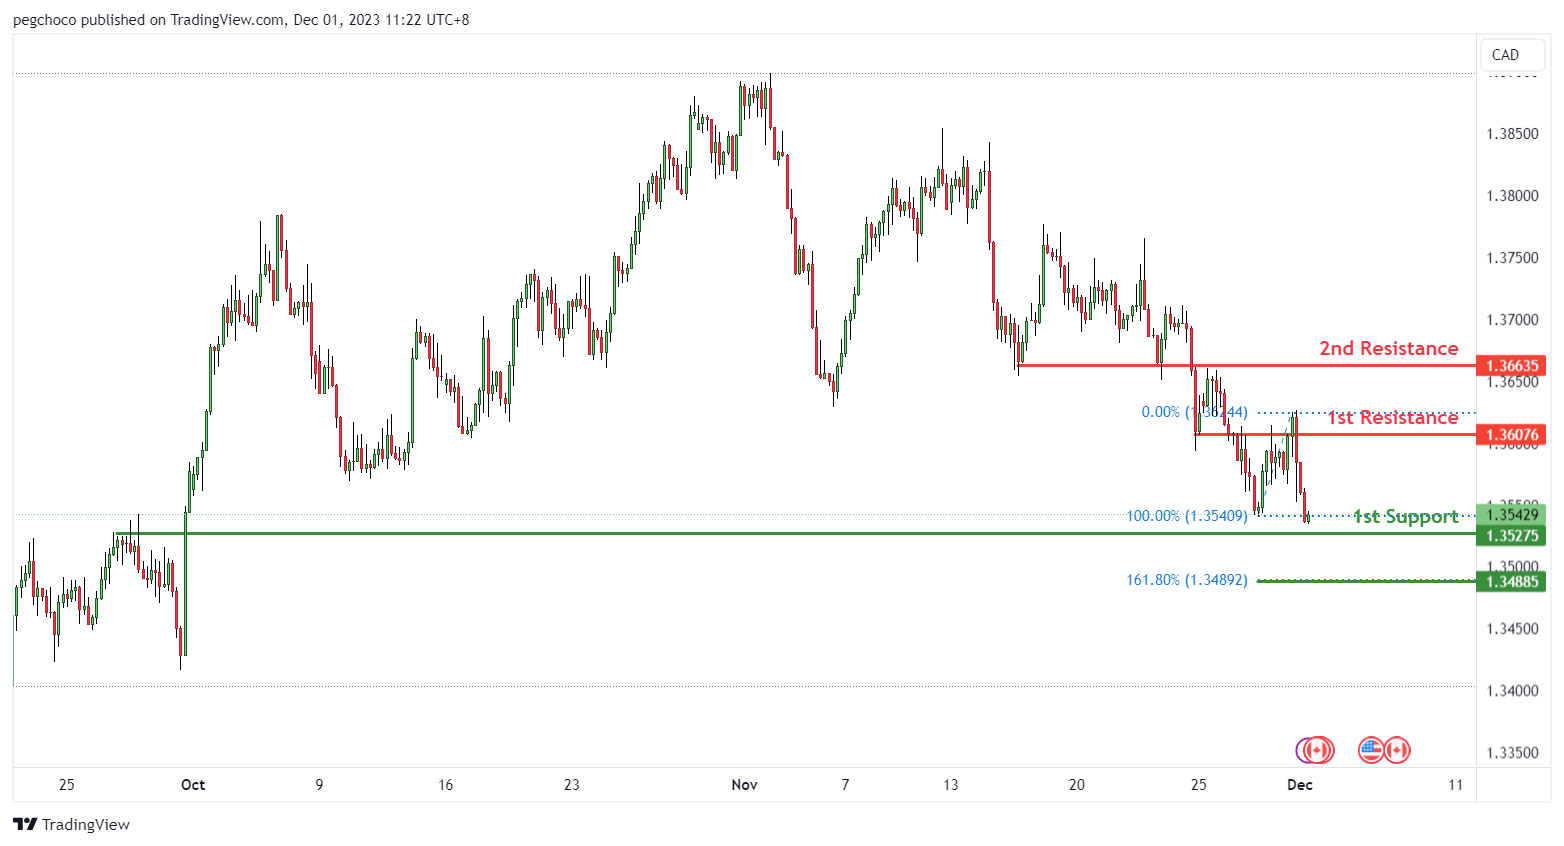
The USD/CAD chart currently displays a bullish overall momentum, indicating potential price action where it may experience a bullish bounce off the 1st support and move towards the 1st resistance.
The 1st support at 1.3527 is identified as a pullback support, signifying its importance as a significant level where buying interest may emerge, potentially providing essential support for USD/CAD.
The 2nd support at 1.3488 features a 161.80% Fibonacci extension, adding to its significance as a potential area for buyer activity, strengthening the support.
On the resistance side, the 1st resistance at 1.3607 is categorized as an overlap resistance, representing a notable barrier where selling interest could intensify, potentially hindering USD/CAD’s upward movement.
Additionally, there is a 2nd resistance at 1.3663, noted as an overlap resistance, further reinforcing potential resistance factors for the currency pair.
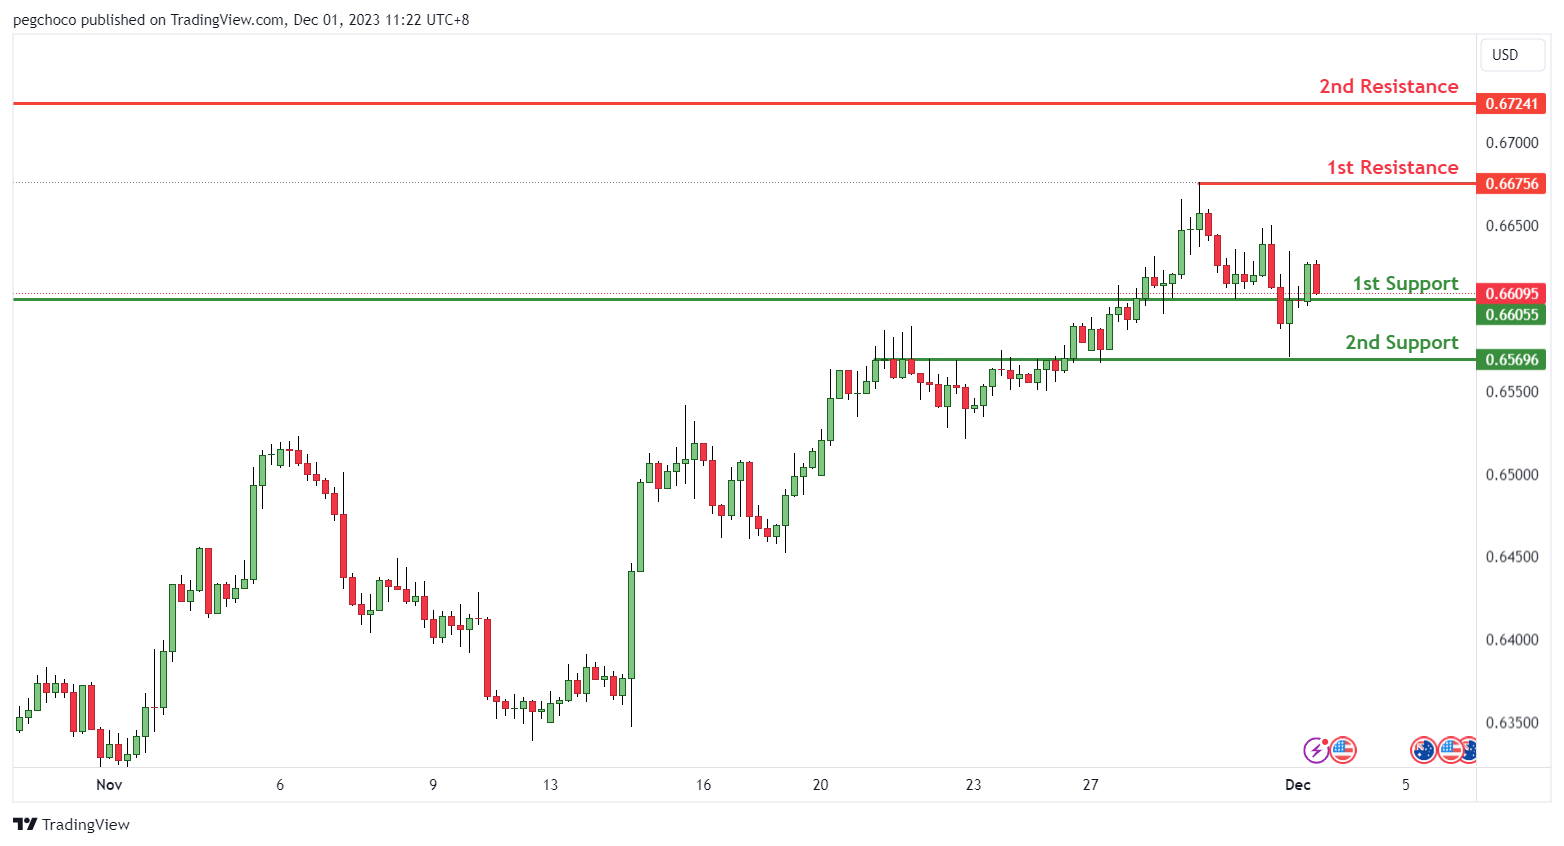
AUD/USD:
The AUD/USD chart currently presents a bearish overall momentum, suggesting potential price action where it may undergo a bearish break off the 1st support and move downward towards the 2nd support.
The 1st support at 0.6605 is identified as an overlap support, signifying its importance as a significant level where buying interest may emerge. However, the bearish momentum could potentially overpower this level.
The 2nd support at 0.6569 is characterized as an overlap support, reinforcing its significance as another potential area for buyer activity.
On the resistance side, the 1st resistance at 0.6675 is categorized as a swing high resistance, representing a notable barrier where selling interest could intensify, potentially preventing AUD/USD from making significant upward progress.
Additionally, there is a 2nd resistance at 0.6724, noted as an overlap resistance, further reinforcing potential resistance factors for the currency pair.
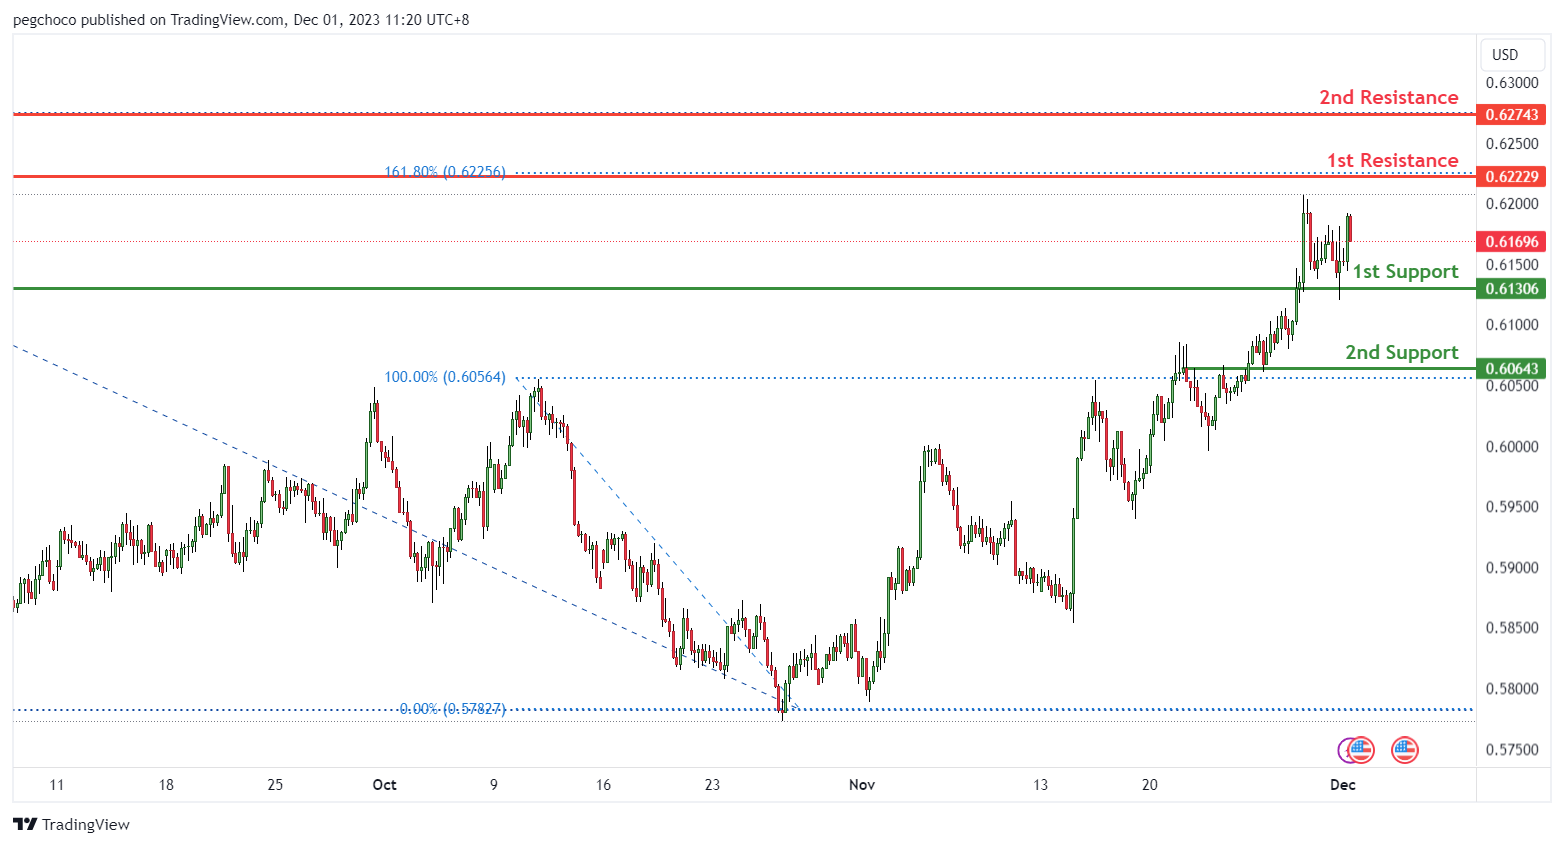
NZD/USD
The NZD/USD chart currently exhibits a neutral overall momentum, suggesting potential price action where it may fluctuate between the 1st resistance and the 1st support level.
The 1st support at 0.6130 is identified as an overlap support, signifying its importance as a significant level where buying interest may emerge, potentially providing essential backing for NZD/USD.
The 2nd support at 0.6064 is characterized as an overlap support, adding to its significance as a potential area for buyer activity.
On the resistance side, the 1st resistance at 0.6222 is categorized as a swing high resistance, featuring a 161.80% Fibonacci extension, representing a notable barrier where selling interest could intensify, potentially limiting the currency pair’s upward movement.
Additionally, there is a 2nd resistance at 0.6274, noted as an overlap resistance, further reinforcing potential resistance factors for NZD/USD.
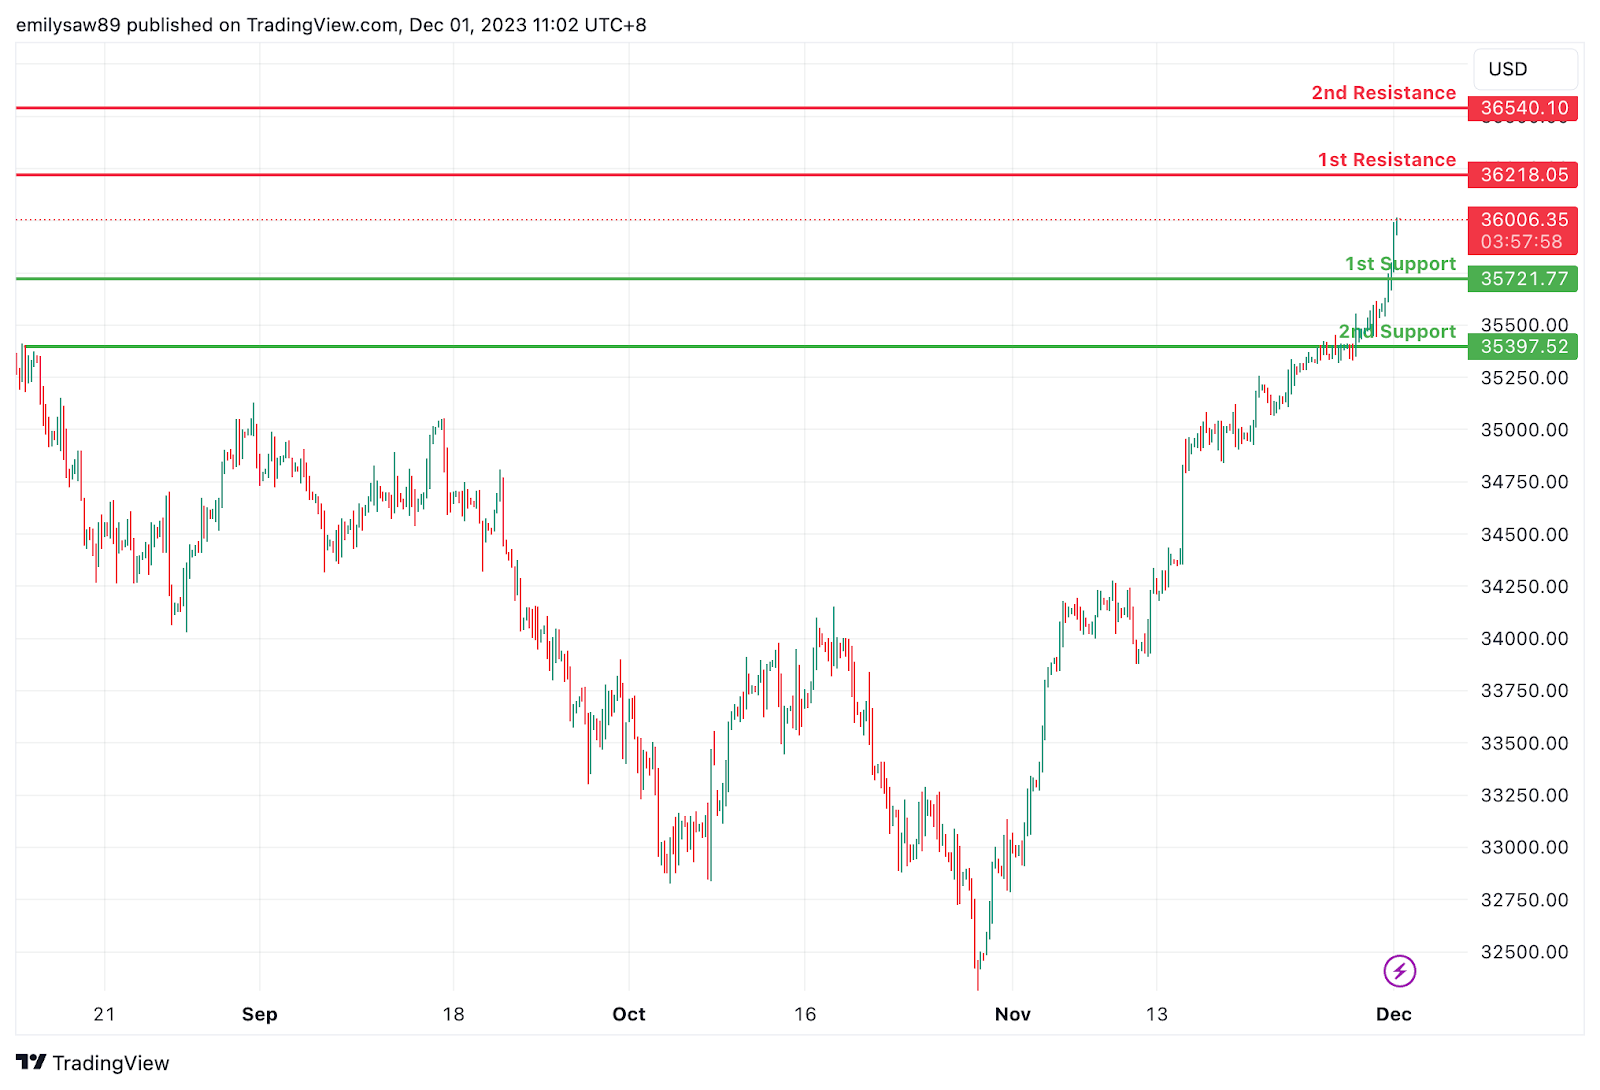
DJ30:
The DJ30,the momentum of the chart is bullish, suggesting a potential continuation of the upward movement in price. There is a possibility that the price could experience a bullish bounce off the 1st support level and head towards the 1st resistance.
1st support at 35721.77: This level is identified as a multi-swing low support, indicating that it has previously acted as a significant price level where buyers have stepped in. It is a level to watch for potential bullish reactions or a temporary pause in the upward momentum.
2nd support at 35721.77: The 2nd support level is marked as a pullback support, suggesting that if the price experiences a pullback, it may find support at this level. Pullback supports are significant in maintaining the overall upward momentum.
1st resistance at 36218.05: This level is considered a pullback resistance, this level may pose a temporary challenge for the price movement. Traders should monitor how the price reacts around this level, as it could indicate a potential pause or correction in the bullish trend.
2nd resistance at 36540.10: This level is considered as swing high resistance, representing a historical point where the market previously faced selling pressure. Breaking through this resistance could signify a strong bullish move.
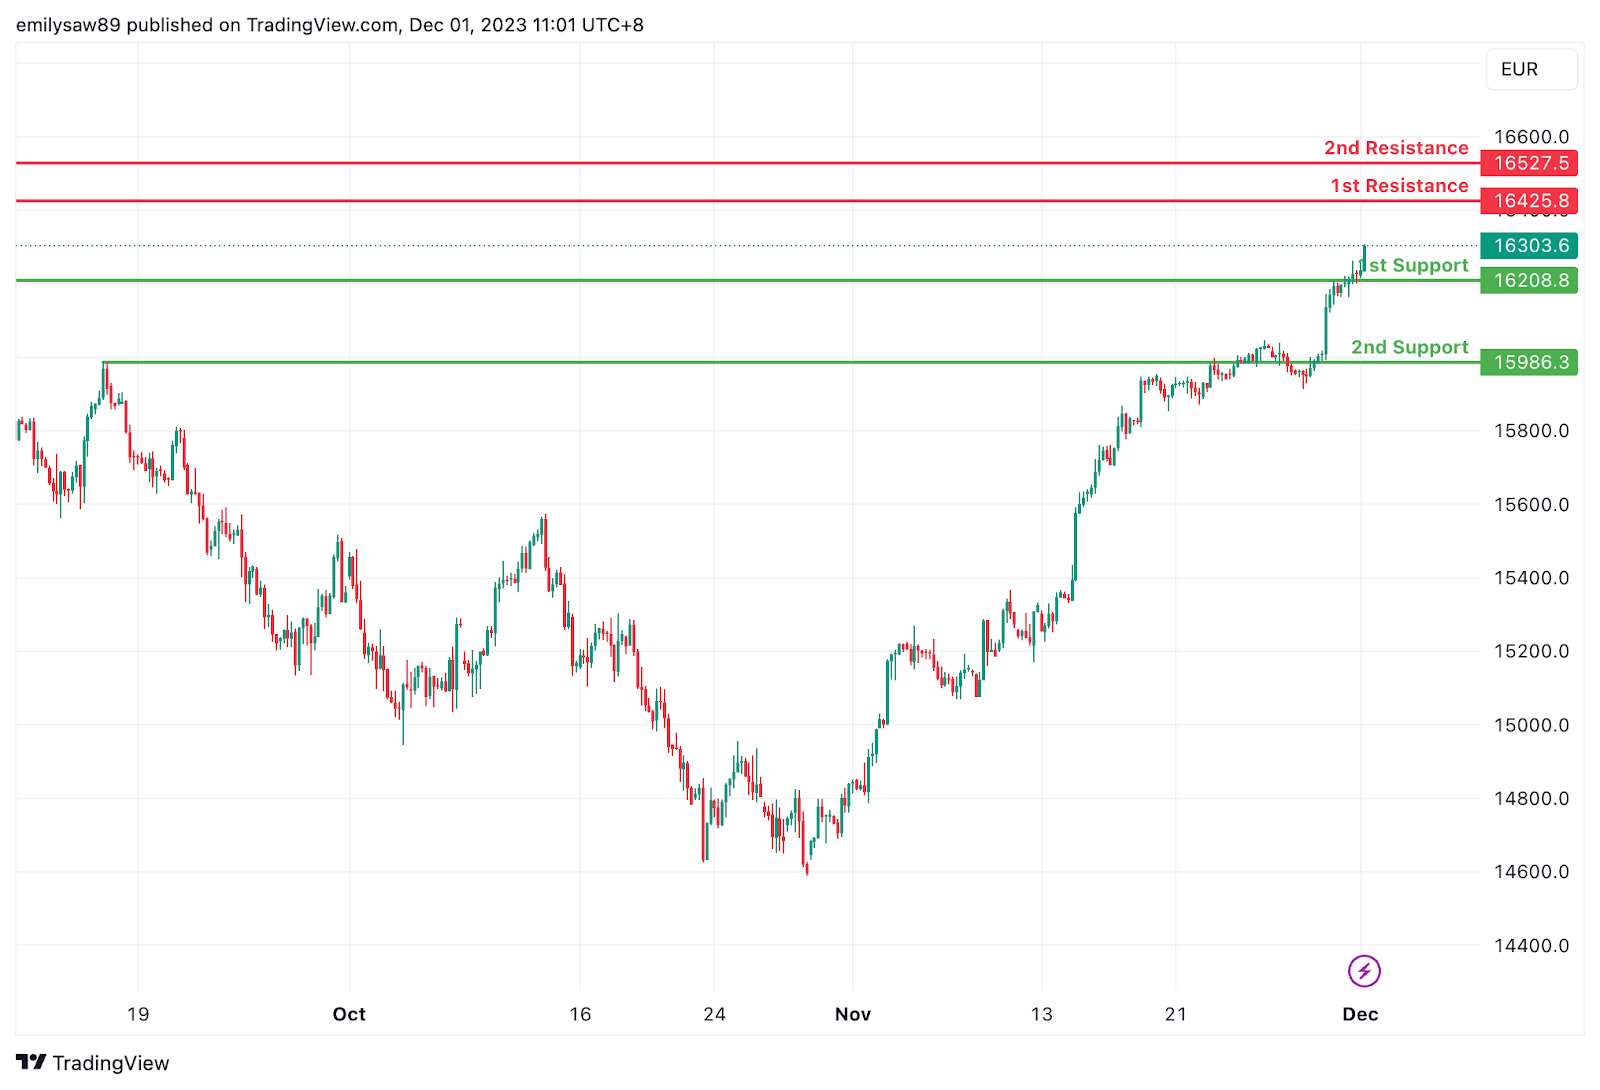
GER40:
The GER40 overall momentum is bullish, suggesting a potential continuation of the upward movement in price.There is a possibility that the price could experience a bullish bounce off the 1st support and head towards the 1st resistance.
1st support at 16208.8: This level is identified as a pullback support, indicating that it has previously acted as a significant price level where buyers have shown interest.This level is expected to provide support during a potential pullback in the price.
2nd support at 15986.3: The 2nd support level is marked as a multi-swing low support, suggesting that it aligns with historical price data and is likely to be a strong support level. It may serve as a critical level for traders to watch for potential rebounds or consolidation.
1st resistance at 162425.8: This level is considered a pullback resistance, indicating that it could be a point where selling pressure may increase, potentially leading to a temporary halt or correction in the bearish trend.
2nd resistance at 16527.5: The 2nd resistance level is marked as a swing high resistance, suggesting it has previously acted as a barrier to upward price movements. It could serve as a strong resistance level if the price attempts to move higher.
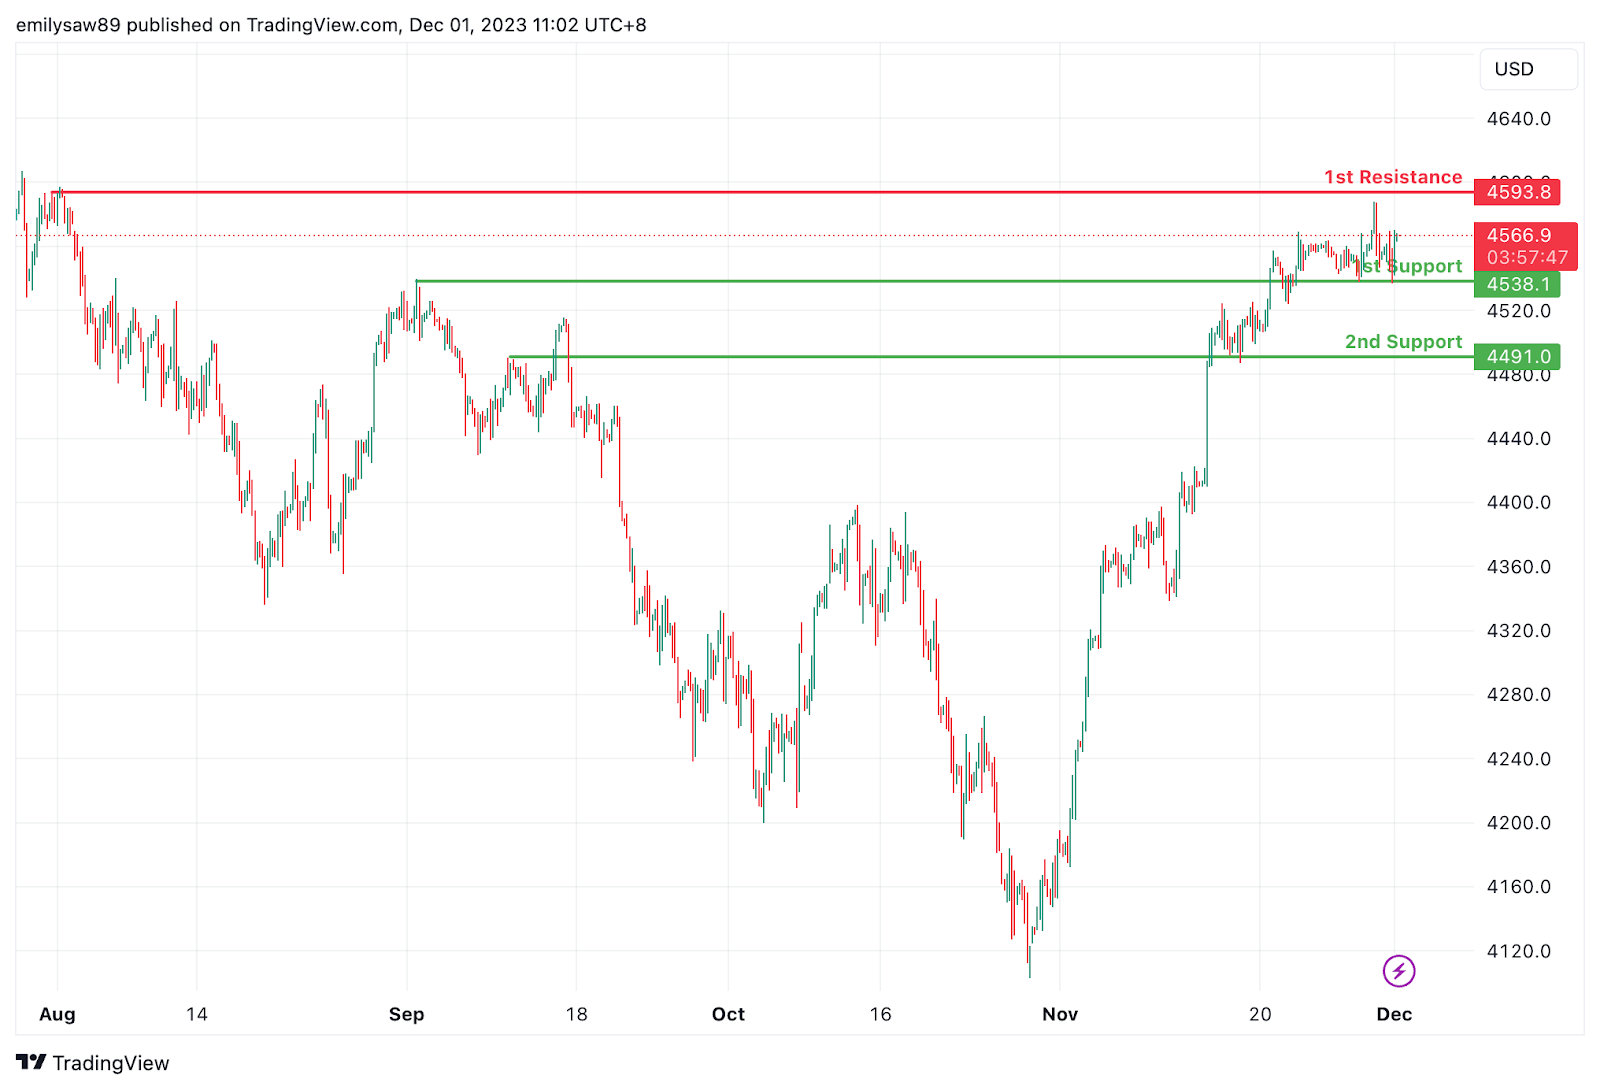
`US500:
The overall momentum of US500 is bullish, suggesting a potential continuation of the upward movement in price.
1st support at 4538.1: This level is identified as a pullback support, indicating that it has previously acted as a significant price level where buyers have shown interest. It may serve as a potential area of support This level is expected to provide support during potential pullbacks in the price.
2nd support at 4491.0: The 2nd support level is marked as a multi-swing low support, suggesting that it aligns with historical price data and is likely to be a strong support level. It may be considered a critical level for traders to watch for potential rebounds or consolidation.
1st resistance at 4593.8: This level is considered a pullback resistance, indicating that it could be a point where selling pressure may increase, potentially leading to a temporary correction within the bearish trend.
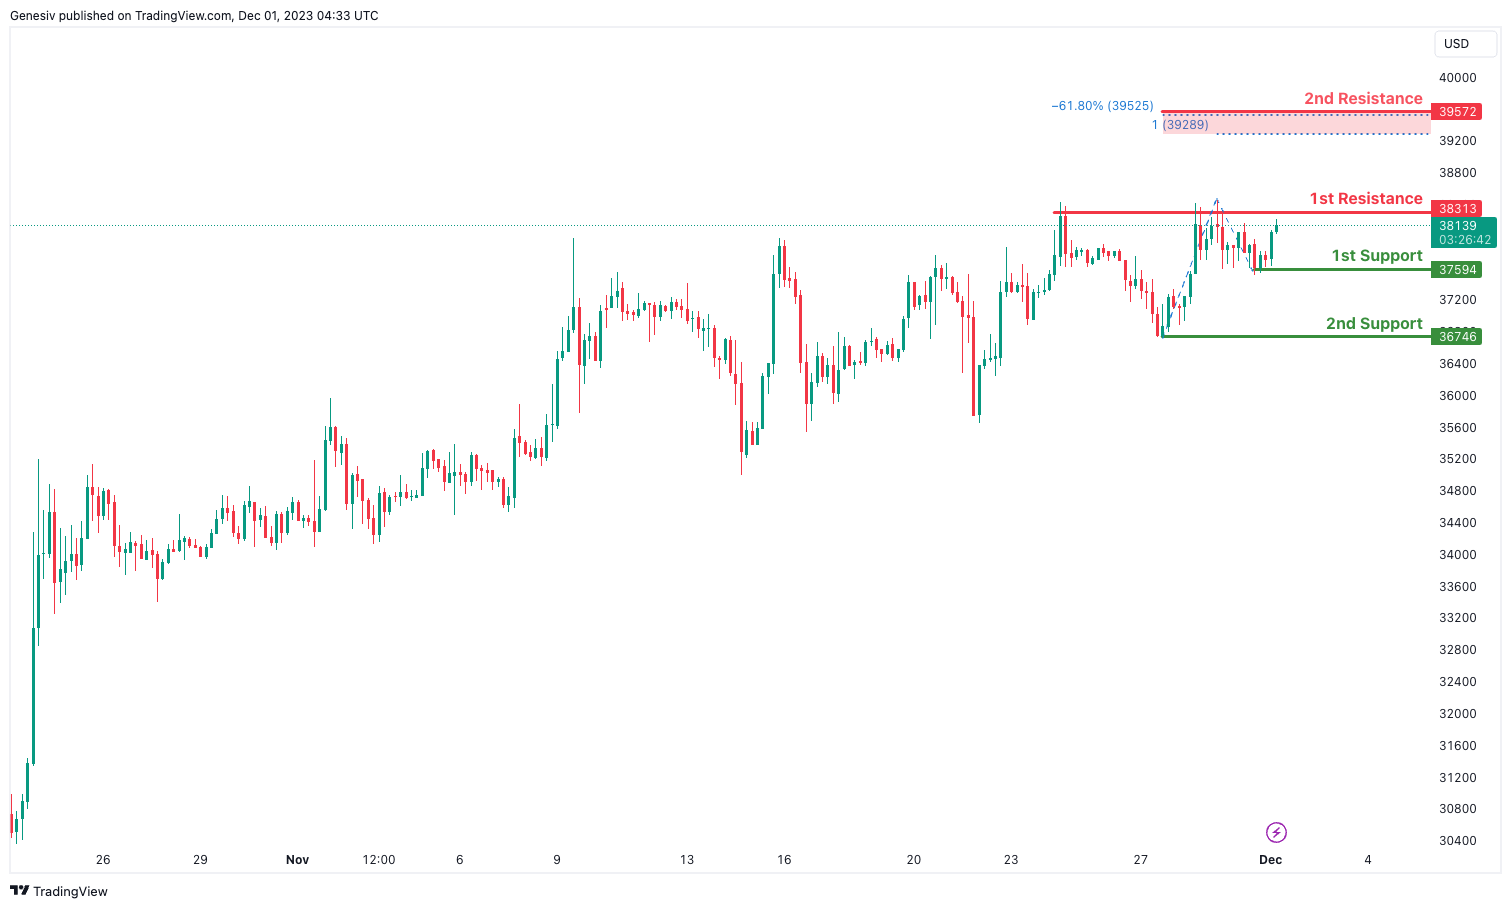
BTC/USD:
The analyzed instrument is BTC/USD, and the overall momentum of the chart is currently bullish.
There is a potential for the price to make a bullish continuation towards the 1st resistance.
The 1st support level is identified at 37594, and its favorable characteristic is attributed to being a swing low support.
The 2nd support level is situated at 36746, and its favorable aspect is derived from being a swing low support.
On the resistance side, the 1st resistance is positioned at 38313, and it is considered significant due to being a multi-swing high resistance.
The 2nd resistance is located at 39752, and its significance is derived from coinciding with the 61.80% Fibonacci Expansion and the 100% Fibonacci Projection, indicating Fibonacci confluence.
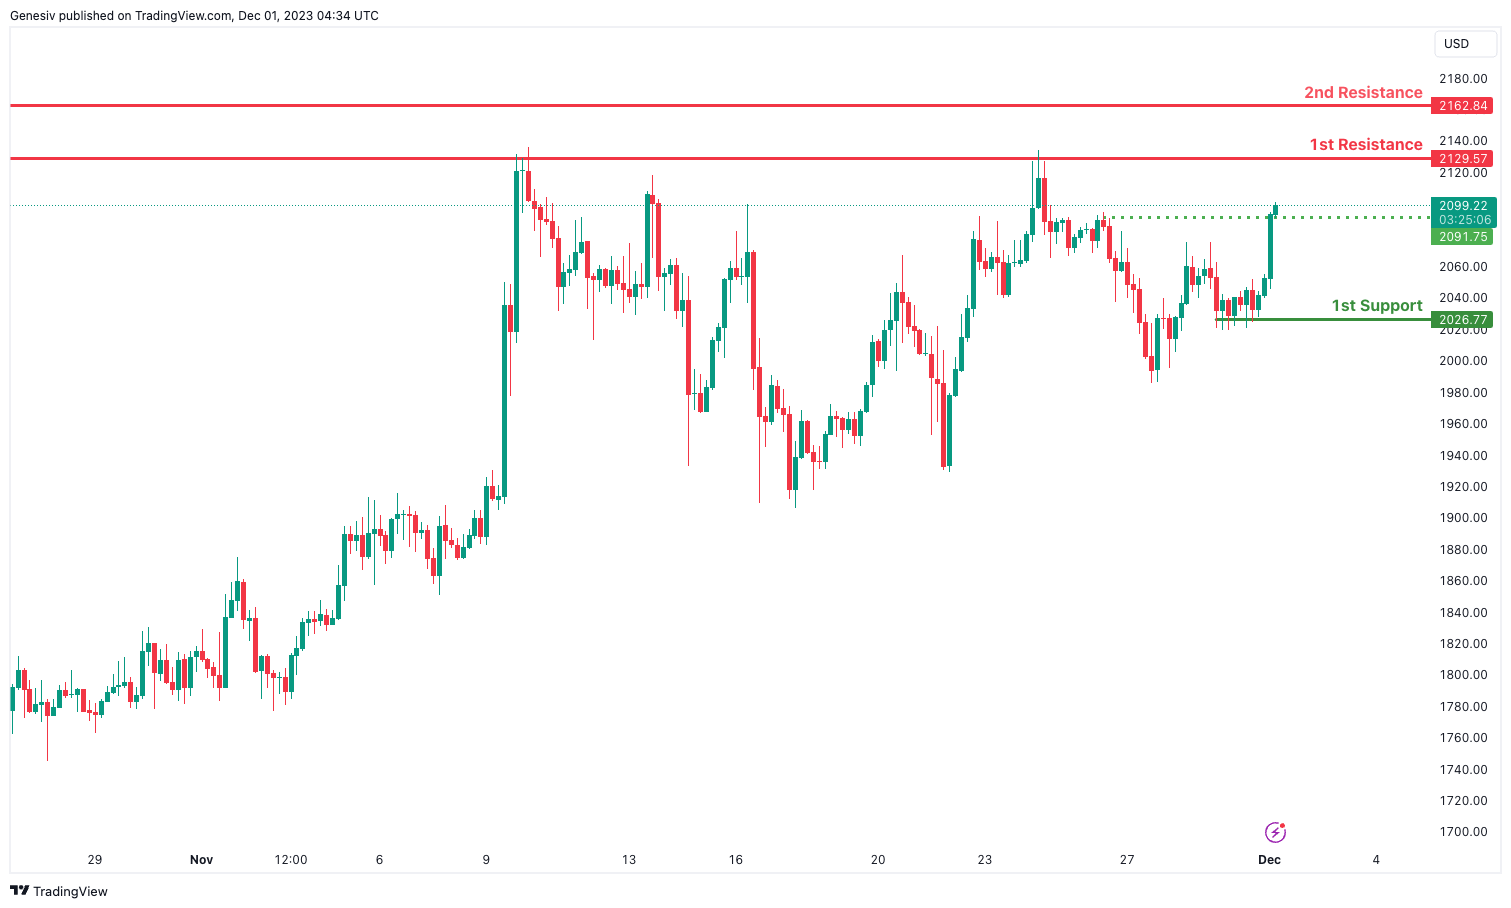
ETH/USD:
The analyzed instrument is ETH/USD, and the overall momentum of the chart is currently bullish.
There is a potential for the price to make a bullish continuation towards the 1st resistance.
The 1st support level is identified at 2026.77, and its favorable characteristic is attributed to being a multi-swing low support.
An intermediate support is also noted at 2091.75, and its significance is derived from being a pullback support.
On the resistance side, the 1st resistance is positioned at 2129.57, and it is considered significant due to being a multi-swing high resistance.
The 2nd resistance is located at 2162.84, and its significance is derived from being an overlap resistance.
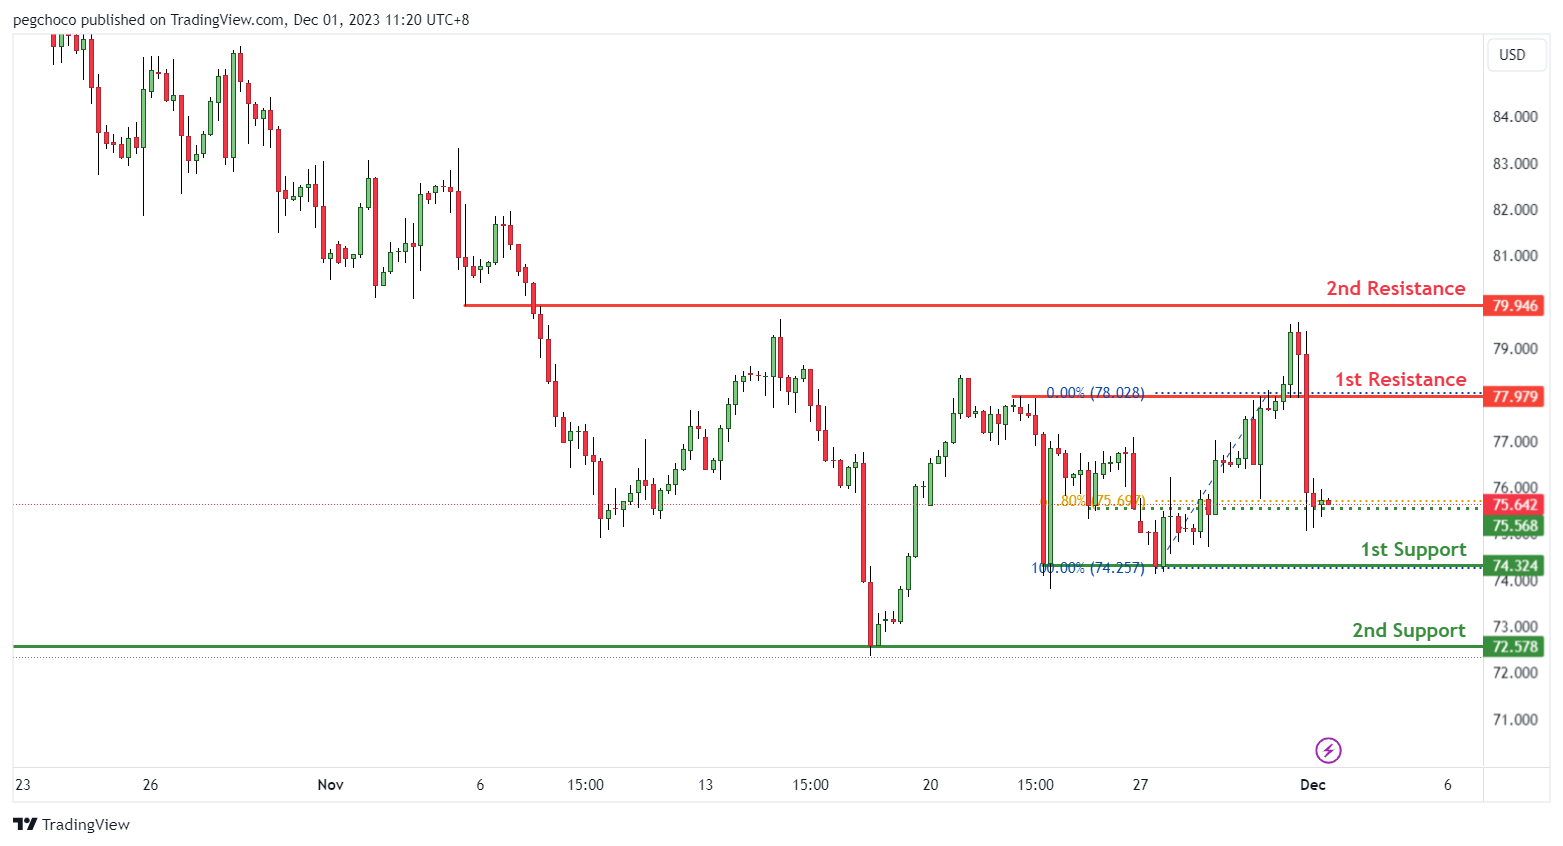
WTI/USD:
The WTI (West Texas Intermediate) chart currently displays a bearish overall momentum, indicating the potential for a bearish continuation towards the 1st support.
The 1st support at 74.32 is identified as a multi-swing low support, signifying its importance as a significant level where buying interest may emerge, potentially providing crucial support for WTI’s price.
The 2nd support at 72.57 is characterized as an overlap support, reinforcing its significance as a potential area for buyer activity.
On the resistance side, the 1st resistance at 77.97 represents a multi-swing high resistance, serving as a notable barrier where selling interest could intensify, potentially hindering further upward movement in the price of WTI.
Additionally, there is a 2nd resistance at 79.94, noted as a pullback resistance, further reinforcing potential resistance factors for the commodity.
Furthermore, an intermediate support level at 75.56 is identified as an overlap support with a 61.80% Fibonacci retracement, adding to its significance as a potential support level.
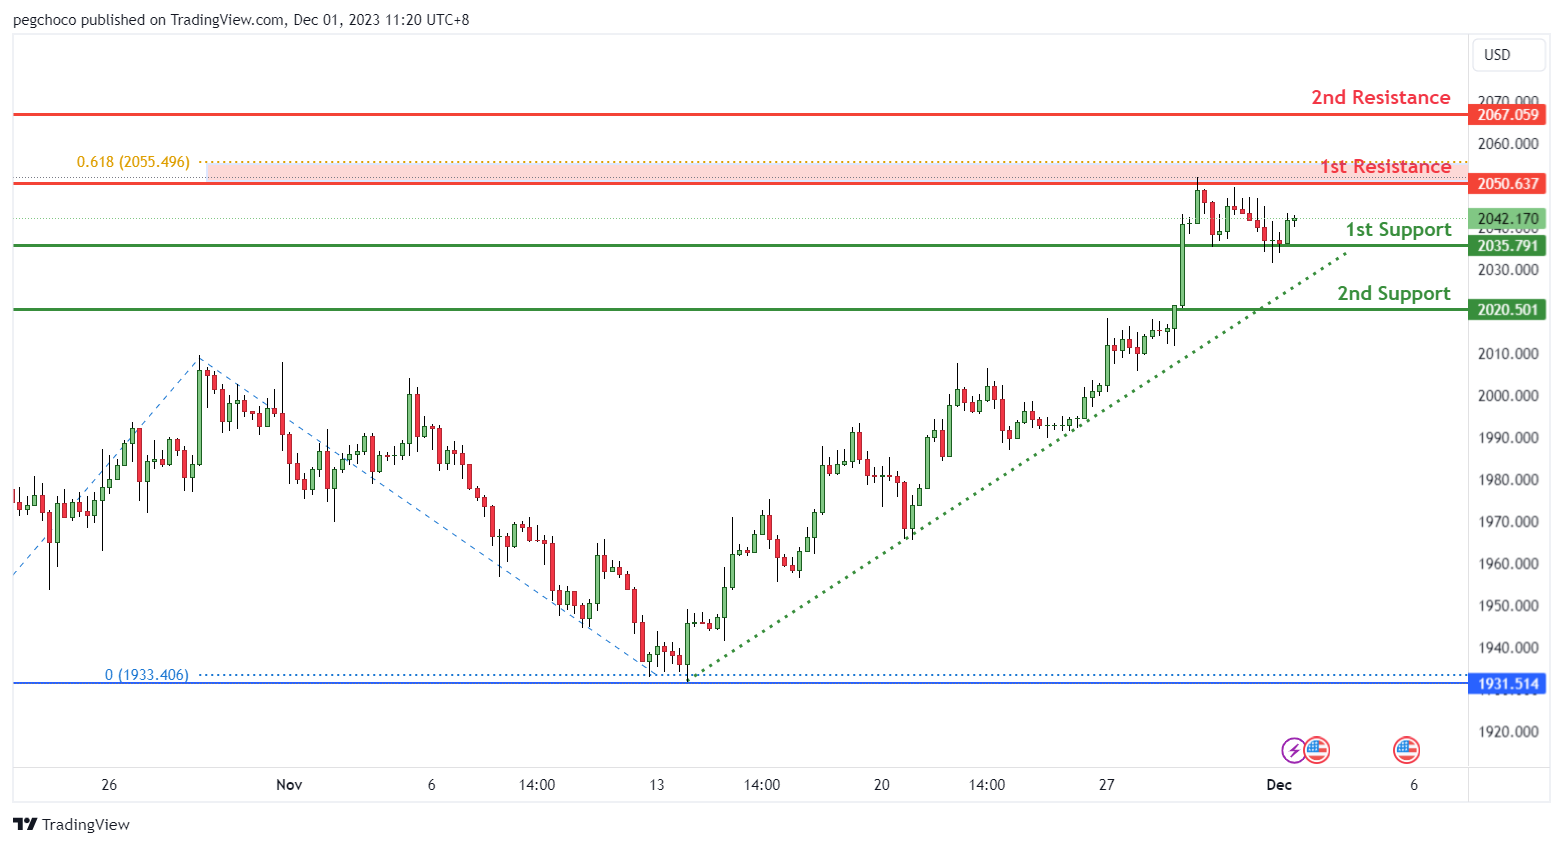
XAU/USD (GOLD):
The XAU/USD (Gold) chart demonstrates a bullish overall momentum, suggesting potential for a bullish bounce off the 1st support and movement towards the 1st resistance.
The 1st support at 2035.79 is identified as an overlap support, signifying its importance as a significant level where buying interest may emerge, potentially providing essential backing for XAU/USD.
The 2nd support at 2020.50 is categorized as pullback support, reinforcing its significance as a potential area for buyer activity.
On the resistance side, the 1st resistance at 2050.63 is characterized as a swing high resistance, featuring a 61.80% Fibonacci projection, representing a notable barrier where selling interest could intensify, potentially slowing XAU/USD’s upward movement.
The 2nd resistance at 2067.05 is also noted as a multi-swing high resistance, further reinforcing potential resistance factors for the precious metal.
.
The accuracy, completeness and timeliness of the information contained on this site cannot be guaranteed. IC Markets does not warranty, guarantee or make any representations, or assume any liability regarding financial results based on the use of the information in the site.
News, views, opinions, recommendations and other information obtained from sources outside of www.icmarkets.com, used in this site are believed to be reliable, but we cannot guarantee their accuracy or completeness. All such information is subject to change at any time without notice. IC Markets assumes no responsibility for the content of any linked site.
The fact that such links may exist does not indicate approval or endorsement of any material contained on any linked site. IC Markets is not liable for any harm caused by the transmission, through accessing the services or information on this site, of a computer virus, or other computer code or programming device that might be used to access, delete, damage, disable, disrupt or otherwise impede in any manner, the operation of the site or of any user’s software, hardware, data or property.


