
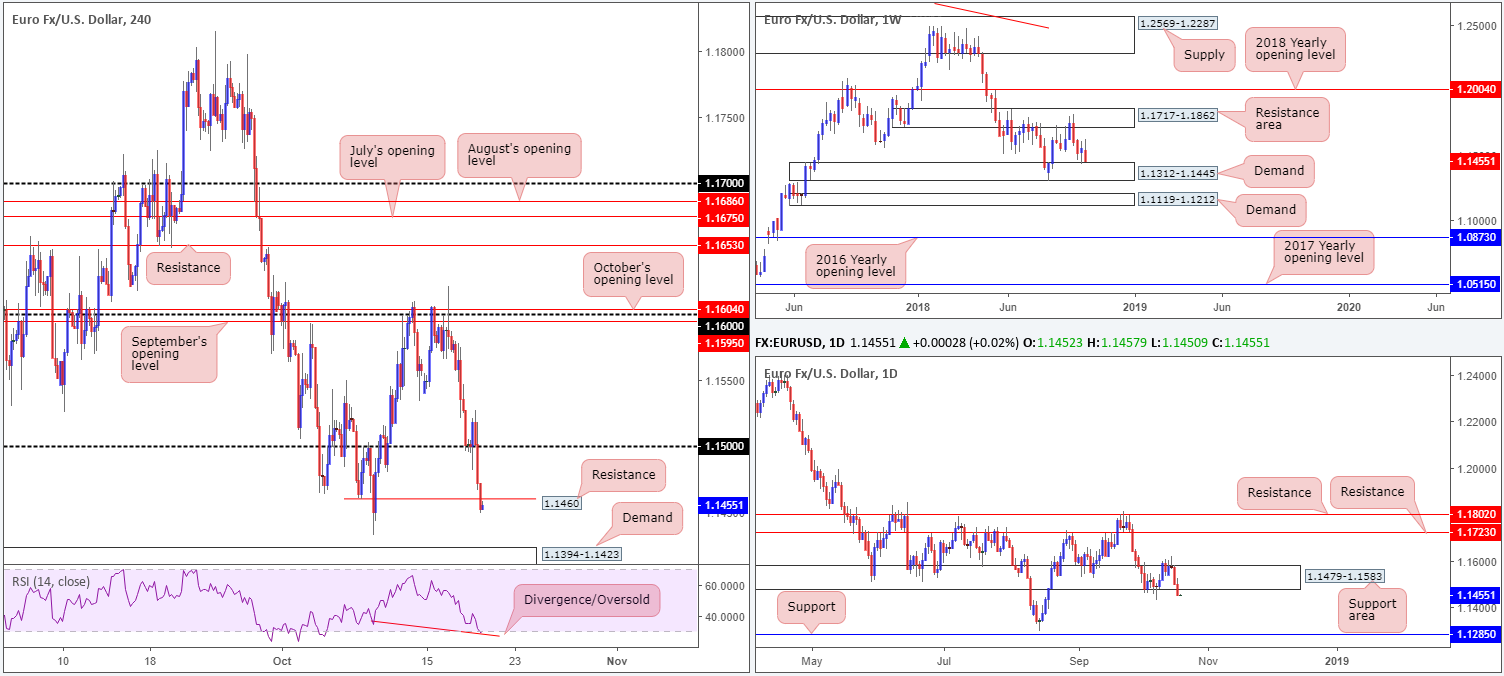
EUR/USD:
The euro refreshed weekly lows vs. its US counterpart Thursday, despite an earnest attempt to defend its 1.15 handle amid London hours. The resultant rebound in US Treasury yields bolstered the USD market, though the US dollar index remains unable to breach its next upside chart hurdle: 96.000.
Down 0.42% on the day, the H4 candles conquered nearby Quasimodo support at 1.1460 in strong near-full-bodied fashion (now acting resistance), possibly clearing the runway south on this scale towards demand plotted at 1.1394-1.1423. Also worth noting is the RSI indicator is presenting a divergence/oversold reading.
Against the backdrop of intraday flow, the weekly timeframe is seen hovering just north of demand at 1.1312-1.1445. A closer look at price action on the daily timeframe, nevertheless, shows the unit firmly closed beneath its support area at 1.1479-1.1583. Further selling, therefore, could be on the cards towards the August 15 lows of 1.1301/support at 1.1285.
Areas of consideration:
In terms of market structure, the general sense is both H4 and daily timeframes suggest lower prices may be in store, whereas weekly flow indicates a rotation higher.
From a technical standpoint, selling whilst a market is trading nearby weekly demand is chancy. This is not to say H4 price won’t reach its H4 demand mentioned above at 1.1394-1.1423, though we feel it’s a little too early/ambitious to be targeting daily support around 1.1285 right now.
For traders looking to attempt a short at 1.1460 today, waiting for additional candlestick pattern confirmation might be an idea, be it H4 or H1. This will help avoid a fakeout/unnecessary loss; also show seller intent and provide entry/stop parameters.
Today’s data points: FOMC member Bostic speaks.
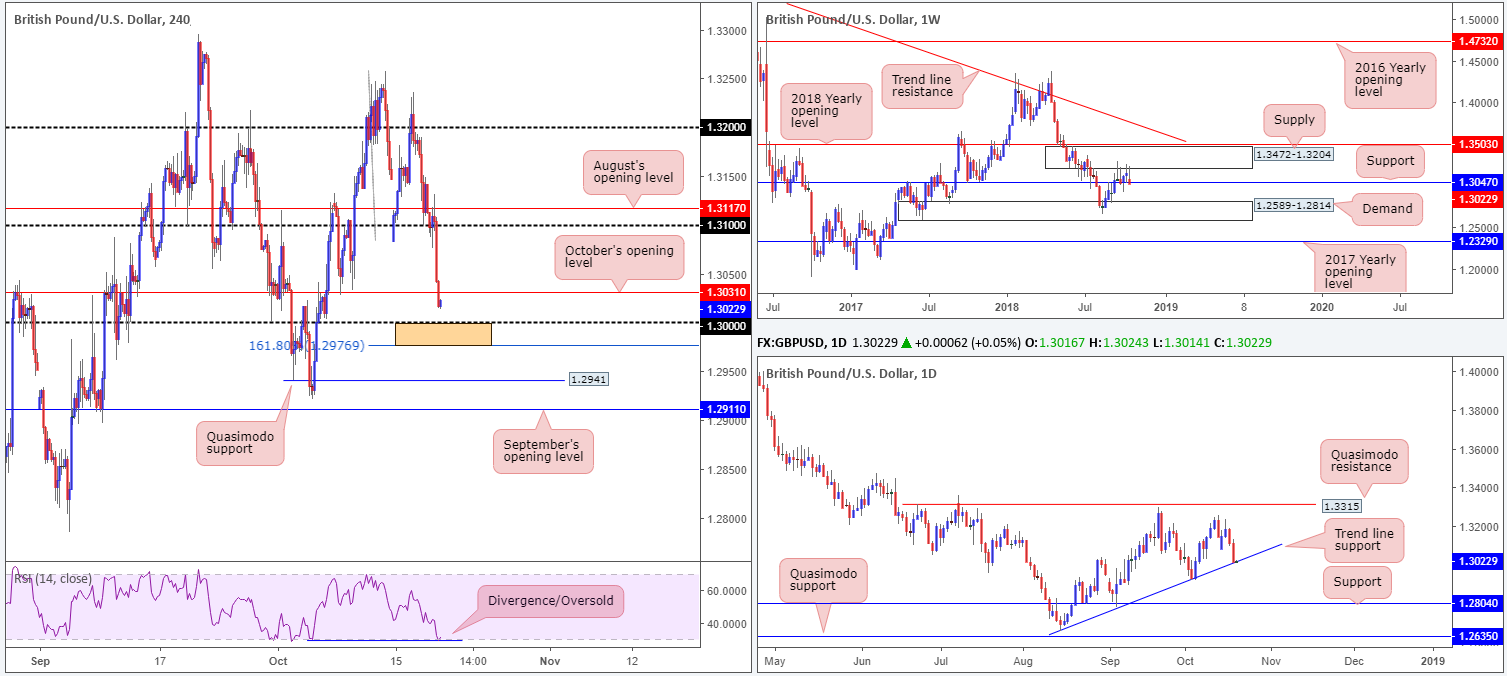
GBP/USD:
The British pound sank to a two-week low vs. the US dollar Thursday, down 0.74%.
The lack of progress in Brexit negotiations and UK retail sales falling in worse than expected weighed on the pound. A Brexit deal still appears remote with no sign of a compromise on the Irish border and customs. Talks now turn to extending the transition in an effort to resolve the outstanding issues. Adding to the GBP’s woes, the greenback continued to search higher ground following a rebound in US Treasury yields.
As is evident from the weekly timeframe, support at 1.3047 is struggling to hold ground. A weekly close beyond this number could unlock the gates for a test of demand penciled in at 1.2589-1.2814. Meanwhile, on the daily timeframe, a little light may be at the end of the tunnel! Movement is shaking hands with trend line support (etched from the low 1.2661).
H4 action is hovering just north of its key figure 1.30, shadowed closely by a 161.8% Fib ext. point at 1.2976 (orange zone). Beneath this point, traders are likely watching Quasimodo support at 1.2941/September’s opening level at 1.2911. RSI traders may also want to note the indicator is drawing in a divergence/oversold reading at the moment.
Areas of consideration:
Despite the threat of further downside playing out on the weekly timeframe, a bounce higher from 1.2976/1.30 (the orange H4 zone) may be in store. Note this area has close connections to the daily trend line support mentioned above.
Aggressive traders will likely target a long at 1.30 with stops plotted a few pips beneath 1.2976, whereas more conservative traders may drill down to the lower timeframes in attempt to enter based on a bullish candlestick configuration.
A H4 close back above October’s opening level at 1.3031 is considered a bullish cue, therefore allowing one to reduce risk to breakeven. Ultimately, though, traders will likely be watching 1.31 as a final take-profit target.
Today’s data points: UK public sector net borrowing; BoE Gov. Carney speaks; FOMC member Bostic speaks.
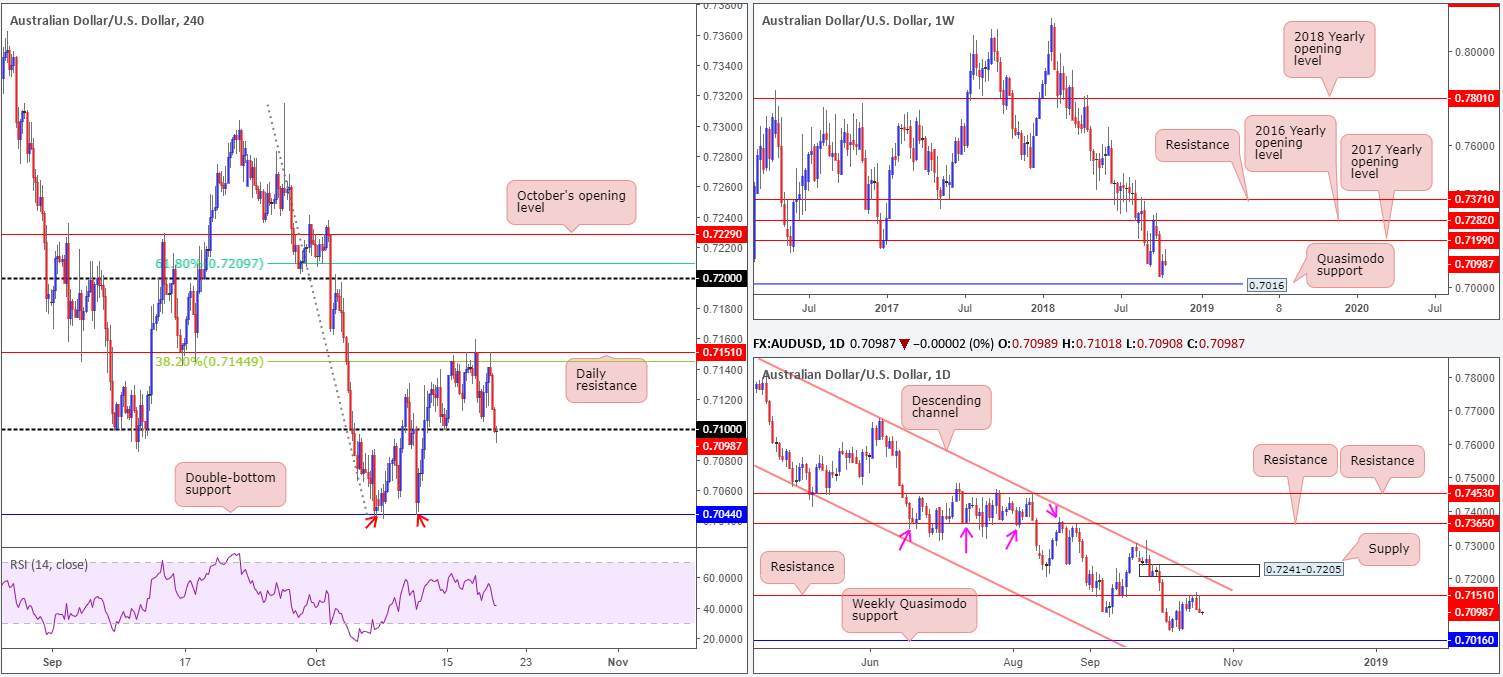
AUD/USD:
The Australian dollar, once again, failed to sustain gains beyond its 0.7050 mark Thursday, capped by hefty daily resistance at 0.7151, along with a 38.2% H4 Fib resistance at 0.7144 and a robust US dollar.
The pair is trading strongly to the downside as we head into Asia, testing the waters beneath 0.71 on the H4 timeframe. Trade war fears are clearly weighing on the Chinese economy, with growing concern the slowdown will have a measurable effect on China’s major trading partners.
While the H4 candles appear set to grapple with 0.71, traders are urged to consider where we’re coming from on the daily timeframe: resistance mentioned above at 0.7151 in the shape of a bearish engulfing pattern on Wednesday, followed by a bearish pin-bar formation on Thursday! Collectively, this is a strong bearish signal which could bring the H4 candles sub 0.71 today.
Areas of consideration:
Rather than looking to fade 0.71, a break of this number to the downside is expected. A H4 close beneath 0.71 that’s followed up with a retest by way of a H4 bearish candlestick formation is, according to our studies, a high-probability short, targeting H4 double-bottom support at 0.7044 as the initial port of call.
On the data front, however, early Asia brings with it a round of Chinese data which can affect AUD/USD movement. Therefore, trade with caution.
Today’s data points: China GDP q/y; China fixed asset investment ytd/y; China industrial production y/y; FOMC member Bostic speaks.
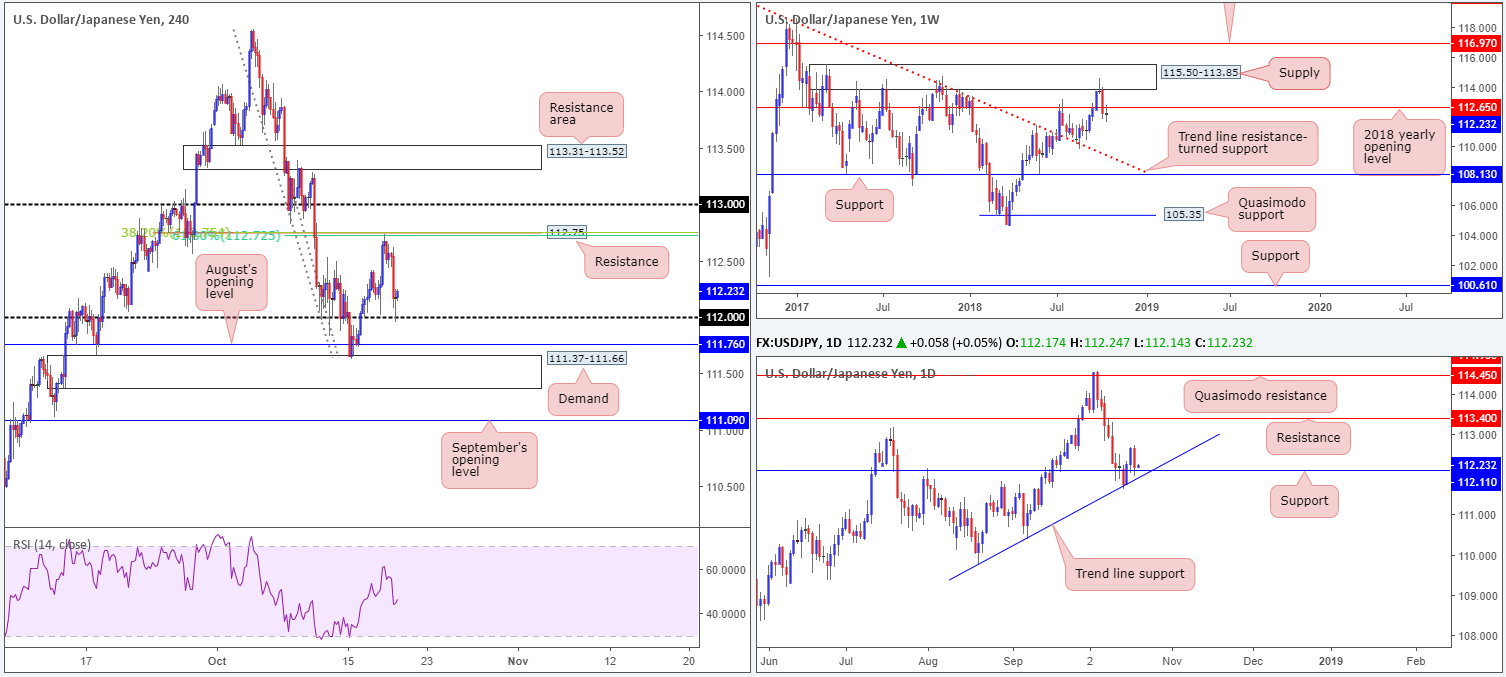
USD/JPY:
In recent sessions, the USD/JPY went back to playing on the defensive as US equities fell sharply. Demand for safe-haven assets pressured the pair to lows seen just south of 112 Thursday. For folks who read Thursday’s briefing you may recall H4 resistance at 112.75 and nearby weekly resistance at 112.65 (and two close-knit H4 Fibonacci resistances at 38.2%/61.8% at 112.75 and 112.72, respectively) was highlighted as a potential sell zone. Well done to any of our readers who managed to take advantage of this move!
Going forward, we can see weekly price is kicking its heels beneath its 2018 yearly opening level at 112.65, by way of an indecision candle. Daily price, on the other hand, brought support at 112.11 back into the spotlight yesterday in the shape of a bearish engulfing pattern. Traders may also want to acknowledge a trend line support surfacing nearby (extended from the low 109.77).
Areas of consideration:
In essence, we have the following to work with:
- Weekly resistance at 112.65.
- Daily support at 112.11/trend line support. However, traders are urged to consider Thursday’s bearish engulfing candle as well.
- 112 on the H4 timeframe is holding as we trade in Asia.
As you can see, the path is far from clear in this market in terms of structure at the moment. Neither a long nor shorts seems attractive, and is, therefore, labelled as ‘flat’ going into today’s sessions.
Today’s data points: FOMC member Bostic speaks; BoJ Gov. Kuroda speaks.
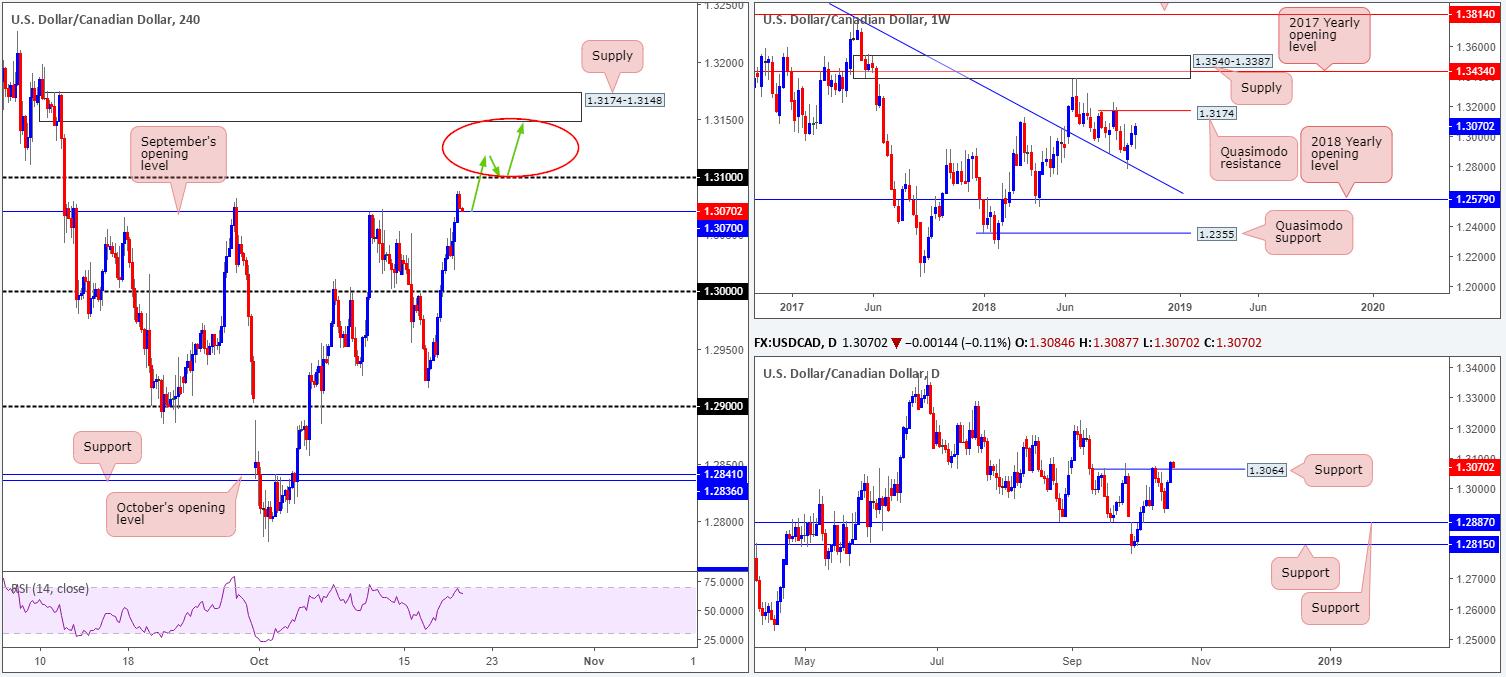
USD/CAD:
With crude oil slipping further into negative territory, coupled with broad-based USD strength, the USD/CAD market concluded Thursday’s segment up 0.51%.
According to the weekly timeframe, further upside could be in store, targeting Quasimodo resistance plotted at 1.3174. This bullish vibe is also echoed on the daily timeframe, following price action reclaiming a resistance level at 1.3064, which, technically speaking, should now act as support. In terms of this timeframe, we do not see much in the way of stopping the market from reaching the weekly Quasimodo resistance mentioned above at 1.3174.
Looking across to the H4 candles, however, the 1.31 handle is lurking overhead after price recently overthrew September’s opening level at 1.3070 (now acting support). Beyond 1.31 is supply penciled in at 1.3174-1.3148. Note the top edge of this area skirts the underside of the noted weekly Quasimodo resistance level.
Areas of consideration:
Having seen both weekly and daily timeframes emphasize a reasonably strong upside bias this morning, the 1.31 handle is likely to be engulfed.
Between 1.31 and the H4 supply mentioned above at 1.3174-1.3148 is a tradable zone, according to our technical studies. As such, a H4 close printed above 1.31 that’s followed up with a retest as support that holds form is considered a strong buy signal.
Traders are urged to keep risk/reward in mind here – look to achieve at least a 1:2 ratio to 1.3148!
Today’s data points: FOMC member Bostic speaks; Canadian inflation figures.
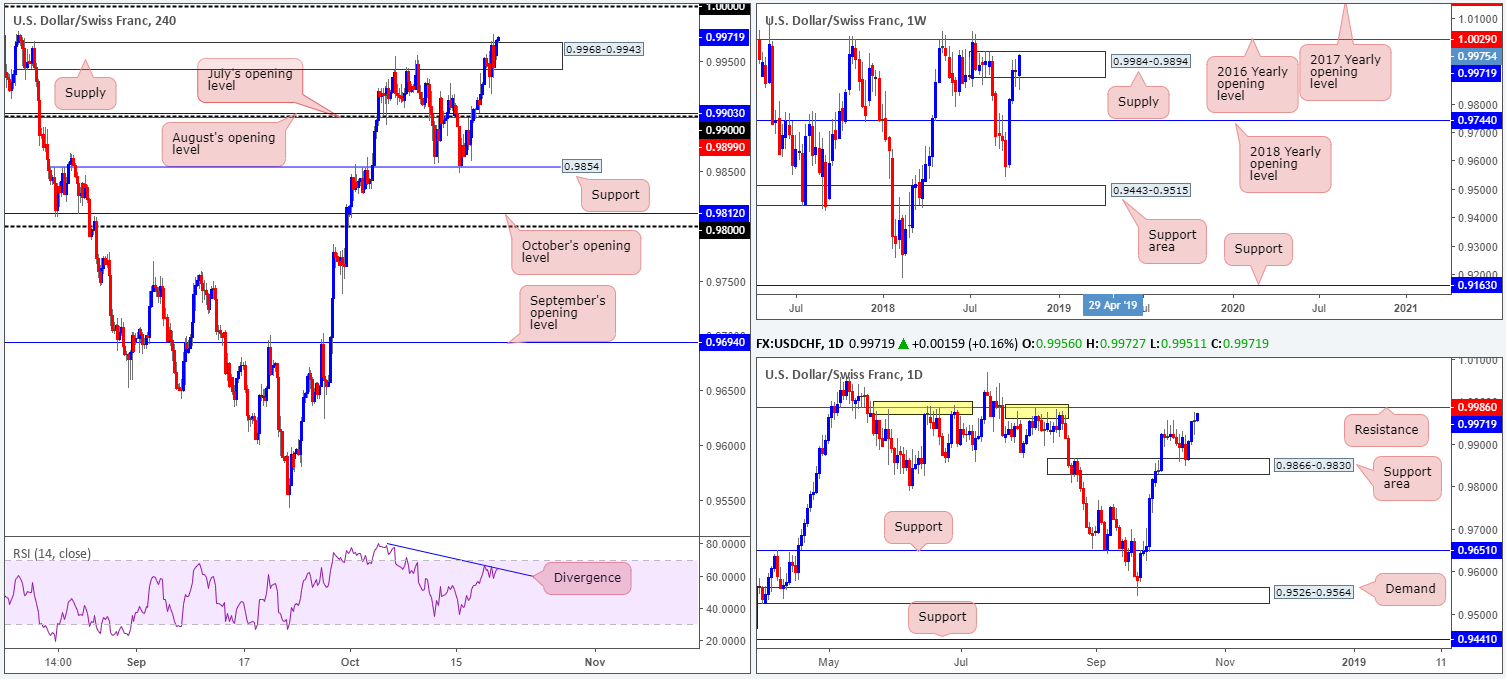
USD/CHF:
USD/CHF movement climbed to fresh two-month tops Thursday, bolstered by broad-based USD bidding. H4 supply at 0.9968-0.9943, as you can see, surrendered the top of its limit amid US hours, perhaps clearing stops for a move towards parity (1.0000). Traders may, however, want to take into account the H4 RSI indicator is currently displaying bearish divergence.
Despite recent upside, USD/CHF remains tucked within the upper limits of a weekly supply zone at 0.9984-0.9894. Judging by the current candle, though, a break towards the 2016 yearly opening level at 1.0029 may be on the cards. Daily action, nevertheless, is seen fast approaching resistance plotted two pips beyond the current weekly supply at 0.9986. Check out its recent history holding price action lower (yellow points) – it’s quite impressive!
Areas of consideration:
Based on the above reading, shorts from daily resistance at 0.9986 is certainly an option, with conservative stop-loss orders positioned above the 2016 yearly opening level at 1.0029 on the weekly timeframe. This helps clear any fakeout play around 1.0000, which, as most are aware, is common viewing around psychological numbers.
In terms of downside targets from here, the 0.99 handle appears a logical first step, according to the overall technical picture. That’s a 1:2 risk/reward ratio should the setup come to fruition.
Today’s data points: FOMC member Bostic speaks.
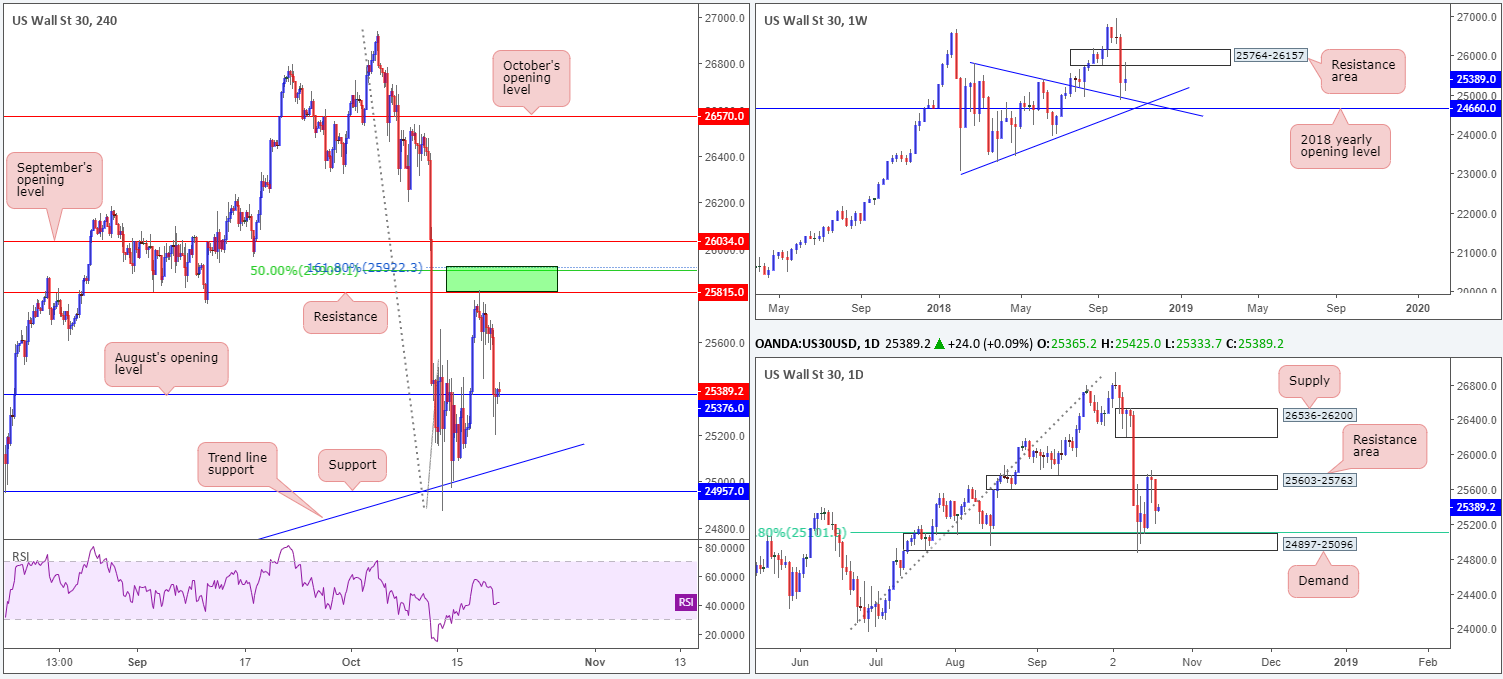
Dow Jones Industrial Average:
Trade war concerns along with rate-hike expectations weighed on the Dow Jones Industrial Average during Thursday’s sessions, down 1.38% on the day.
Traders who remained short from the highlighted H4 resistance at 25815 (coupled with a 161.8% H4 Fib ext. point at 25922, a 50.0% H4 resistance value at 25909 and current higher-timeframe resistance areas at 25764-26157 [weekly] and 25603-25763 [daily]) are in a healthy position this morning after price struck August’s opening level on the H4 timeframe at 25376 as the initial take-profit target.
Well done to any of our readers who managed to jump aboard this move!
Areas of consideration:
Aside from the H4 sell zone made up between 25922-25815, intraday shorts beyond August’s opening level are also something to keep eyes on today. A break/retest of this barrier has H4 trend line support (etched from the low 23451) to target, followed by a 61.8% daily Fib support at 25101 (positioned just north of daily demand at 24897-25096).
Today’s data points: FOMC member Bostic speaks.
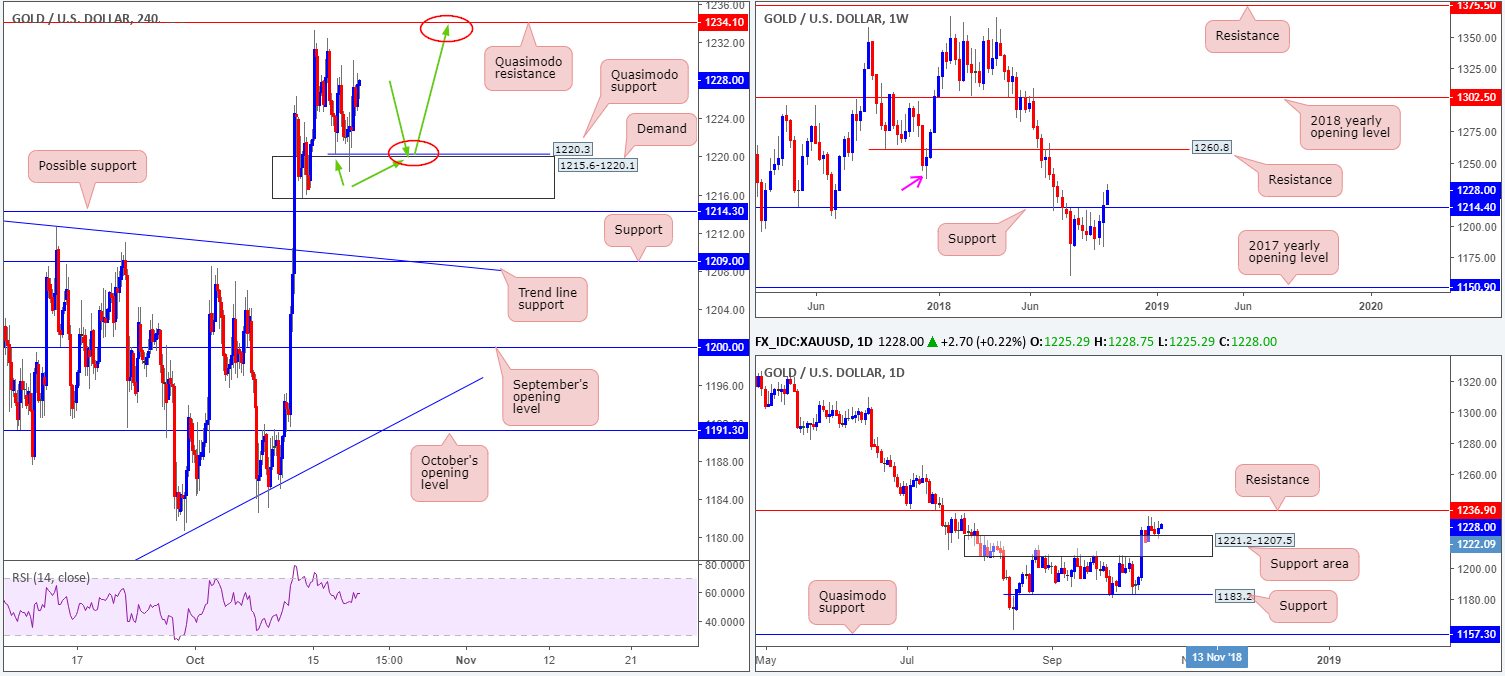
XAU/USD (Gold):
H4 demand at 1215.6-1220.1, as you can see, held price higher yesterday. Housed within the upper limits of the daily support area at 1221.2-1207.5, price could potentially stretch as far north as the H4 Quasimodo resistance level priced in at 1234.1. Beyond here, we have daily resistance stationed nearby at 1236.9, which also happens to represent a swing resistance on the weekly timeframe at 1236.6 (pink arrow).
Until price connects with 1234.1/1236.9, this market boasts an upside bias, according to our reading. A pullback from current price could bring H4 action towards a recently formed Quasimodo support linked at 1220.3 (positioned just ahead of the current H4 demand area).
Areas of consideration:
A pullback to the current H4 Quasimodo support along with a response by means of a H4 bullish candlestick formation would, according to where we’re located on the higher timeframes at the moment, be considered a high-probability buying opportunity, targeting the H4 Quasimodo resistance at 1234.1.
As for stop and entry parameters, traders have the choice of either following the selected candlestick configuration or entering based on the candlestick close and placing stops beneath H4 demand at 1215.6-1220.1.
The use of the site is agreement that the site is for informational and educational purposes only and does not constitute advice in any form in the furtherance of any trade or trading decisions.
The accuracy, completeness and timeliness of the information contained on this site cannot be guaranteed. IC Markets does not warranty, guarantee or make any representations, or assume any liability with regard to financial results based on the use of the information in the site.
News, views, opinions, recommendations and other information obtained from sources outside of www.icmarkets.com.au, used in this site are believed to be reliable, but we cannot guarantee their accuracy or completeness. All such information is subject to change at any time without notice. IC Markets assumes no responsibility for the content of any linked site. The fact that such links may exist does not indicate approval or endorsement of any material contained on any linked site.
IC Markets is not liable for any harm caused by the transmission, through accessing the services or information on this site, of a computer virus, or other computer code or programming device that might be used to access, delete, damage, disable, disrupt or otherwise impede in any manner, the operation of the site or of any user’s software, hardware, data or property.


