
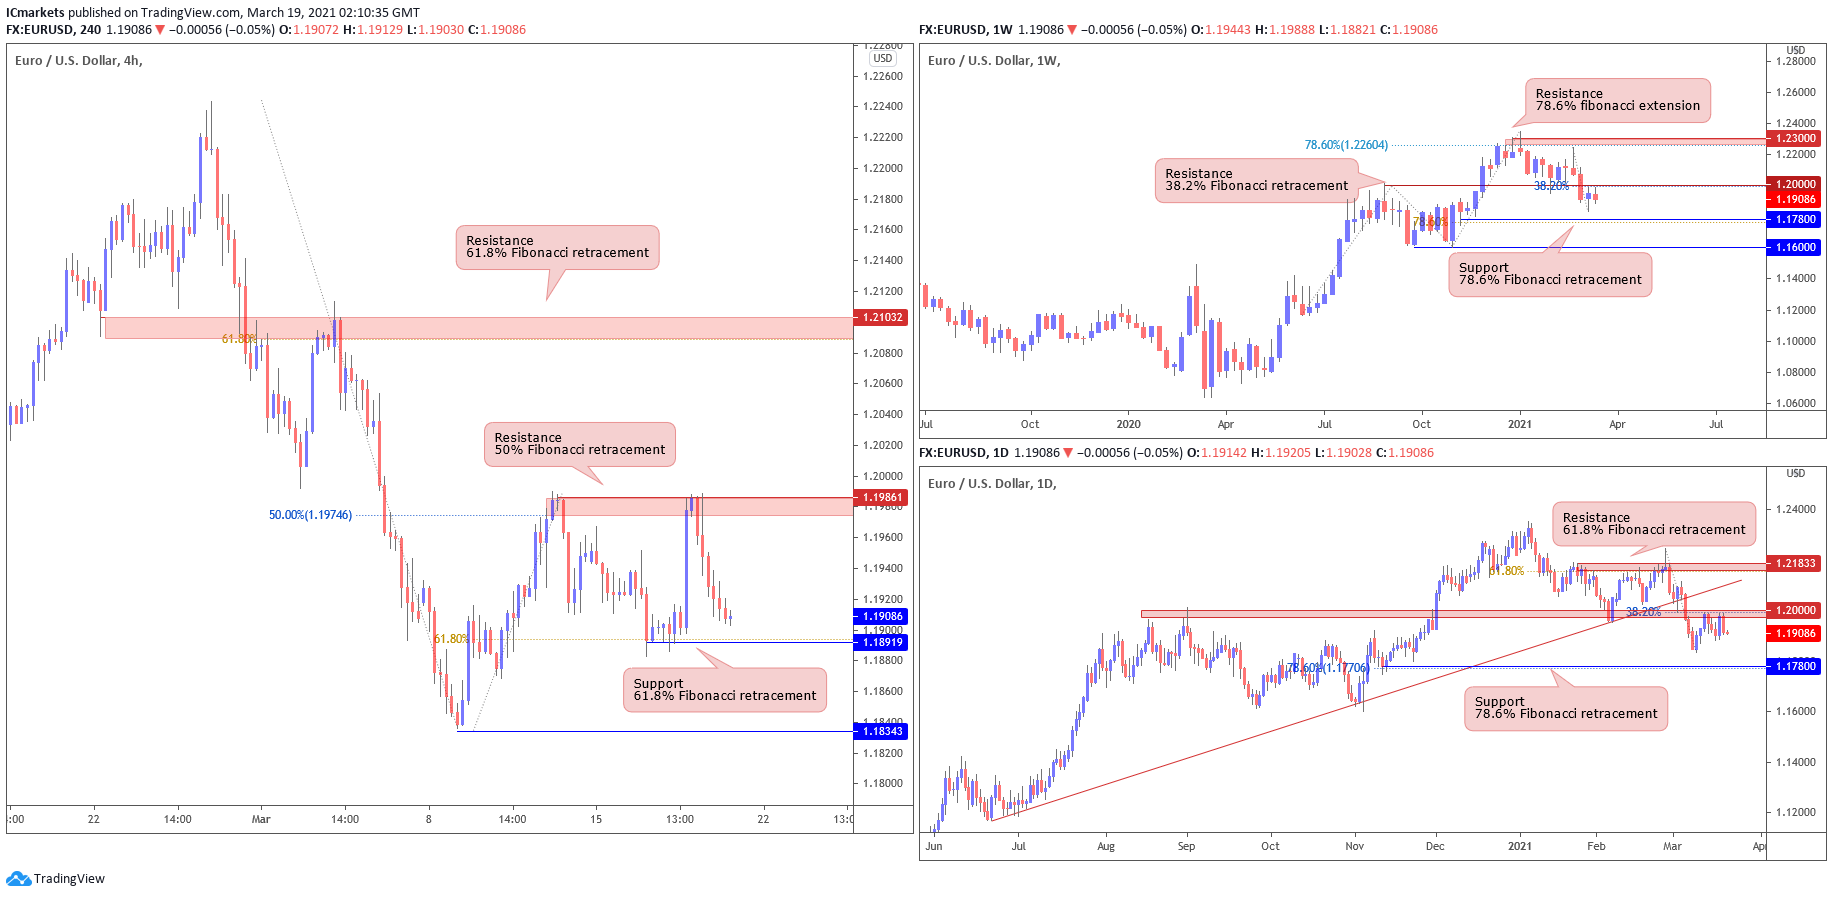
EUR/USD:
Looking at the weekly chart, we can see that prices broke our ascending trend line and key support-turned-resistance level at 1.20000, where we could see a further downside before prices reach the next support target at 1.17800, which coincides with 78.6% Fibonacci retracement. The daily time frame echoes the same bearish view as well and we could see a further downside below our resistance level at 1.2000, with 1.17800 as the next support target.
On the H4 timeframe, prices are facing bearish pressure from our resistance level at 1.19861, in line with the 50% fibonacci retracement and graphical swing high resistance where we could see a reversal below this level to our support target at 1.18919, in line with the graphical swing low support area.
Areas of consideration:
- 19861 resistance area found on H4 time frame
- 18919 support area found on H4 time frame
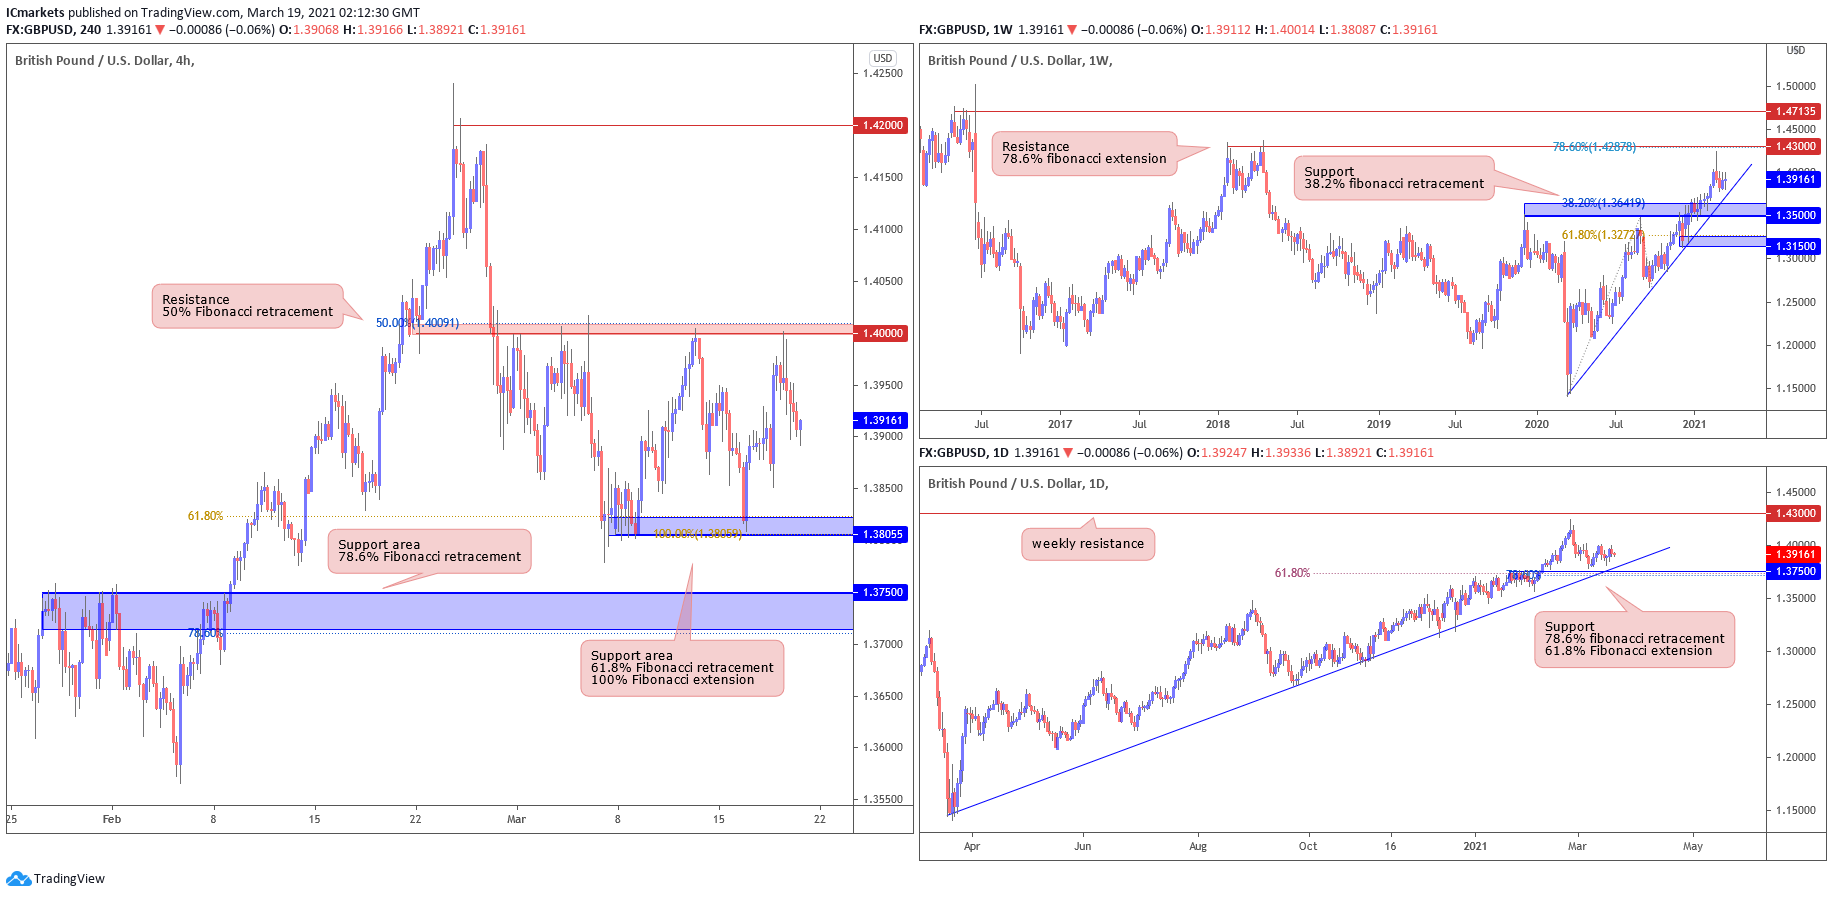
GBP/USD:
Looking at the weekly chart, we can see that prices are facing bullish pressure from our ascending trend line and weekly support area at 1.35000, in line with the graphical pullback support area and 38.2% Fibonacci retracement. On the daily time frame, prices are holding nicely above a key support area at 1.37500, which coincides with the 78.6% Fibonacci retracement, 61.8% fibonacci extension and ascending trend line.
On the H4 timeframe, prices are facing bullish pressure from our support at 1.38055, in line with our graphical support area, 78.6% Fibonacci extension and 61.8% fibonacci retracement where we could see a bounce above this level to our next resistance target at 1.40000. A break above our resistance level at 1.40000 on the H4 time frame, in line with the 50% fibonacci retracement could see a further push up to our next resistance target at 1.42000, in line with the graphical swing high resistance.
Areas of consideration:
- 4000 resistance area found on H4 time frame
- 38055 support area found on H4 timeframe
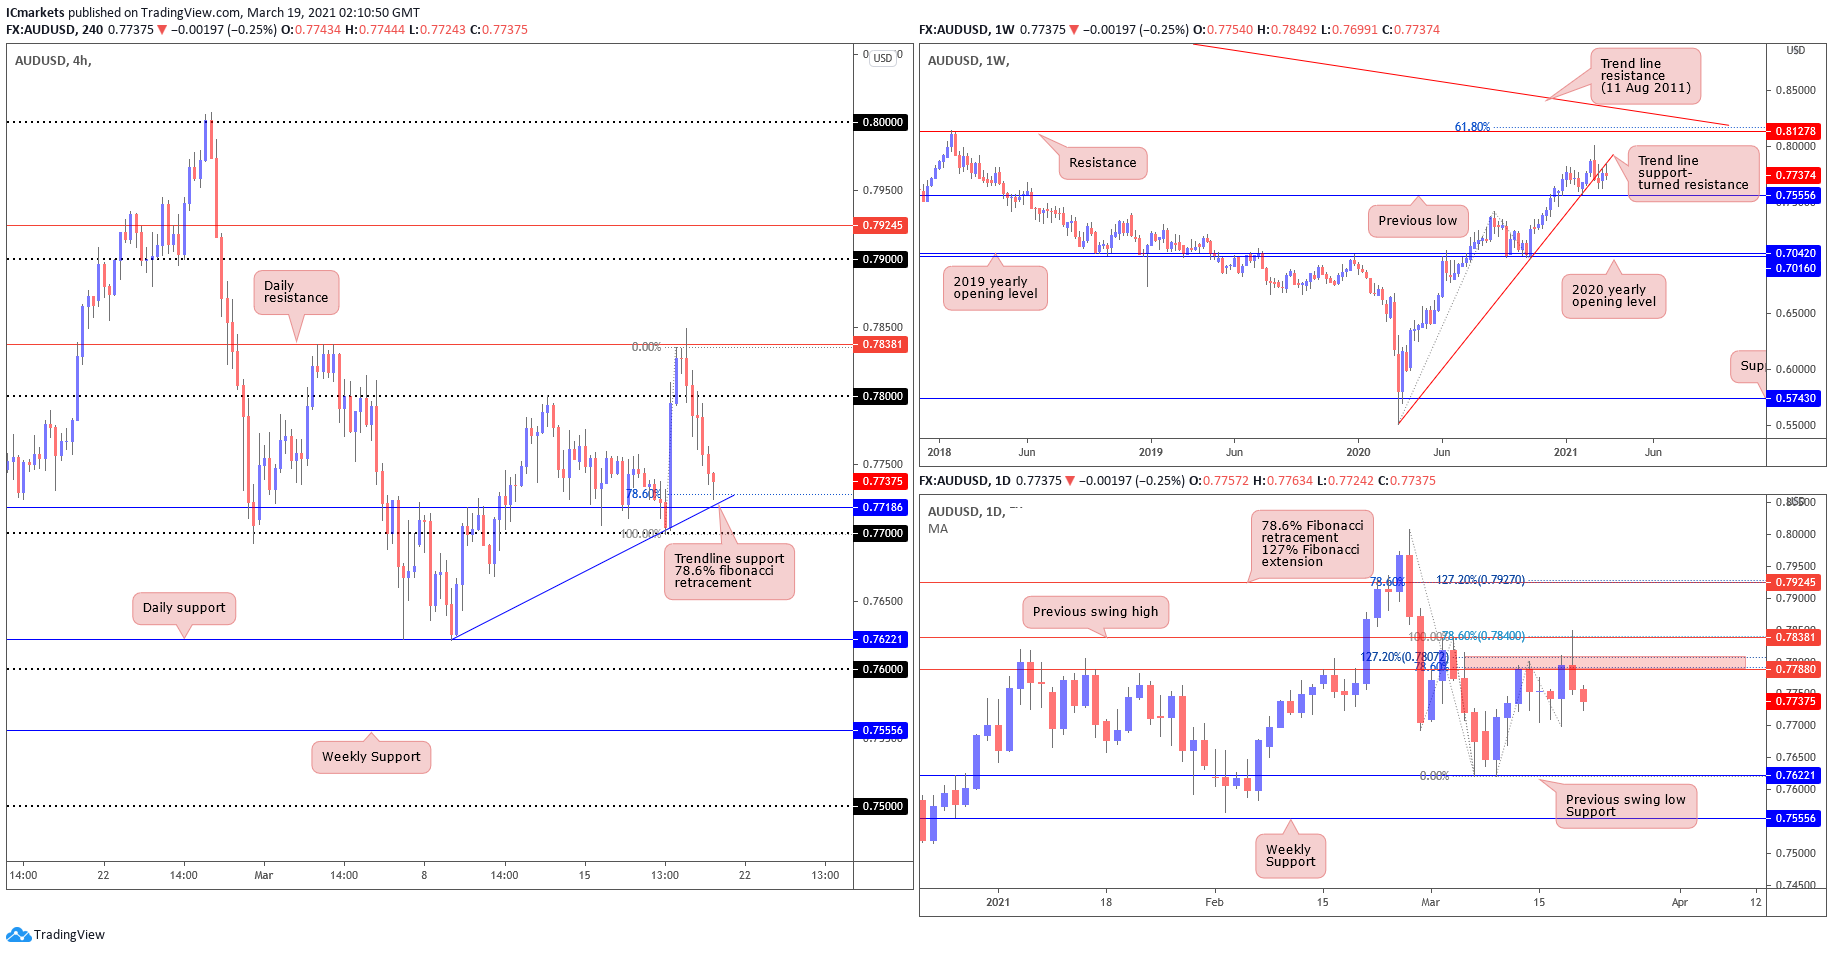
AUD/USD:
From the Weekly timeframe, we can see that the price has broken the ascending trendline support turned-resistance drawn from 9th March (2020), where the current price has retested with a bullish candle. On the Daily timeframe, price has reversed from the level of 0.77880 where 78.6% fibonacci retracement and 127% fibonacci extension are, before closing beneath the resistance level. Lastly, on the H4, price has shown a strong 100 pips move away from the Daily resistance, tapping right at 78.6% fibonacci retracement of the previous move. We are able to draw a trendline support in line with 78.6% fibonacci retracement level at 0.77274. This is an area of consideration for the continuation of the bullish momentum towards 0.78 major figure.
Areas of consideration:
- H4 showing bullish momentum and may find support at 0.77274.
- Daily time frame showing reversal from previous high.
- Weekly showed higher low created, signifying bullish trend.
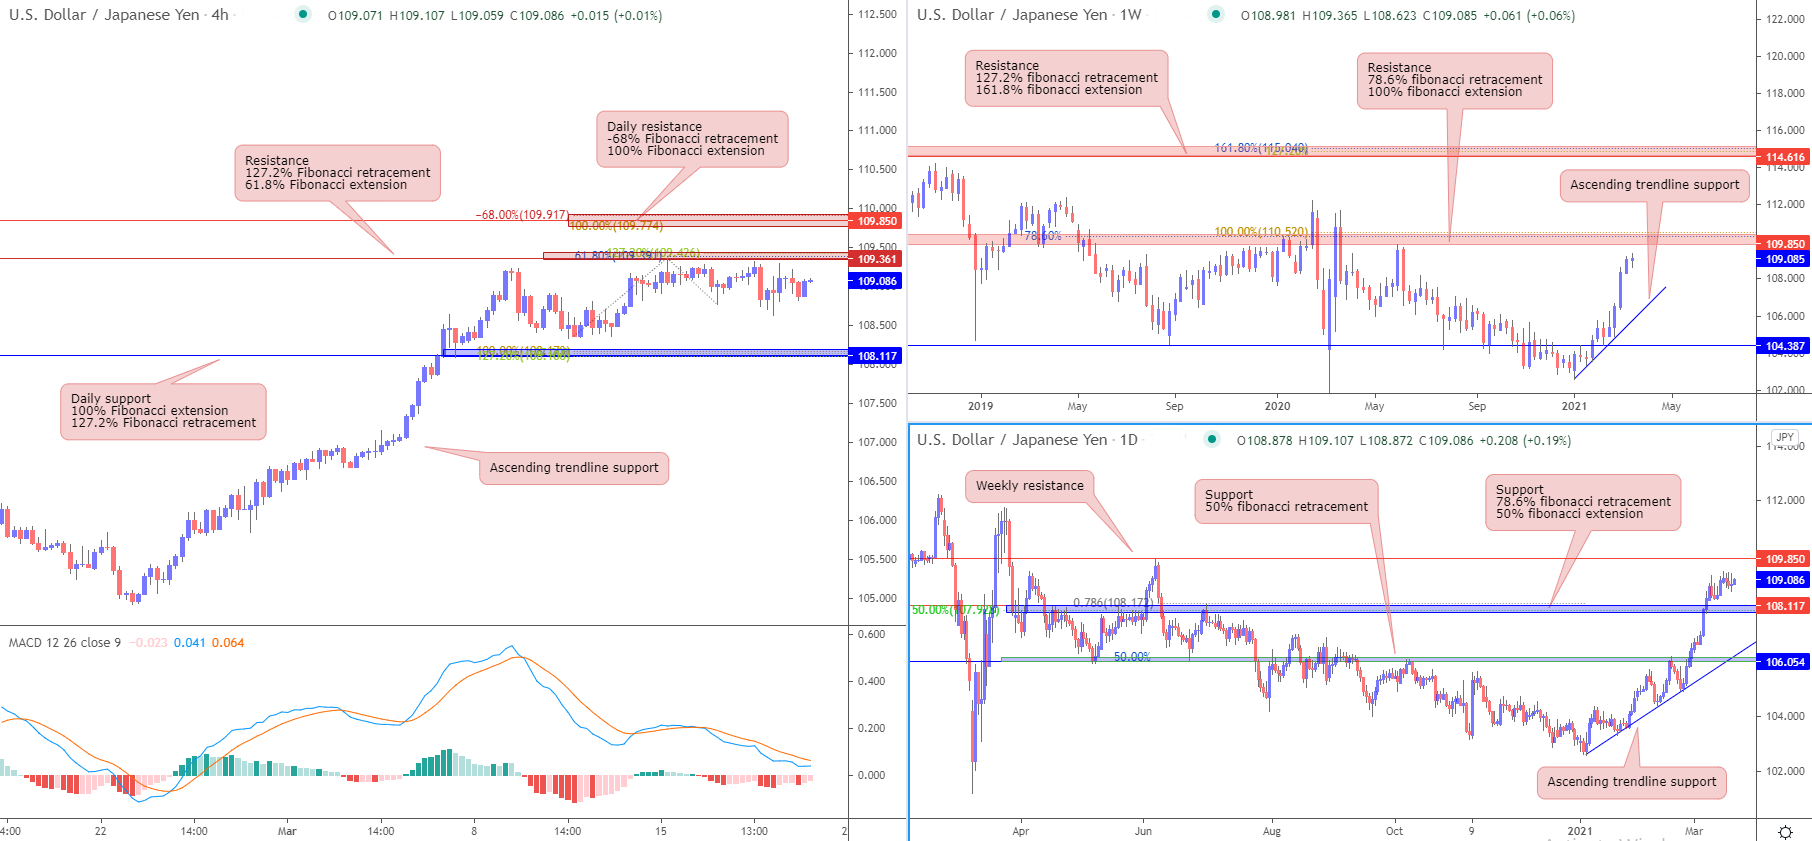
USD/JPY
From the weekly timeframe, prices are taking support from ascending trendline support,facing resistance from horizontal swing high resistance which coincides with 100% fibonacci extension and 78.6% fibonacci retracement. In the daily time frame, prices are taking support from horizontal pullback support which coincides with 50% fibonacci retracement and 78.6% fibonacci retracement. In the H4 time frame, prices seem to face resistance from horizontal swing high resistance which coincides with 61.8% fibonacci extension and 127.2% fibonacci retracement and pullback towards support on the weekly. MACD alao showing bearish pressure for prices.
Areas of consideration:
- On the H4, prices might pull back to 108.841 level which coincides with 100% fibonacci extension and 127.2% fibonacci retracement
- 361 might be a possible reversal point
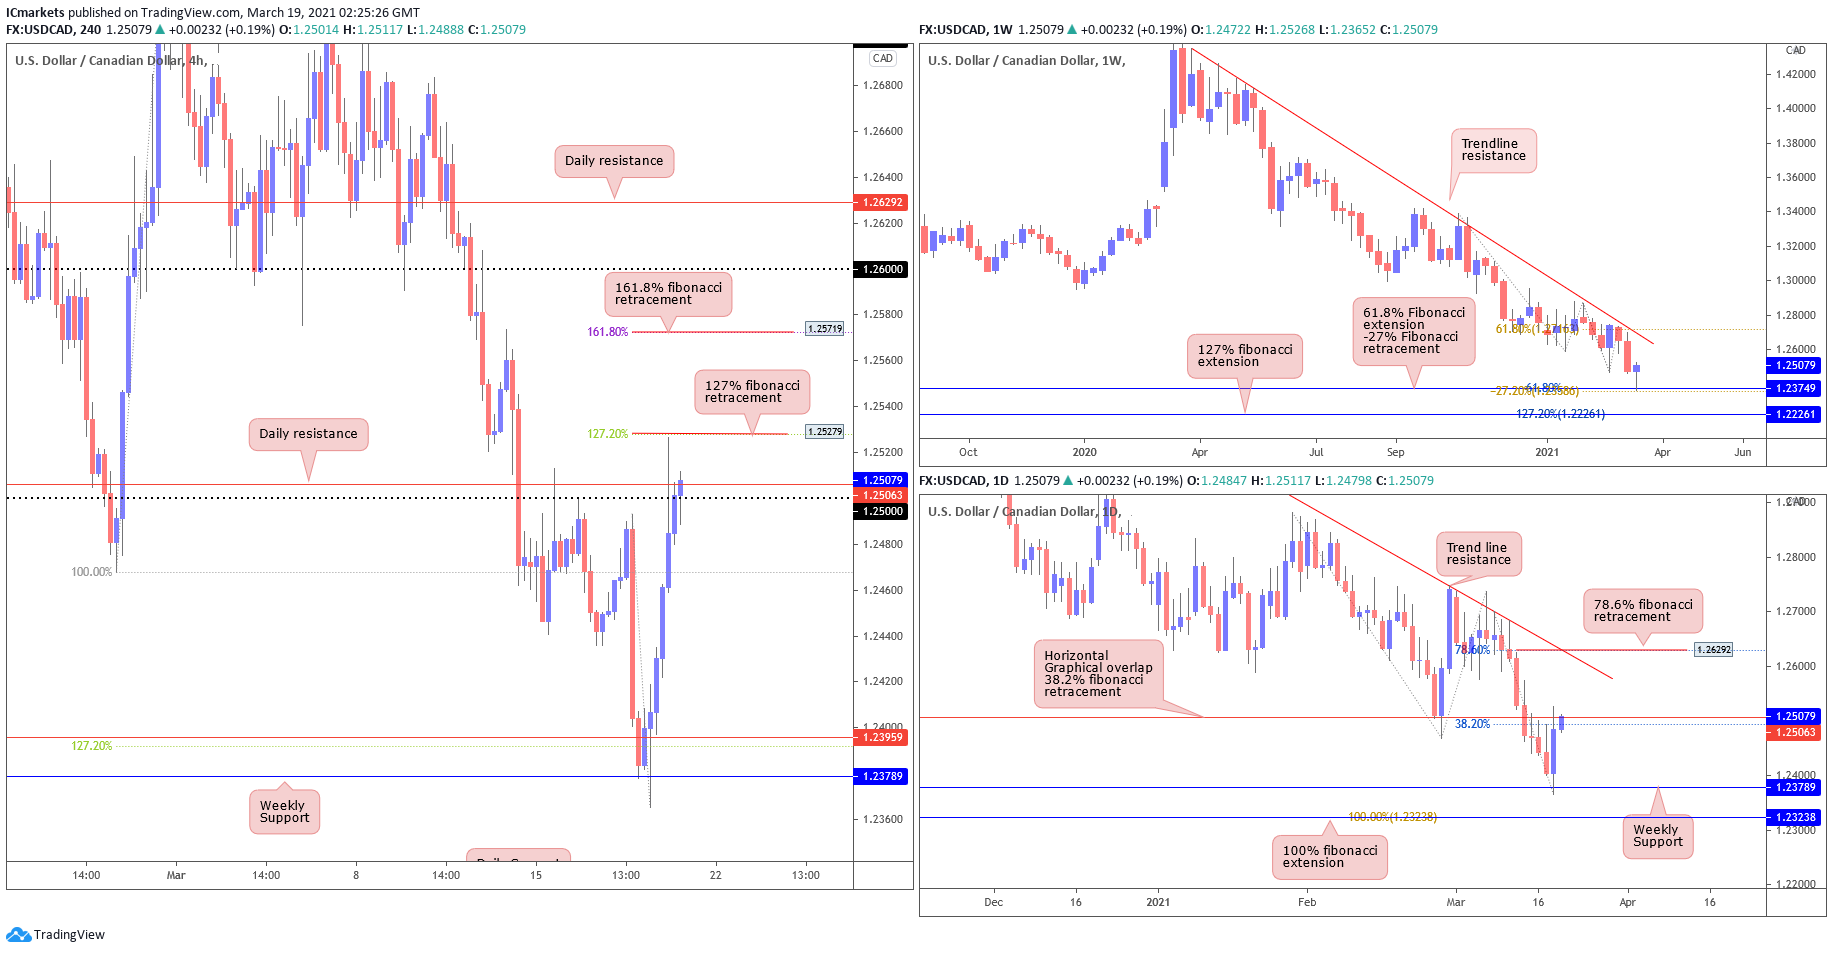
USD/CAD:
Looking at the weekly chart, price has pushed lower and found support at the 1.23749, where the fibonacci confluences are. In the daily time frame, we see a pull back from the recent bearish move after tapping on the weekly support level at 1.23789. Price has currently returned to the previous horizontal graphical overlap at 1.25034, in line with 38.2% fibonacci retracement level. If price manages to break above this level, we may see a continuation of this short term bullish momentum towards 1.26292, in line with 78.6% fibonacci retracement. Lastly, on H4, price has shown a strong bullish move towards the 1.25 major figure and is currently testing the Daily resistance. If price manages to break above this level we may see a further push towardss
Areas of consideration:
- H4 may pull-back towards 1.24136 before dropping towards 1.23238.
- Daily and weekly time frames are both showing bearish momentum.
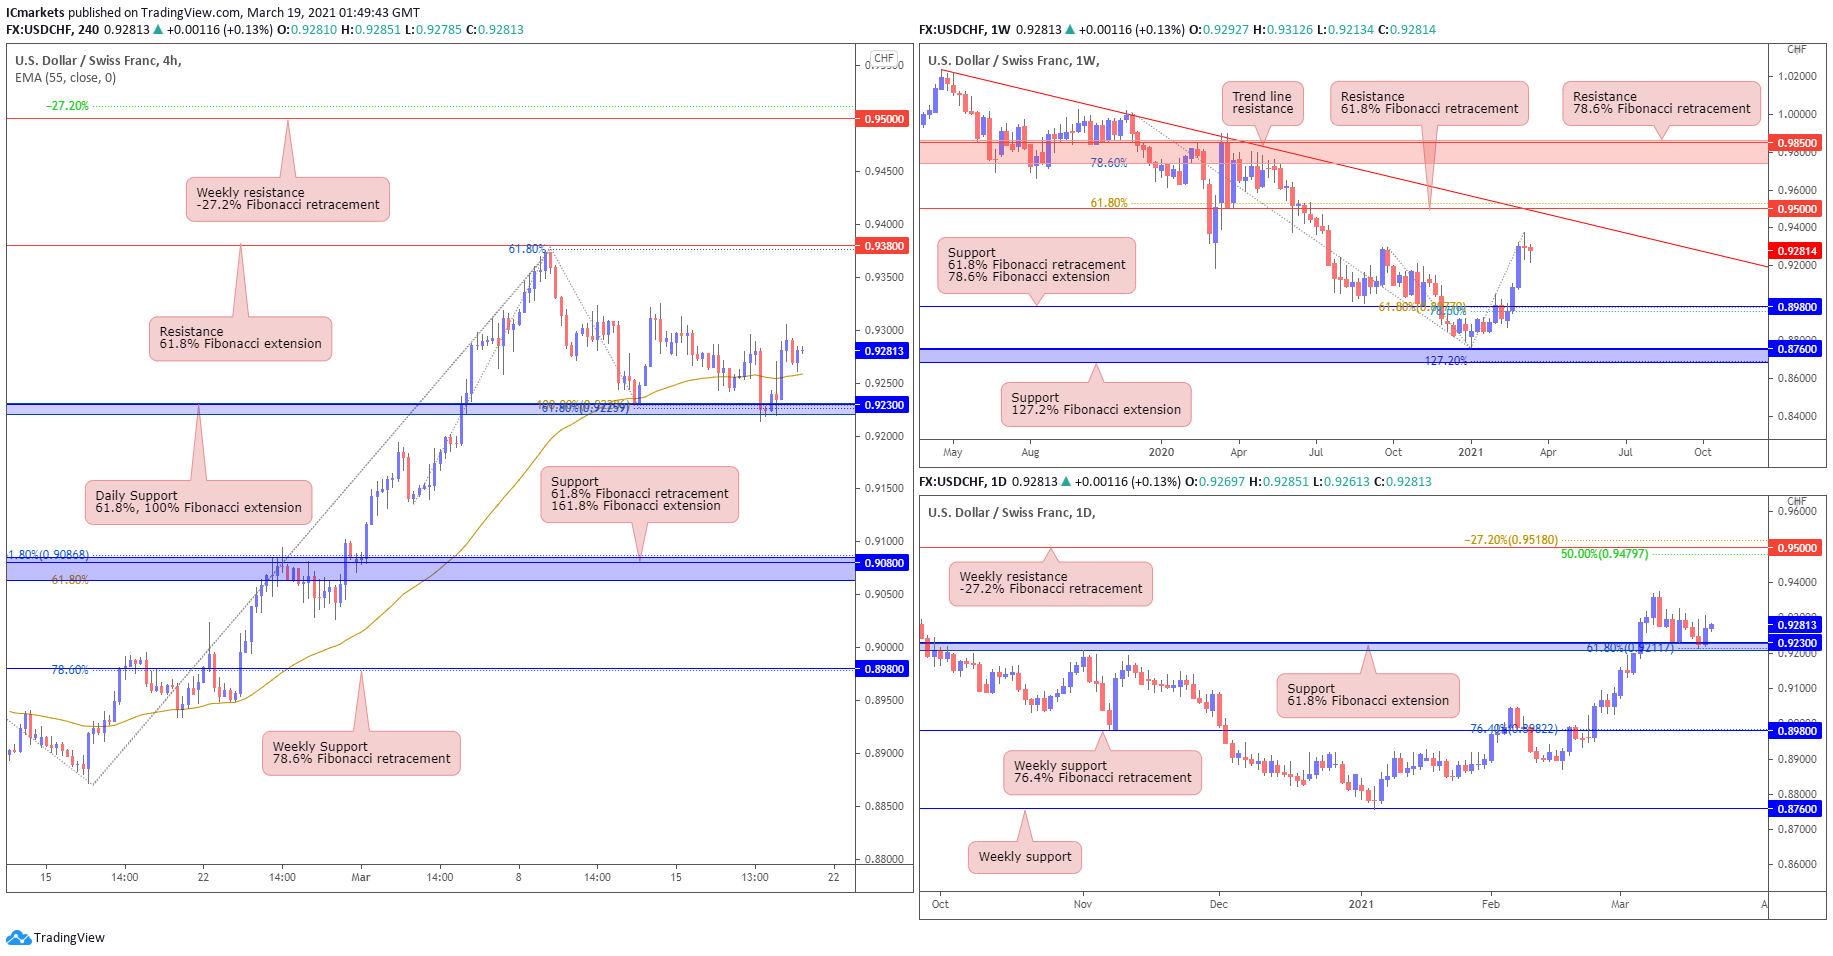
USD/CHF:
USD/CHF is showing indecision on the weekly chart as it continues to approach the descending trendline and weekly 0.95000 resistance level, in line with our 61.8% Fibonacci retracement. On the daily chart, we see that price has just bounced from the 0.92300 support level, which is in line with our 61.8% Fibonacci extension. We could continue to see price rise and test the weekly 0.95000 resistance level.
On the H4 chart, we can see that price has bounced from the daily 0.92300 support level, which is also in line with our 61.8% and 100% Fibonacci extension levels. We note that price is now holding above the moving average support, in line with our analysis. In this scenario, we can potentially see price making a further rise up to test our 0.93800 resistance level, which is in line with our 61.8% Fibonacci extension. Otherwise, should price fail to hold above the 0.92300 key support level, we could potentially see price swing towards the next support level at 0.90800 level instead, in line with our 61.8% Fibonacci retracement and 161.8% Fibonacci extension.
Areas of consideration:
- 92300 support is an important level to watch on the H4 timeframe.
- Price could bounce and push higher to test the 0.93800 resistance level.
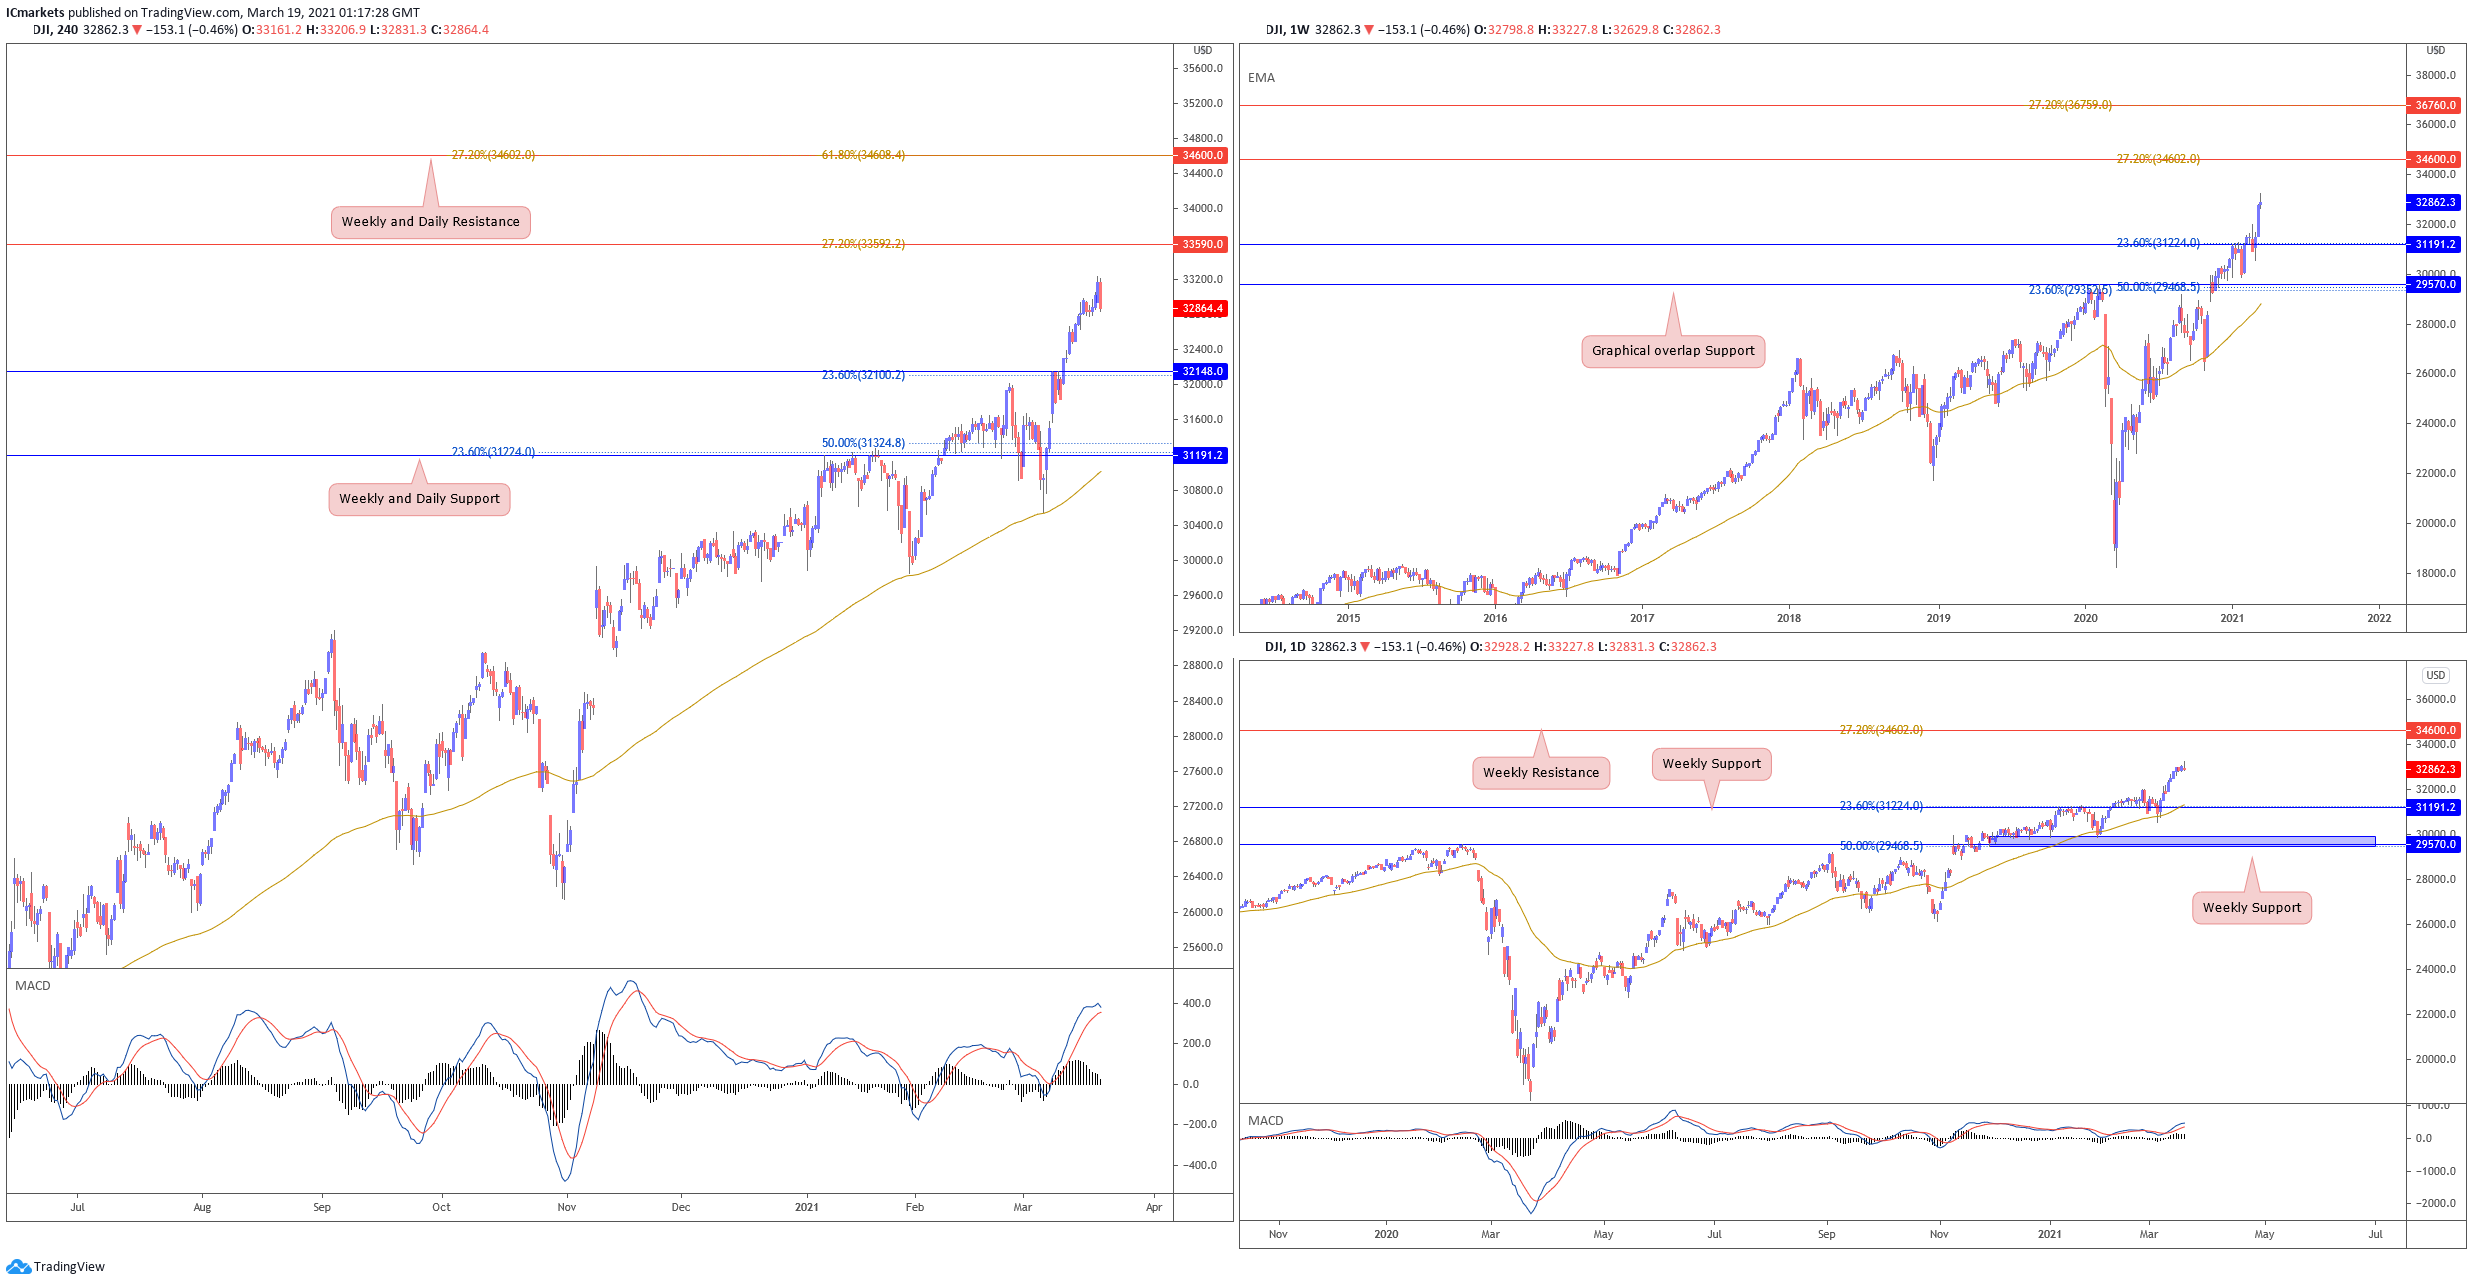
Dow Jones Industrial Average:
On the weekly chart, price pushed higher surpassing previous resistance and making new highs. A further push higher towards resistance at 34600 could be possible as long as price holds above 31190 support. On the Daily, technical indicators continue to show room for further bullish momentum. Buyers could possibly look to add to their longs on any price pullbacks with possible target at 34600 weekly resistance. Otherwise, failure to hold above 31190 could see price pull back towards weekly support at 29570.
On the H4, price pulled back last night but is still holding between 33590 resistance and 32148 support. We note that moving average support and MACD indicator still shows room for further bullish upside. A limited intraday push up above 32148 support towards 33590 resistance could be possible. Otherwise, failure to hold above 32148 support could see price pullback towards 31190 weekly support.
Areas of consideration:
- Technical indicators on daily and H4 confirms room for further upside.
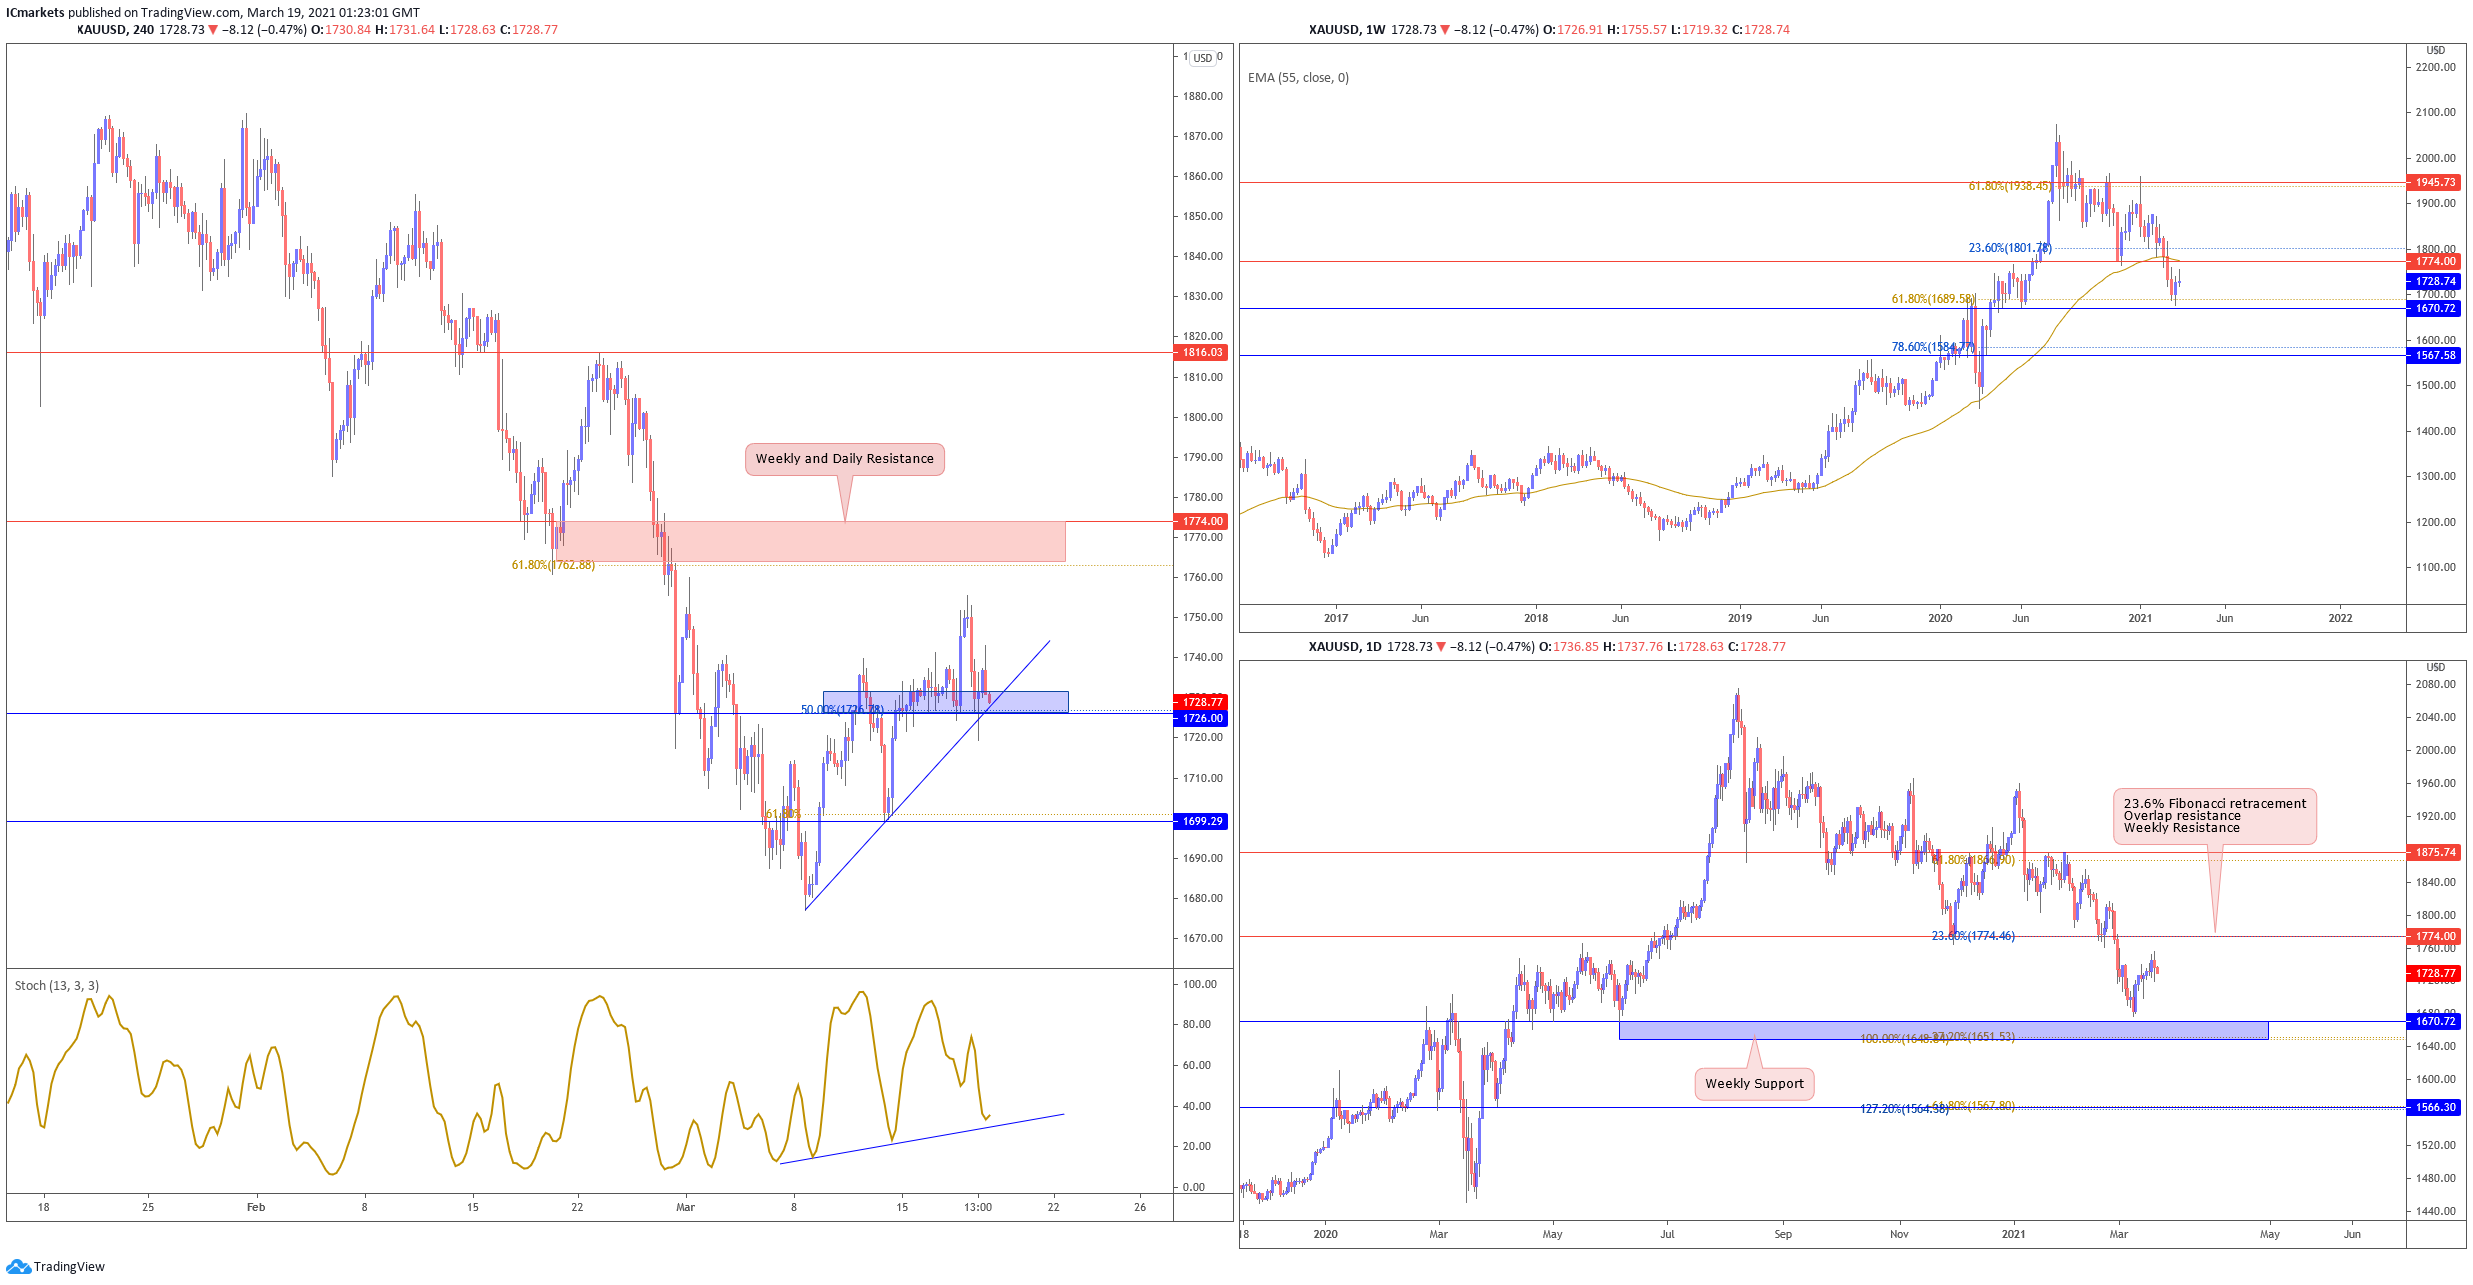
XAU/USD (GOLD):
On the weekly timeframe, gold is currently holding between 1774 resistance and 1670 support. Long term traders should continue to watch these two levels as a break of either will see price swing in that direction. However we note that price is still holding below the long term moving average. On the daily chart, we see price coming close to 1774 resistance. A limited push up to test 1774 resistance could be likely. As long as 1774 resistance is not broken, sellers can watch for opportunities to sell on further rise.
On the 4H timeframe price pulled back lower and is currently testing ascending trendline support at the 1726 support level. With stochastics indicator on ascending support where price reacted in the past, a further push up towards weekly and daily resistance at 1774 could be possible. Otherwise, failure to hold above 1726 support could see price drop deeper towards 1699 level
Areas of consideration:
- Watch 1726 support on the H4
The accuracy, completeness and timeliness of the information contained on this site cannot be guaranteed. IC Markets does not warranty, guarantee or make any representations, or assume any liability regarding financial results based on the use of the information in the site.
News, views, opinions, recommendations and other information obtained from sources outside of www.icmarkets.com.au, used in this site are believed to be reliable, but we cannot guarantee their accuracy or completeness. All such information is subject to change at any time without notice. IC Markets assumes no responsibility for the content of any linked site.
The fact that such links may exist does not indicate approval or endorsement of any material contained on any linked site. IC Markets is not liable for any harm caused by the transmission, through accessing the services or information on this site, of a computer virus, or other computer code or programming device that might be used to access, delete, damage, disable, disrupt or otherwise impede in any manner, the operation of the site or of any user’s software, hardware, data or property.


