
Key risk events today:
Australia Retail Sales m/m; UK Retail Sales m/m; EU Economic Summit; Canada Core Retail Sales m/m and Retail Sales m/m; Fed Chair Powell Speaks.
(Previous analysis as well as outside sources – italics).
EUR/USD:
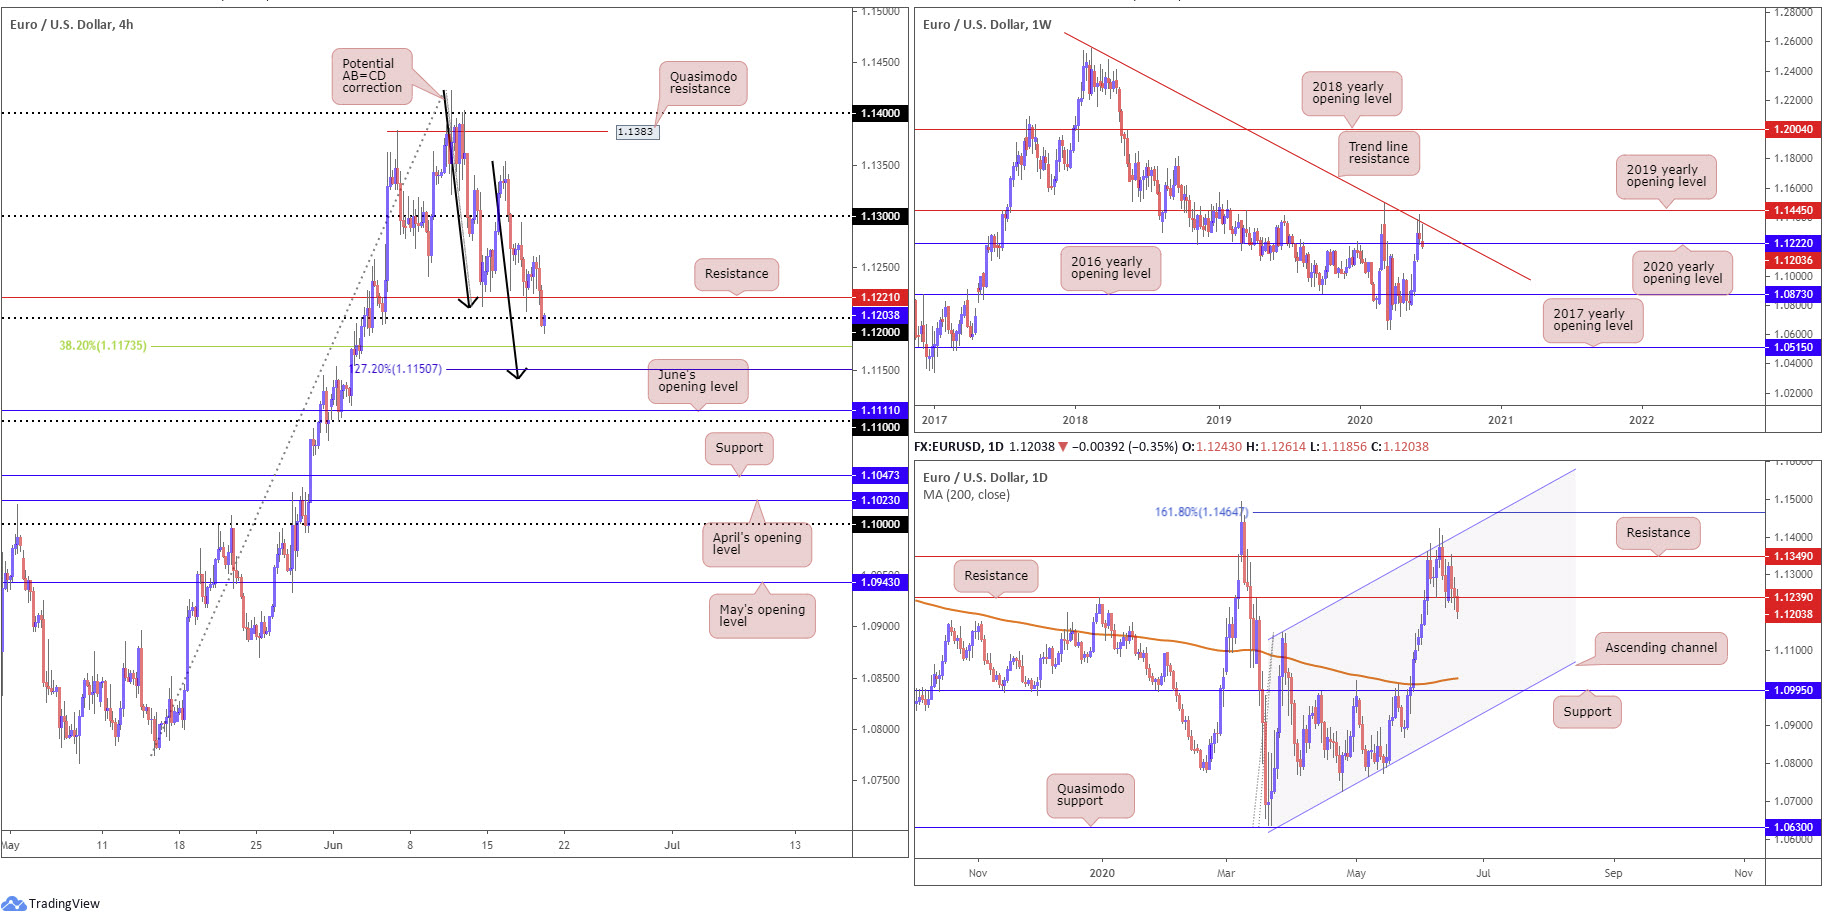
Driven by USD strength Thursday, with the US dollar index recently shaking hands with 97.50, EUR/USD tackled H4 support at 1.1221 and the round number 1.12. This exposed a 38.2% Fibonacci retracement ratio at 1.1173 and a potential 127.2% AB=CD correction (black arrows) at 1.1150. As of current price, we are retesting the underside of the 1.12 which could put through resistance.
Meanwhile, price action on the weekly timeframe is seen attempting to nudge through the 2020 yearly opening level from 1.1222 after fading long-standing trend line resistance, extended from the high 1.2555. Beneath 1.1222, the 2016 yearly opening level at 1.0873 is noted as support. In view of the long-term trend, the pair has also remained under pressure since topping in early February 2018.
The story on the daily timeframe has price action exploring waters under support at 1.1239 (now a serving resistance), after recording its third consecutive decline. A break of this support is significant, perhaps exposing downside to the 200-day SMA (orange – 1.1025), which is on the point of turning higher after drifting south for several months.
Areas of consideration:
For those who read Thursday’s technical briefing you may recall the following (italics):
The combination of H4 support at 1.1221, the round number 1.12 and 38.2% Fibonacci retracement ratio at 1.1173 offers a frame to base some form of support today. This area also benefits from weekly convergence at 1.1222.
As evident from the H4 chart, we are currently testing 1.1173/1.1221. From this point, buyers will be watching for signs of bullish intent via candlestick analysis. Alternatively, a H4 close above H4 resistance at 1.1221 may suffice. However, the odds of 1.1173/1.1221 holding has decreased given breakout sellers potentially in motion under daily support mentioned above at 1.1239.
Dipping lower to the H4 AB=CD pattern at 1.1150 may also be on the cards, though at this point daily breakout sellers will be in full swing.
GBP/USD:
Thursday had the Bank of England (BoE) stand pat on interest rates at a record low of 0.1%, and promise to add another £100b in QE.
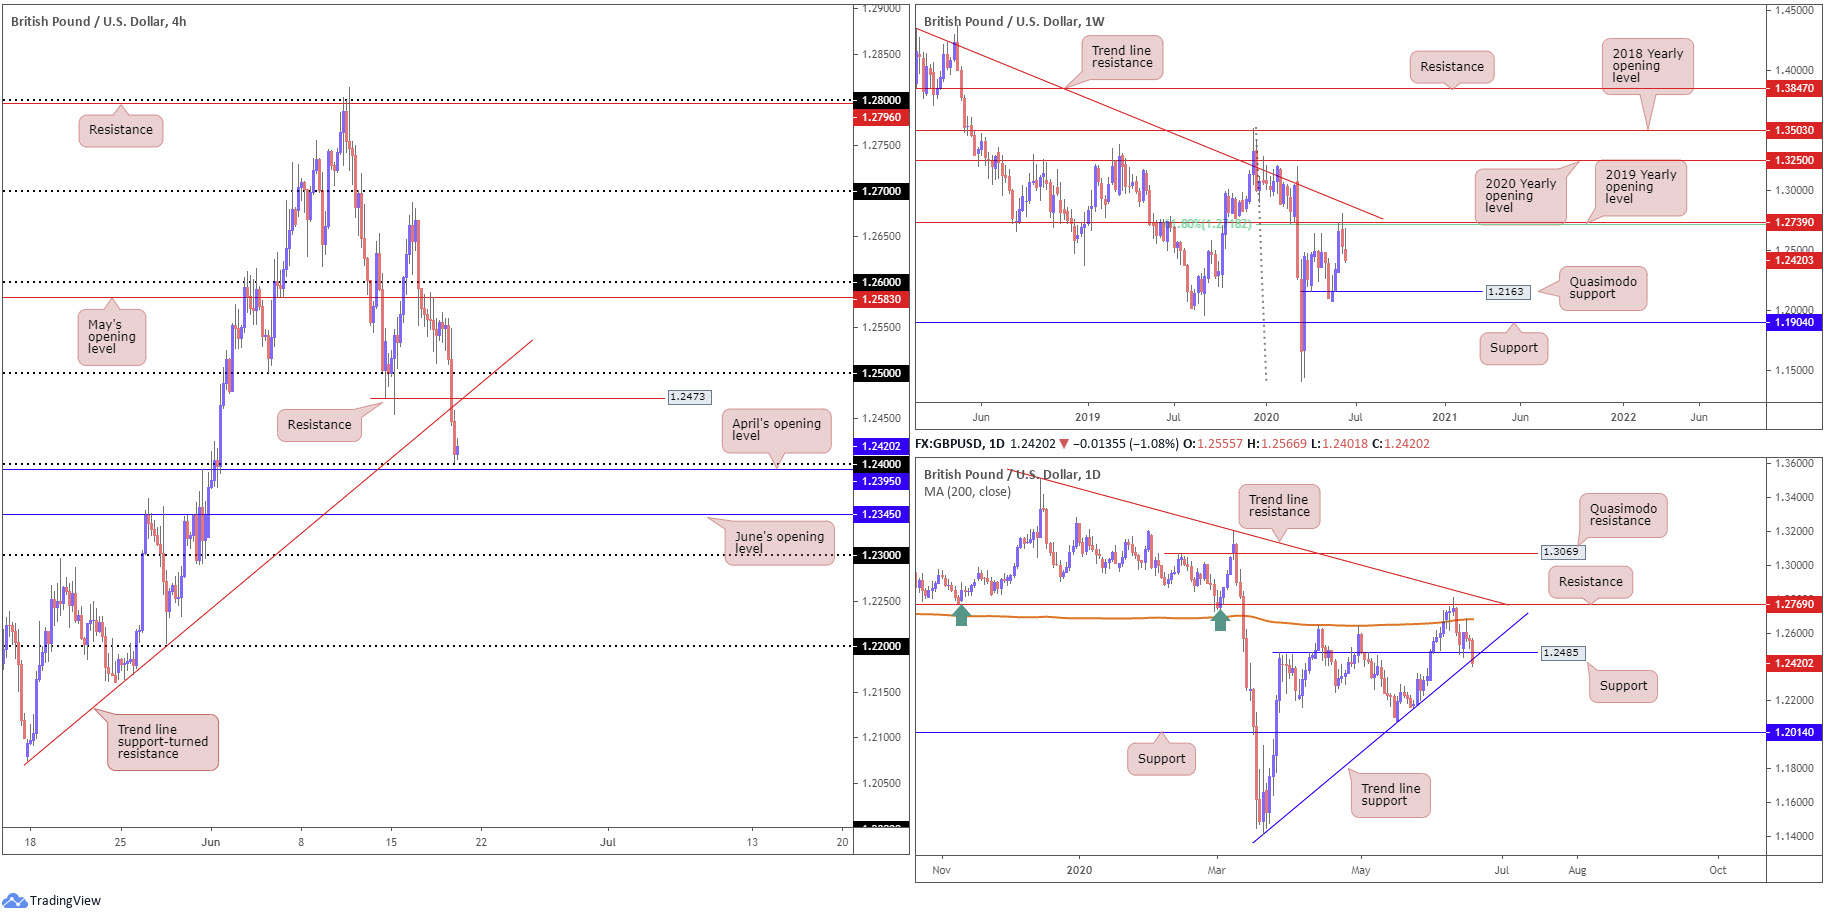
After a fleeting pop to highs at 1.2549, a move that rushed 1.25 to the upside, GBP/USD came under pressure and wrapped up the day 1% lower. H4 brushed aside 1.25, Quasimodo support at 1.2473 and trend line support, taken from the low 1.2075. In recent hours, the pair tentatively put in a bottom ahead of 1.24 and April’s opening level at 1.2395. Below here, traders will be tracking June’s opening level at 1.2345.
Further afield on the weekly timeframe has price action extending losses south of the 61.8% Fibonacci retracement ratio at 1.2718 and 2019 yearly opening level at 1.2739. It should also be emphasised these levels are positioned beneath a long-term trend line resistance, extended from the high 1.5930. Increased selling from here, in line with the overall trend, throws Quasimodo support at 1.2163 in the pot as a feasible downside target on this timeframe.
Elsewhere on the daily timeframe, after a fleeting rebound off support at 1.2485 and brief encounter with the 200-day SMA (orange – 1.2682), price is tunnelling into new terrain sub 1.2485 and trend line support (1.1409). A decisive close lower here could signal we’re heading for weekly Quasimodo support mentioned above at 1.2163.
Areas of consideration:
According to the technical picture, the pendulum appears to be swinging in favour of further downside. Both weekly and daily timeframes favour exploring deeper waters, consequently questioning 1.24 and April’s opening level at 1.2395 as support on the H4.
H4 price closing below 1.24, therefore, gives rise to bearish themes today, targeting June’s opening level at 1.2345 as an initial take-profit base.
AUD/USD:
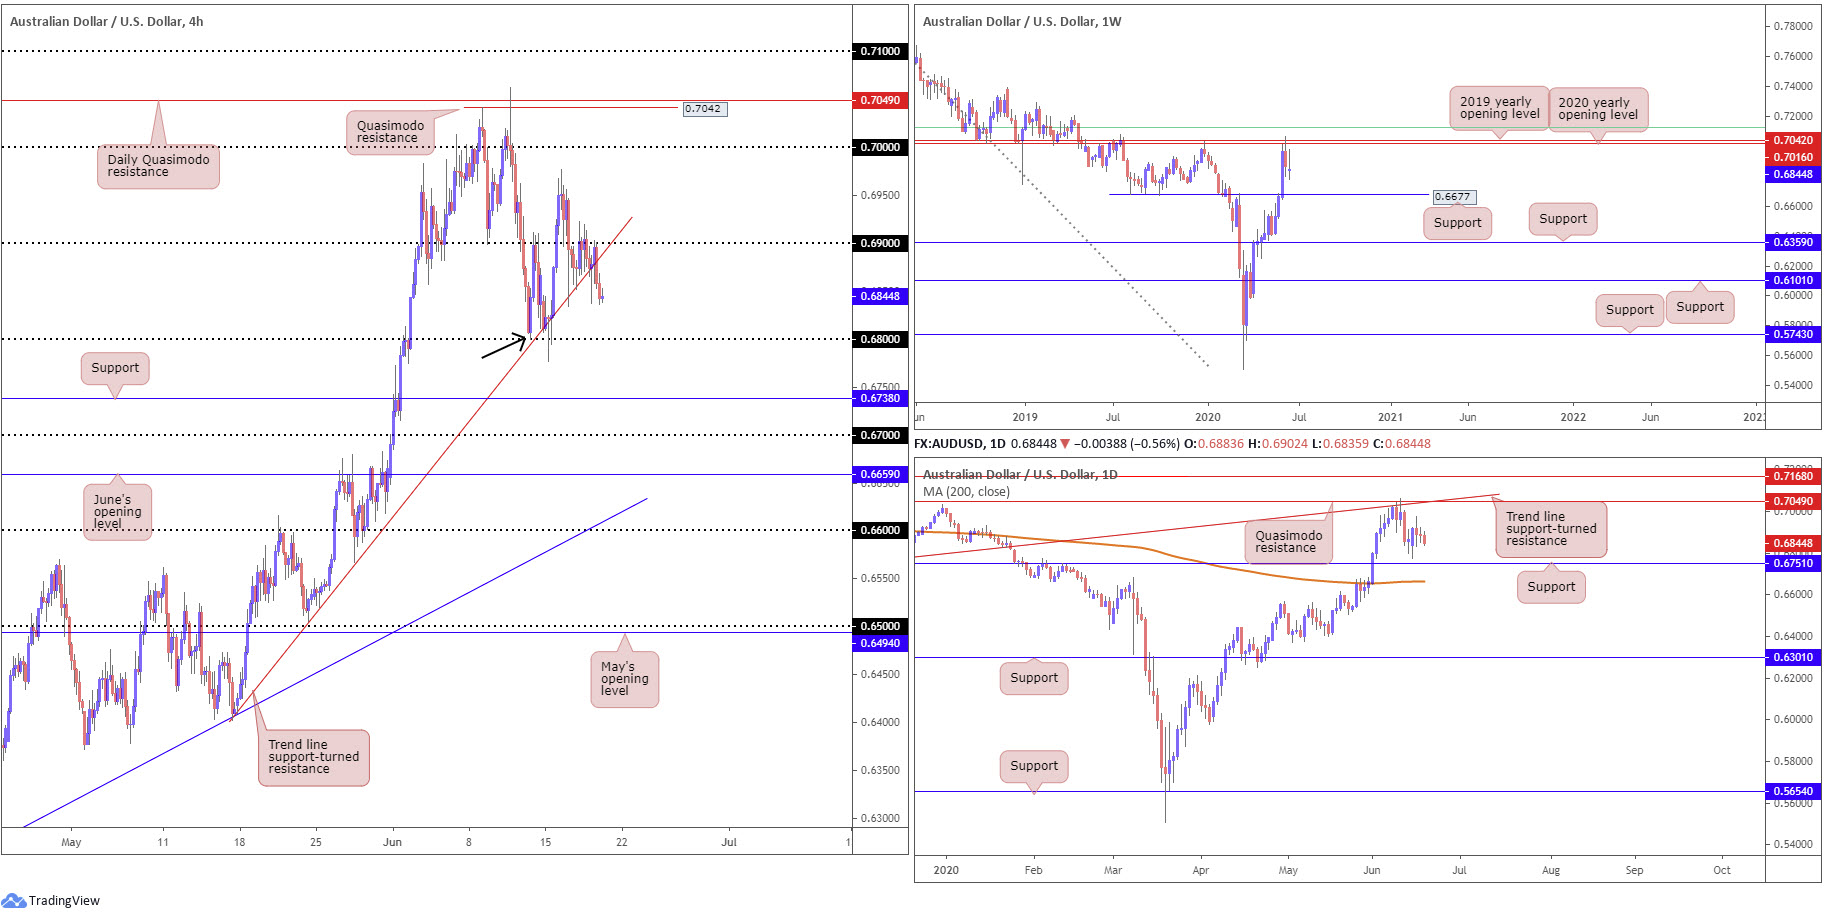
Try as it might, intraday movement failed to muster enough strength to breach 0.69 to the upside. Thursday brought with it a H4 close below trend line support (0.6409), moving 0.68 in view as the next support target. It should be noted 0.68 also forms a local Quasimodo support (black). Breaching 0.68 shines the spotlight on H4 support coming in at 0.6738, with a break uncovering 0.67.
Resistance, forged in the shape of the 2020 yearly opening level and the 2019 yearly opening level at 0.7016 and 0.7042, respectively, challenged buyers on the weekly timeframe in recent movement. It might also interest traders to note that just above the said resistances we have a 61.8% Fibonacci retracement ratio stationed at 0.7128 (green). While we cannot rule out the possibility of upside attempts on this timeframe, support could eventually spin into sight at 0.6677.
With respect to technical structure on the daily timeframe, Quasimodo resistance is in view at 0.7049, merging closely with trend line support-turned resistance, taken from the low 0.6670. Attention on this timeframe also remains at support coming in from 0.6751, placed above the 200-day SMA (orange – 0.6664) which appears poised to turn higher.
Areas of consideration:
The break of H4 trend line support suggests a bearish bias to at least 0.68. Though, according to the higher timeframes, elbowing through 0.68 is possible, targeting daily support at 0.6751.
Sellers short the H4 trend line break likely have protective stop-loss orders tucked around 0.6925. Reducing risk to breakeven and taking partial profits at 0.68 is an option, leaving a portion to run for higher-timeframe supports (daily 0.6751 weekly 0.6677).
USD/JPY:
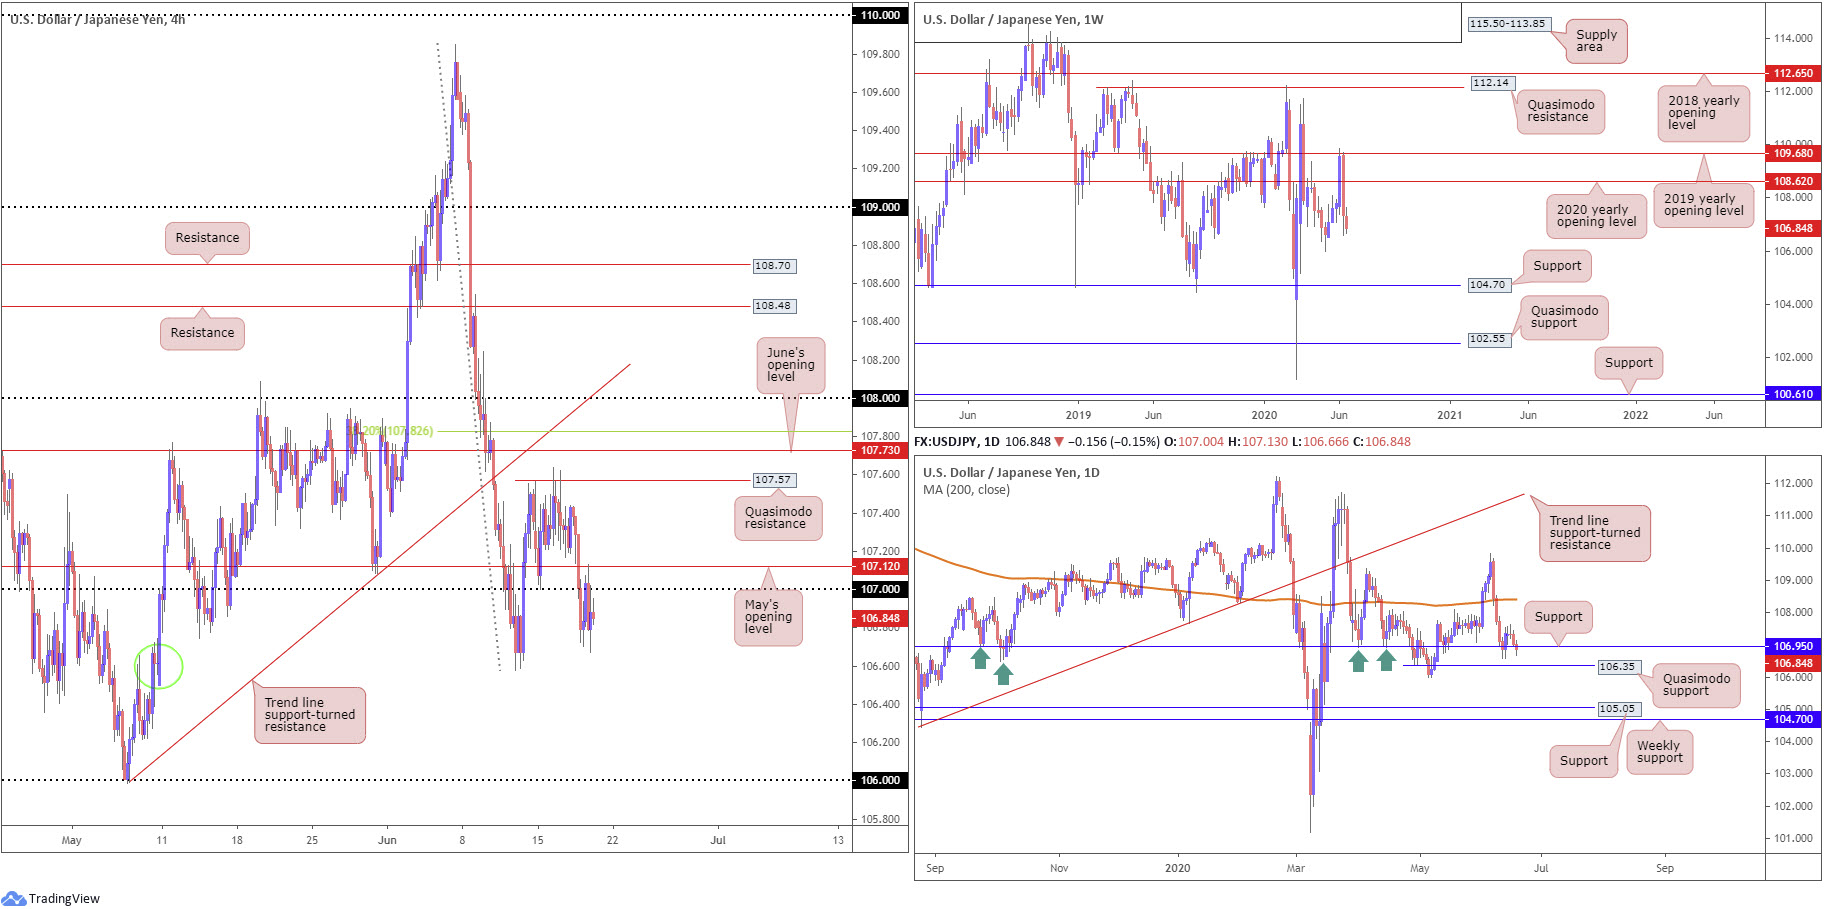
USD/JPY enters Friday stapled to the underside of 107 on the H4 after brushing aside the round number in early trade Thursday. May’s opening level at 107.12 also made an appearance yesterday, holding firm as resistance. Slipping lower from this point has demand (green circle) to contend with around 106.60, with further selling underlining the 106 handle.
From the weekly timeframe, after firmly rejecting the 2019 yearly opening level at 109.68 and cruising through the 2020 yearly opening level at 108.62, this shifts focus to the 105.98 6th May low as the next downside target on this scale.
Contrary to the weekly timeframe’s position, price action on the daily timeframe is testing the mettle of support at 106.95. Daily Quasimodo support at 106.35 also may welcome an approach today – It might be worth pointing out the 105.98 6th May low underscored on the weekly timeframe forms the low to the aforementioned Quasimodo support.
Areas of consideration:
Sellers appear to be accumulating a position sub 107 at the moment, absorbing bids around 106.70. Weekly price invites a move to 105.98 – essentially the 106 handle, while daily price suggests a potential speed bump at 106.35 (assuming we cross 106.95). H4 demand around 106.60 may also cause problems.
As a result of the above, bearish themes may be something to consider under 107, noting 106.60 and 106.35 as possible hurdles to overcome before crossing swords with 106.
USD/CAD:
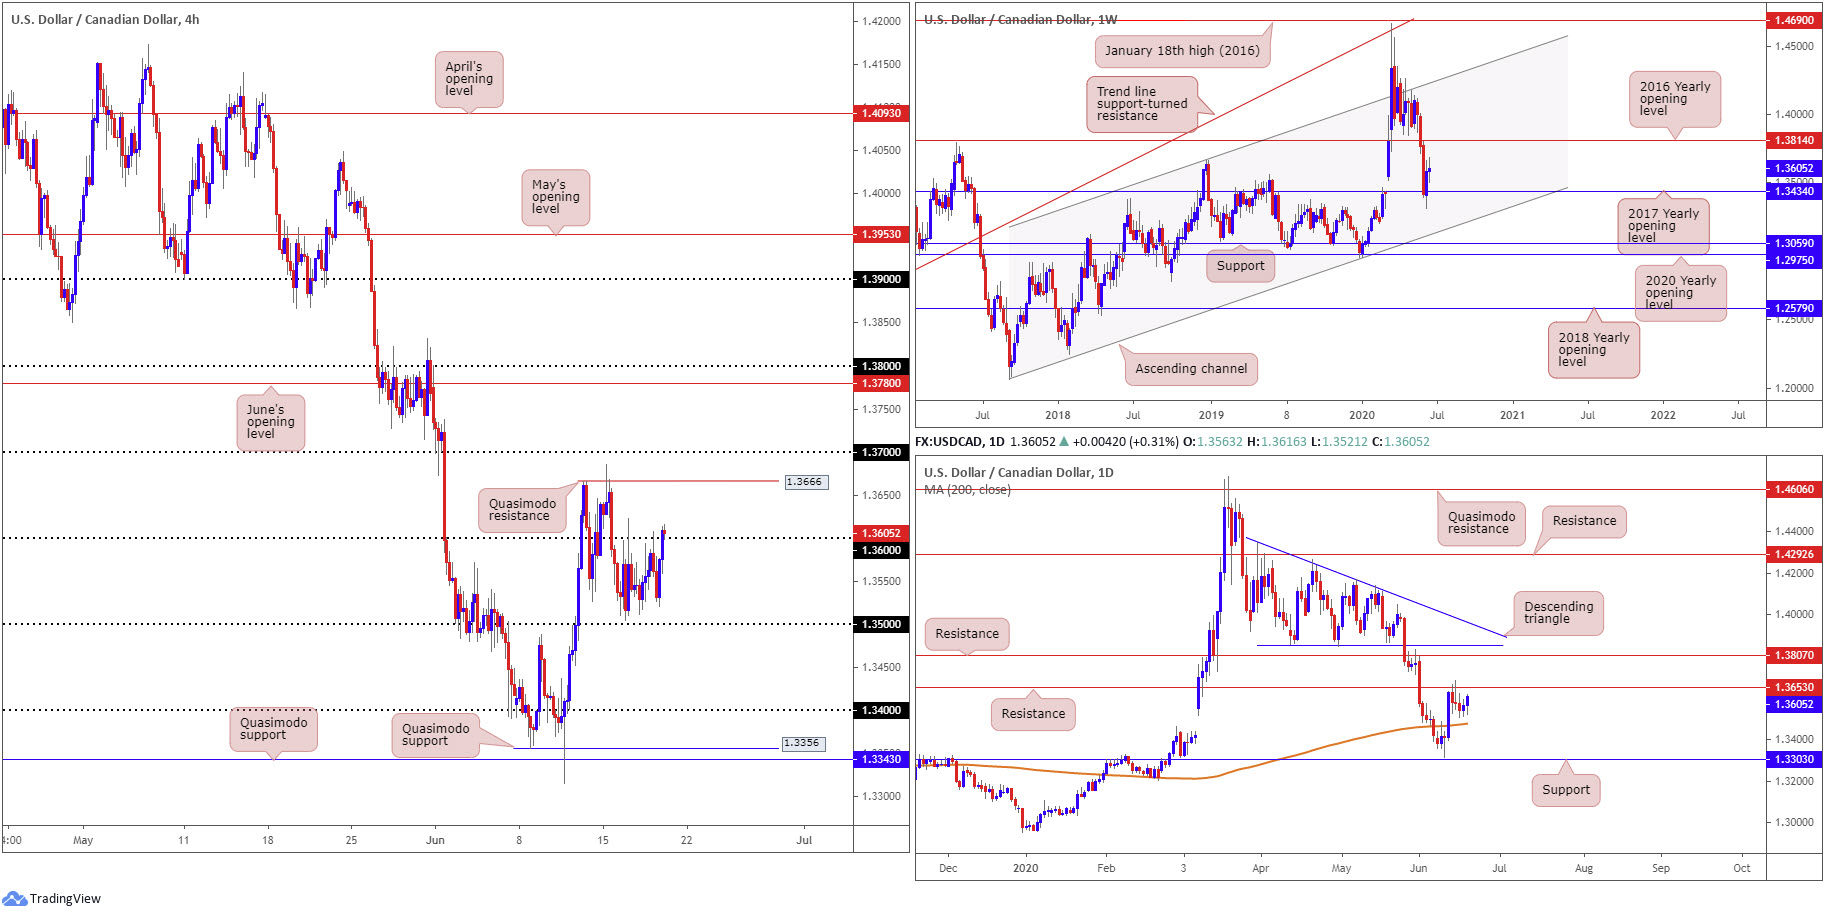
The US dollar ended a shade higher against the Canadian dollar Thursday, deriving impetus from a broad USD bid (DXY rallied to 97.50 recording its third consecutive session higher). In recent hours, traders on the H4 timeframe reassessed resistance in the shape of 1.36, though unlike earlier in the week H4 marginally closed above the round number. This points to Quasimodo resistance at 1.3666 as the next upside hurdle, closely followed by 1.37.
Given weekly price trades pretty much unchanged on the week so far, despite ranging between 1.3686/1.3504, last week’s weekly technical briefing remains valid (italics):
USD/CAD bulls, following three consecutive weeks of losses, went on the offensive last week, drawing impetus from the 2017 yearly opening level at 1.3434. Theoretically, this promotes the possibility of additional bullish sentiment, targeting resistance by way of the 2016 yearly opening level at 1.3814. Clearing 1.3434, on the other hand, places channel support, taken from the low 1.2061, in the limelight.
From the daily timeframe, price continues to mingle under resistance at 1.3653, with price so far incapable of gathering enough steam to bring in the 200-day SMA (orange – 1.3476). Above current resistance, another layer of resistance is visible at 1.3807, whereas a spin lower could have sellers take aim at support coming in from 1.3303.
Areas of consideration:
As highlighted in the weekly analysis, higher-timeframe buyers are unlikely to commit to the weekly timeframe’s push off support at 1.3434 until we crack daily resistance from 1.3653.
For those who read Thursday’s technical briefing you may recall the following piece (italics):
With the H4 candles approaching the underside of 1.36, it’s unlikely this level will offer much more resistance owing to the lack of confluence. Bullish scenarios above the round number could be an option, targeting daily resistance at 1.3653, followed by H4 Quasimodo resistance at 1.3666.
On account of the above, H4 holding off 1.36, preferably in the shape of a H4 or H1 bullish candlestick pattern, might be enough to deliver further upside today.
USD/CHF:
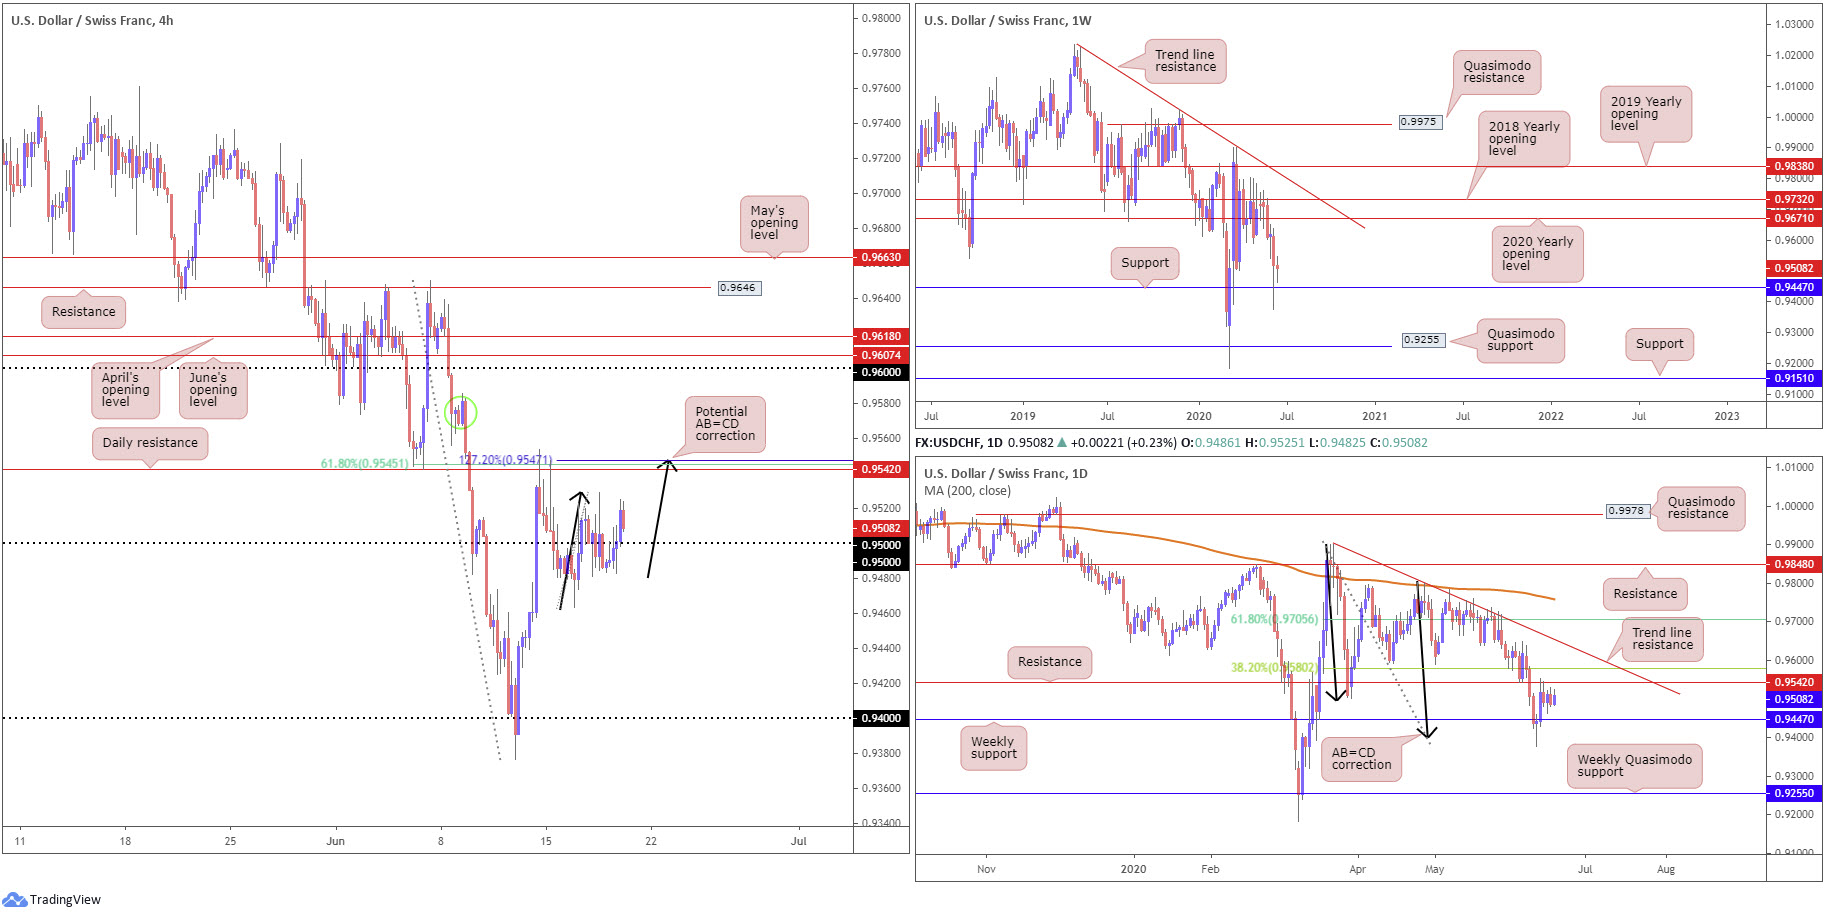
A favourable USD wind elevated USD/CHF Thursday, hauling the H4 candles back above 0.95. Current price action also meets the characteristics of a potential AB=CD bearish pattern (black arrows) that joins nearby daily resistance at 0.9542, as well as a 61.8% H4 Fibonacci retracement ratio at 0.9545 and a 127.2% Fibonacci extension at 0.9547.
While H4 suggests a bounce lower from daily resistance, the daily timeframe indicates a possible move higher (italics):
The break of weekly support at 0.9447 threw breakout sellers into a bear trap as daily buyers vigorously defended AB=CD structure (black arrows) at 0.9395. The initial upside target out of the daily AB=CD pattern, traditionally speaking, can be found at the 38.2% Fibonacci retracement ratio at 0.9580 (derived from legs A-D), positioned above resistance plotted at 0.9542. It is possible, according to traditional measures, the final AB=CD target might also be met at 0.9705, the 61.8% Fibonacci retracement ratio from legs A-D. This implies a push above trend line resistance, taken from the high 0.9901.
Areas of consideration:
Executing trades around 0.95 remains precarious, owing to the lack of clear support/resistance offered in recent action.
In view of the AB=CD H4 confluence circling daily resistance at 0.9542, a bounce lower could occur, targeting the 38.2% Fibonacci retracement ratio derived from legs A-D.
According to the AB=CD daily take-profit projections we may eventually head above the noted daily resistance (0.9542) for 0.9580ish, perhaps enough to draw in bearish themes off 0.9618/0.96 (April and June’s opening levels and the round number 0.96) on the H4 before heading lower. With this being the case, intraday bullish scenarios above current daily resistance, in the event we crack the level, could also be something to watch for.
Dow Jones Industrial Average:
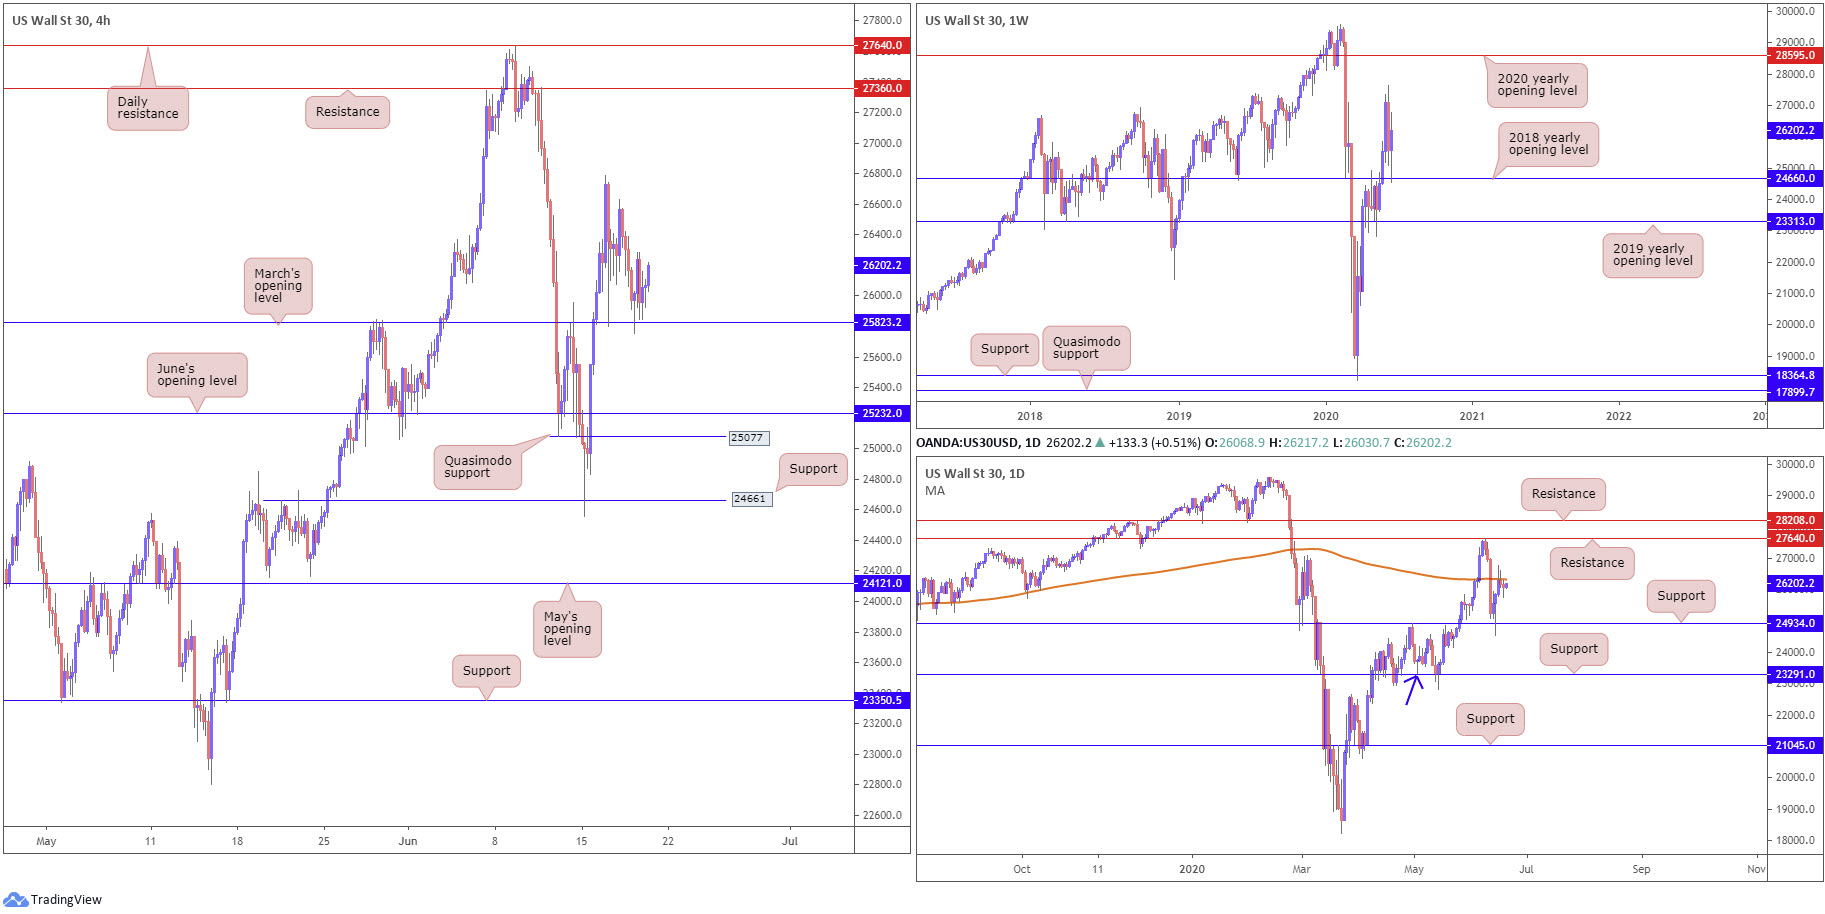
Global equities drifted Thursday as virus flare-ups threatens a recovery. The Dow Jones Industrial Average dipped 39.51 points, or 0.15%; the S&P 500 gained 1.85 points, or 0.06%, and the tech-heavy Nasdaq 100 concluded higher by 29.57 points, or 0.30%.
Traders who read Thursday’s technical briefing may recall the following (italics):
Intraday traders may hone in on March’s opening level at 25823 today in search of supportive structure. Conservative traders will likely seek additional confirmation from this base before engaging, given daily price fading its 200-day SMA (orange – 26334).
25823, as you can see, made an appearance Thursday, holding by way of a hammer candlestick pattern on the H4 timeframe.
Although the 200-day SMA may hinder upside, weekly price supports an advance following this week’s rebound off the 2018 yearly opening level at 24660. Further extension lands flow at the 27638 high, followed by room to bring in the 2020 yearly opening level at 28595.
Areas of consideration:
Well done to traders long from March’s opening level at 25823, based on the H4 hammer candlestick pattern. Getting through the 200-day SMA would likely see buyers reduce risk to breakeven and take partial profits ahead of the weekend.
A H4 close below 25823, however, could take things towards 25232 on the H4. This, combined with H4 Quasimodo support at 25077 and daily support at 24934, not only sends across an ideal take-profit target for shorts under 25823, it provides a stage to consider bullish themes from.
XAU/USD (GOLD):
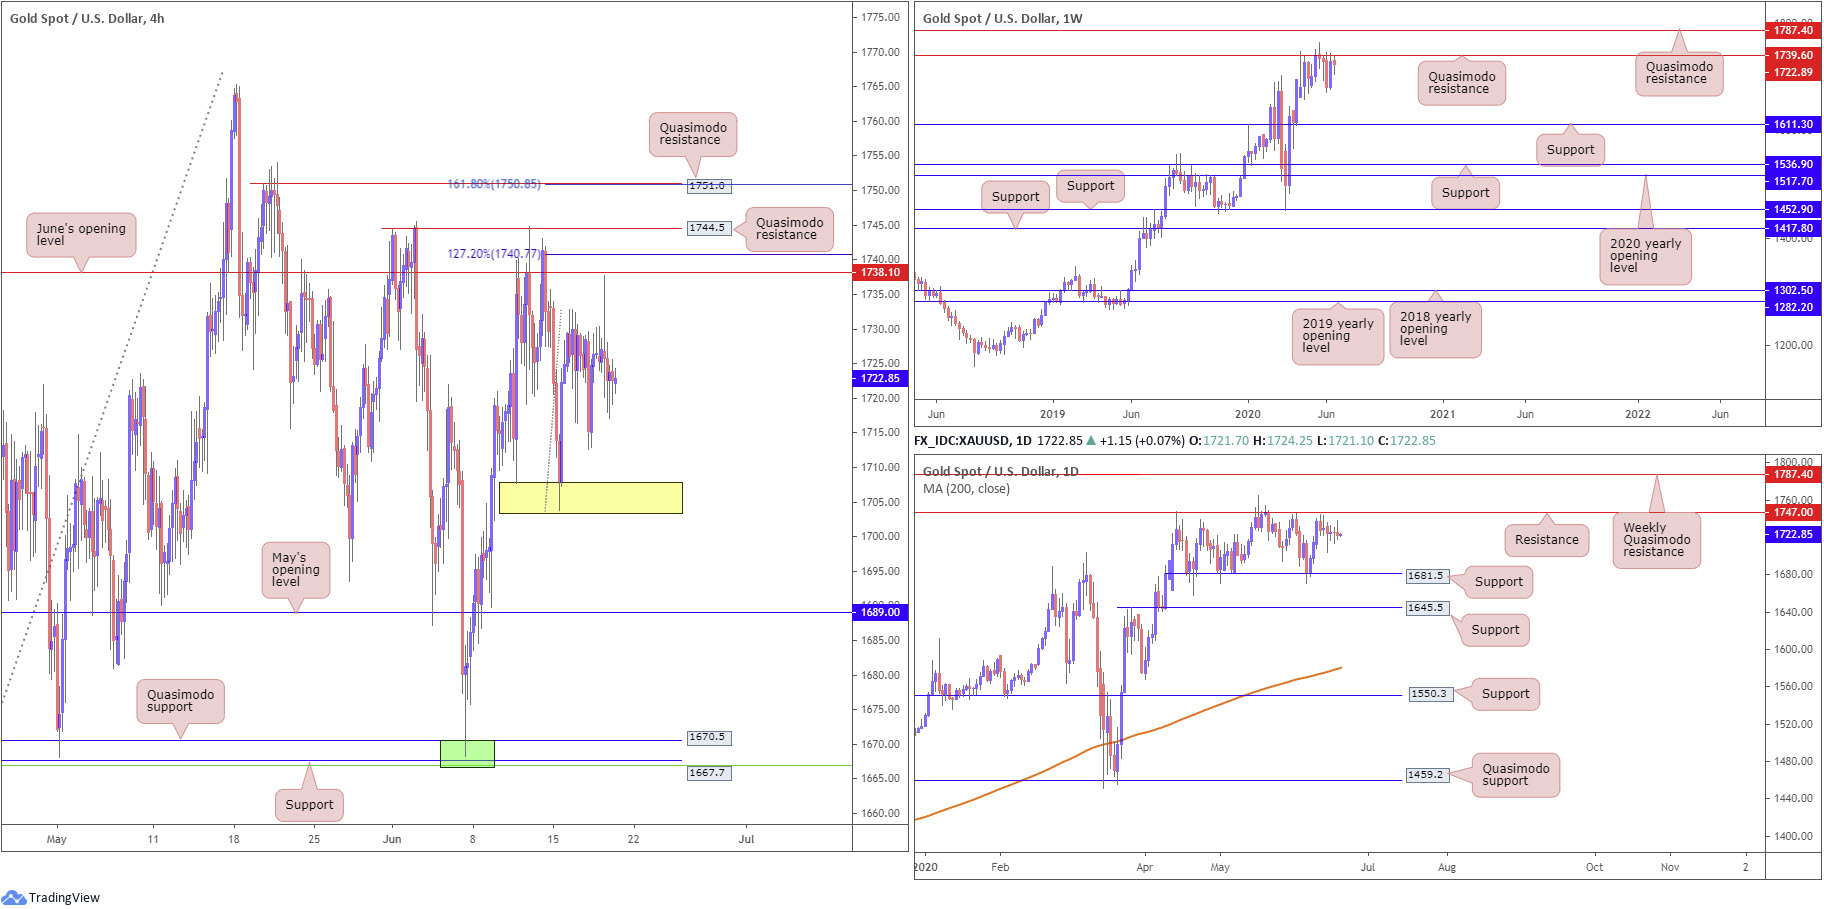
Despite ranging between 1737.7/1717.4, XAU/USD concluded pretty much unchanged Thursday. Notably, though, H4 did make an attempt to bring in June’s opening level at 1738.1, but fell short at 1737.7 before retreating.
Since the H4 candles shook hands with Quasimodo resistance at 1744.5 and June’s opening level mentioned above at 1738.1, price action has emphasised a somewhat directionless state, unable to break local support at 1703.4/1707.8 (yellow).
Price movement from the weekly timeframe, as highlighted in Monday’s technical briefing, has had buyers and sellers fighting for position below Quasimodo resistance at 1739.6 since mid-April, sited under another layer of Quasimodo resistance at 1787.4. A decisive turn lower from current price moves support at 1611.3 into view.
A closer reading of price action on the daily timeframe reveals candles remain entrenched within a range between resistance at 1747.0 and support pencilled in at 1681.5. A breakout to the downside shines the spotlight on support at 1645.5; turning higher, however, highlights the weekly Quasimodo resistance at 1787.4. As of current price, we are seeing the candles hovering, indecisively, within the upper portion of the said range.
Areas of consideration:
Although the trend has faced north since 2016, all the while weekly Quasimodo resistance remains intact this will likely deter prospective buyers.
A possible setup for sellers on the H4 timeframe (also noted in Thursday’s technical briefing) is a pop above June’s opening level at 1738.1 to Quasimodo resistance at 1744.5. Nearby we can also see additional resistance in the shape of a 127.2% Fibonacci extension point nearby at 1740.7. However, there is also a possibility we could whipsaw through 1744.5 for H4 Quasimodo resistance at 1751.0, converging with a 161.8% Fibonacci extension from 1750.8. Breaking above 1744.5 also draws in sellers from daily resistance at 1747.0.
The accuracy, completeness and timeliness of the information contained on this site cannot be guaranteed. IC Markets does not warranty, guarantee or make any representations, or assume any liability regarding financial results based on the use of the information in the site.
News, views, opinions, recommendations and other information obtained from sources outside of www.icmarkets.com.au, used in this site are believed to be reliable, but we cannot guarantee their accuracy or completeness. All such information is subject to change at any time without notice. IC Markets assumes no responsibility for the content of any linked site.
The fact that such links may exist does not indicate approval or endorsement of any material contained on any linked site. IC Markets is not liable for any harm caused by the transmission, through accessing the services or information on this site, of a computer virus, or other computer code or programming device that might be used to access, delete, damage, disable, disrupt or otherwise impede in any manner, the operation of the site or of any user’s software, hardware, data or property.


