
EUR/USD:
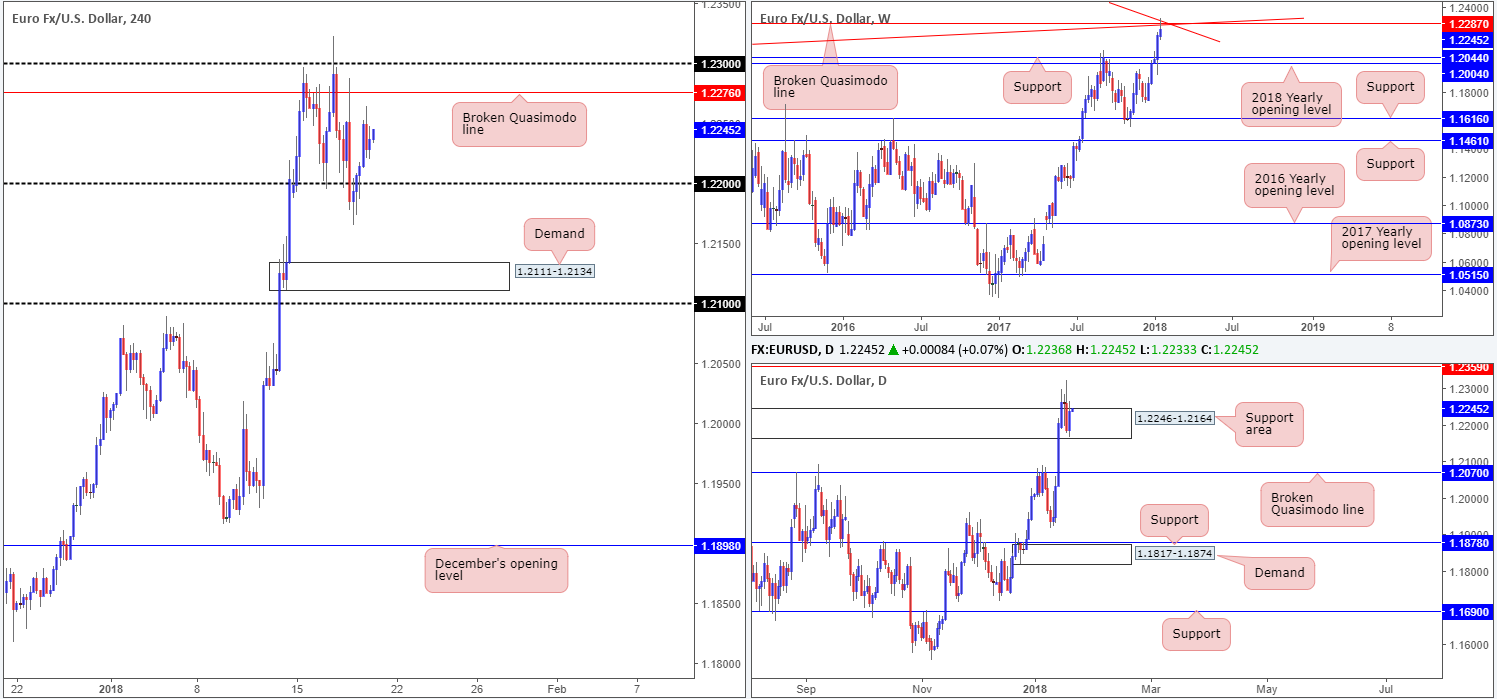
After puncturing the 1.22 handle seen on the H4 timeframe, the EUR/USD clocked a weekly low of 1.2165. It was from here, the lower limits of a daily support area at 1.2246-1.2164, did we see the unit reclaim 1.22 and push higher yesterday.
The US dollar index was unable to extend gains on Thursday, which, as we know, is EUR/USD supportive. In addition to this, US economic data offered little support. Housing starts came in lower than expected, as did the Philly Fed manufacturing index. Initial jobless claims, however, did better expectations at 220K vs. EXP: 250K.
Although upside appears to be favored, given the trend the euro is entrenched within right now, let’s remain mindful to the fact that there is key weekly resistance also in the fray: a weekly broken Quasimodo line at 1.2287 that merges with two weekly trendline resistances (1.1641/1.6038). Add this to a H4 broken Quasimodo line at 1.2276, followed closely by the 1.23 handle, we can see that there is still ample resistance in sight.
Market direction:
In the event that 1.23 is breached, we believe that the unit may push for a test of a daily broken Quasimodo line at 1.2359.
With buyers possibly weakened around 1.22 from the recent whipsaw, traders may attempt to reclaim this number and approach H4 demand located at 1.2111-1.2134.
Given the above factors, our bias is somewhat neutral for the time being. On the one hand, the uptrend remains intact, thus bolstering the buy side, and on the other hand, we have a strong weekly resistance which has so far been respected.
Data points to consider: US prelim UoM consumer sentiment at 3pm, followed by FOMC member Quarles speaking at 5.15pm GMT.
Areas worthy of attention:
Supports: 1.2111-1.2134; 1.2246-1.2164; 1.22 handle.
Resistances: 1.2287; weekly trendline resistances; 1.2276; 1.23 handle; 1.2359.
GBP/USD:
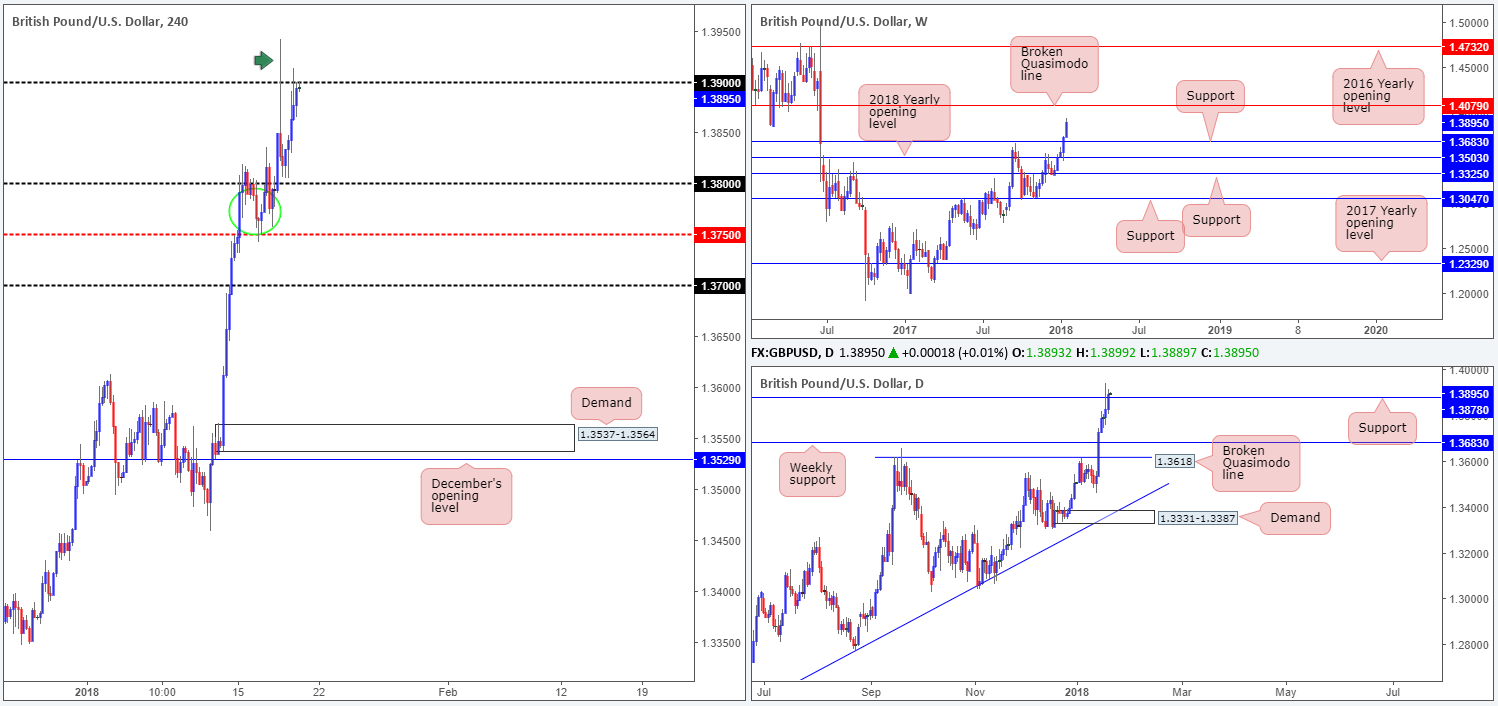
The British pound is on course to register its fifth consecutive weekly gain. According to the weekly timeframe, the next upside target can be clearly seen at 1.4079: a weekly broken Quasimodo line.
Possibly adding additional strength to weekly buying, daily action also recently crossed above a daily resistance at 1.3878. This, in our book, signals further upside could be on the cards today/next week.
Before higher prices are possible, however, H4 movement will need to chew through the 1.39 handle, which provided resistance amid yesterday’s US segment. The long H4 wick printed on Wednesday marked with a green arrow at 1.3942 has potentially wiped out the majority of sellers around 1.39 and trapped a truckload of breakout buyers, thus, in theory, this should be a relatively easy level to overcome.
Market direction:
A decisive close above 1.39 today, followed up with a strong retest on H4 timeframe, is, we believe, enough to warrant a buy. Take-profit targets would be set at the 1.40 handle, and then finally around 1.4079: the weekly broken Quasimodo level mentioned above.
Data points to consider: UK retail sales m/m at 9.30am; US prelim UoM consumer sentiment at 3pm, followed by FOMC member Quarles speaking at 5.15pm GMT.
Areas worthy of attention:
Supports: 1.38 handle; 1.3878.
Resistances: 1.39 handle; 1.40 handle; 1.4079.
AUD/USD:
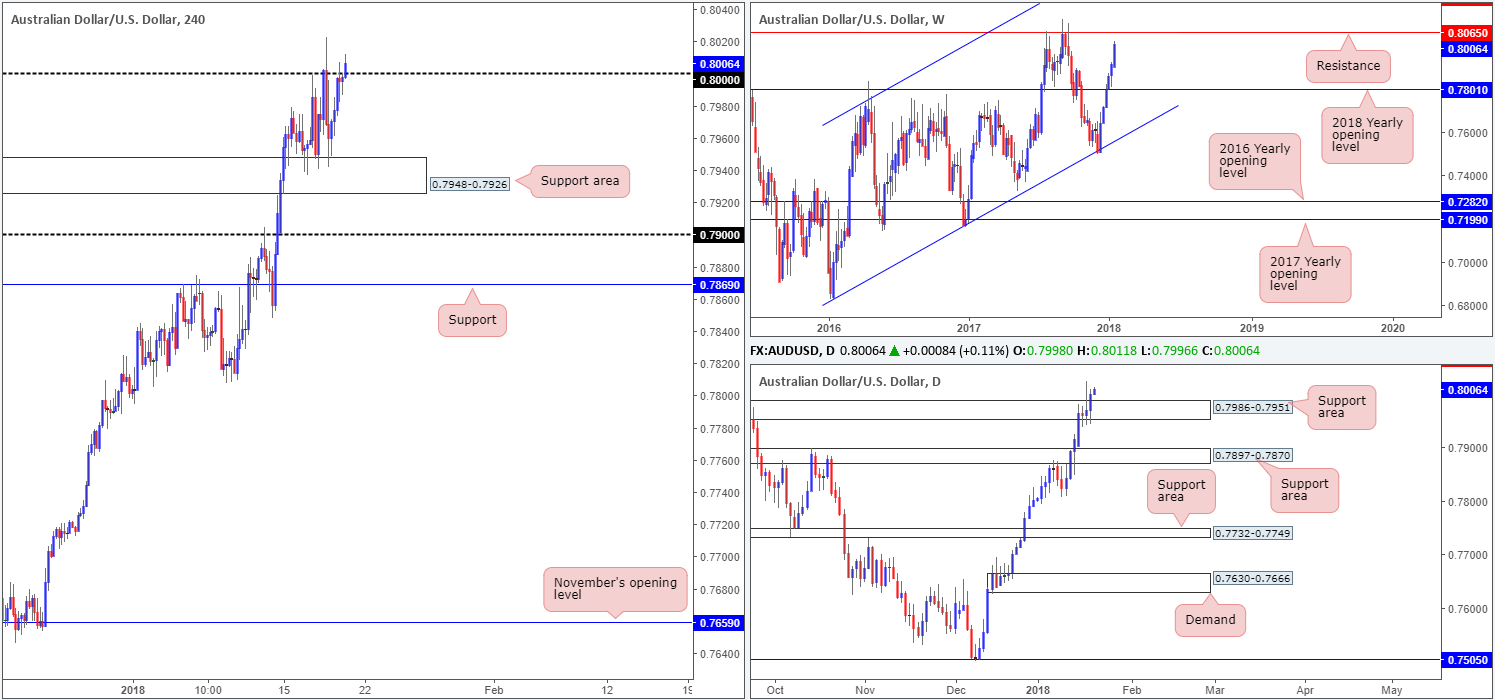
In recent sessions, we’ve seen the commodity currency respect the H4 support area coming in at 0.7948-0.7926 and rise higher. As you can see on the H4 timeframe right now, the candles are seen probing the large psychological band 0.80. At the moment, the bulls seem to have the upper hand!
Over on the daily timeframe, the 0.7986-0.7951 area is now offering the market support. Continued buying from this region would likely pull the unit up to as far north as the weekly resistance level plotted at 0.8065.
Market direction:
Assuming that 0.80 is cleared of sellers, we see little stopping the Aussie from extending gains and potentially shaking hands with the aforementioned weekly resistance.
A decisive H4 close above 0.80 would open the door to a break/retest play we believe. Ideally, you should be looking to net over two times your risk with this setup, so be mindful as to where you position stops!
Data points to consider: US prelim UoM consumer sentiment at 3pm, followed by FOMC member Quarles speaking at 5.15pm GMT.
Areas worthy of attention:
Supports: 0.7948-0.7926; 0.7986-0.7951.
Resistances: 0.80 handle; 0.8065.
USD/JPY:
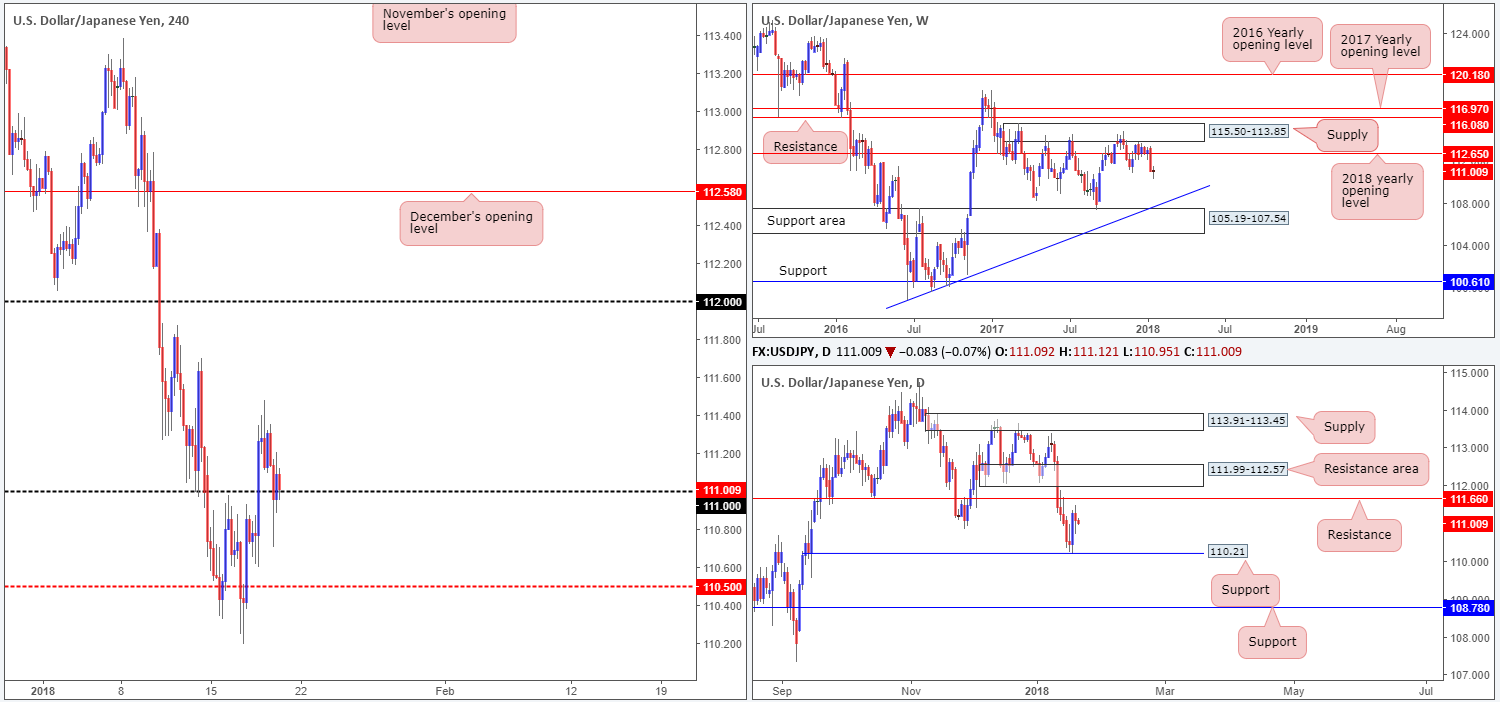
In the early hours of yesterday’s segment, the pair clocked a session high of 111.48. Further selling from the top was seen throughout the course of the trading day, which eventually triggered a run through bids at the 111 handle to lows of 110.70. Despite this move, the H4 candles remain supportive of the 111 handle.
To the upside, we do not see much on the H4 scale until the 112 handle. Of course, the 111.50 region could act as temporary resistance here, but given recent history, we do not place much weight on this number. Over on the daily timeframe, however, resistance is seen coming in from the 111.66 region, shadowed closely by a daily resistance area plotted at 111.99-112.57.
Market direction:
Buying from 111 is not a setup we’d label high probability, largely because of the aggressive spike below the number (likely weakening buyers) and nearby daily resistances. Equally, selling would also be out of the question until we reach the noted daily areas, or saw a decisive break beyond 111. Beyond this number, we see the H4 mid-level support at 110.50, followed by daily support registered at 110.21.
Data points to consider: US prelim UoM consumer sentiment at 3pm, followed by FOMC member Quarles speaking at 5.15pm GMT.
Areas worthy of attention:
Supports: 111 handle; 110.50; 110.21.
Resistances: 112 handle; 111.50; 111.66; 111.99-112.57.
USD/CAD:
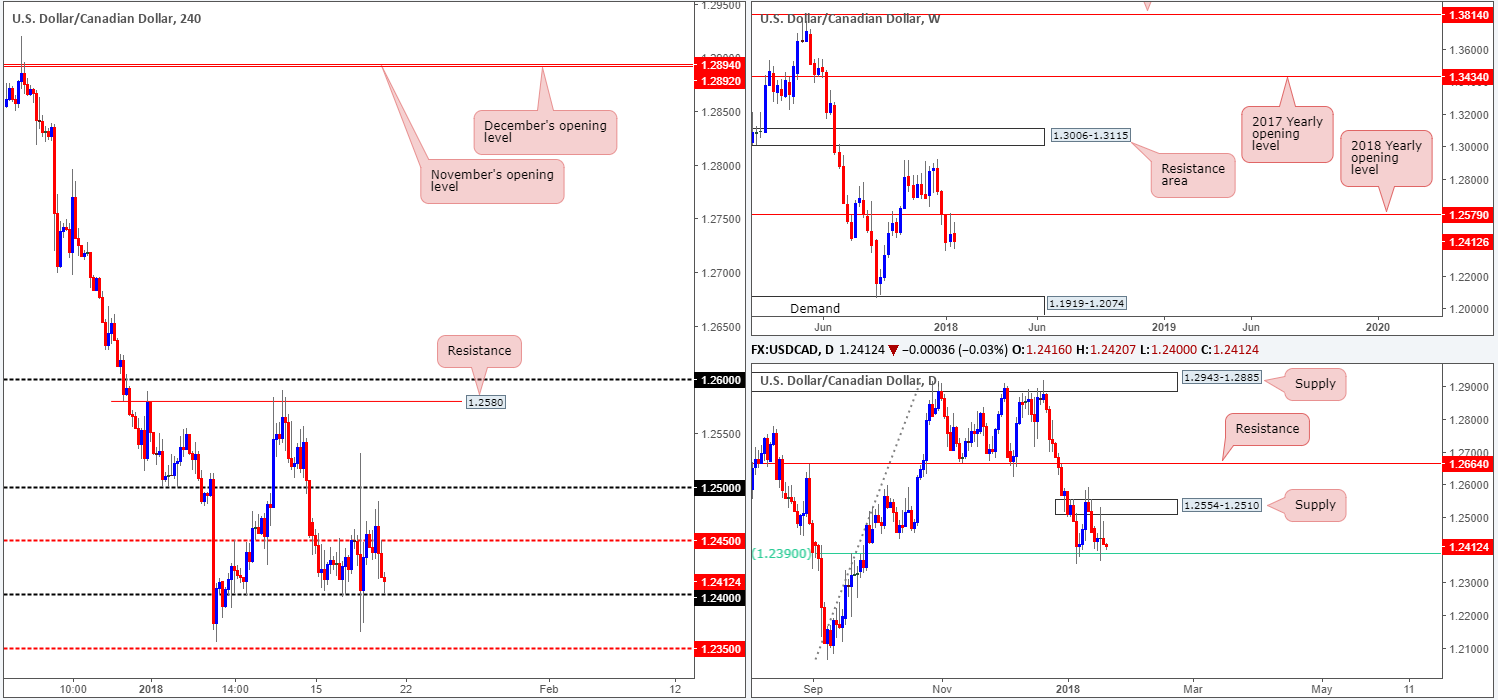
Following a brief period above the H4 mid-level resistance 1.2450 on Thursday, the unit collapsed going into the US session. In recent hours, we’ve seen bids defend the 1.24 handle, which could lead to a corrective move being seen back up to 1.2450 today.
Weekly action continues to consolidate sub 1.2579: the 2018 yearly opening level. Further selling from this point could eventually see the unit tackle a weekly demand area coming in at 1.1919-1.2074. Moving down to the daily candles, we can see that the buyers and sellers remain confined between daily supply at 1.2554-1.2510 and a daily 61.8% Fib support level at 1.2390.
Market direction:
In spite of weekly price suggesting further downside, the daily 61.8% Fib support mentioned above at 1.2390 will likely be tough nut to crack.
Buying from 1.24 could be an option on an intraday basis, since another layer of support is seen just beneath it at 1.2390 (daily Fib highlighted above). The trade would require constant monitoring, largely due to the fact that buying from here entails going up against potential weekly flow.
Data points to consider: US prelim UoM consumer sentiment at 3pm followed by FOMC member Quarles speaking at 5.15pm; CAD foreign securities purchases and Manufacturing sales m/m at 1.30pm GMT.
Areas worthy of attention:
Supports: 1.24 handle; 1.2390; 1.1919-1.2074.
Resistances: 1.2450; 1.25 handle; 1.2554-1.2510.
USD/CHF:
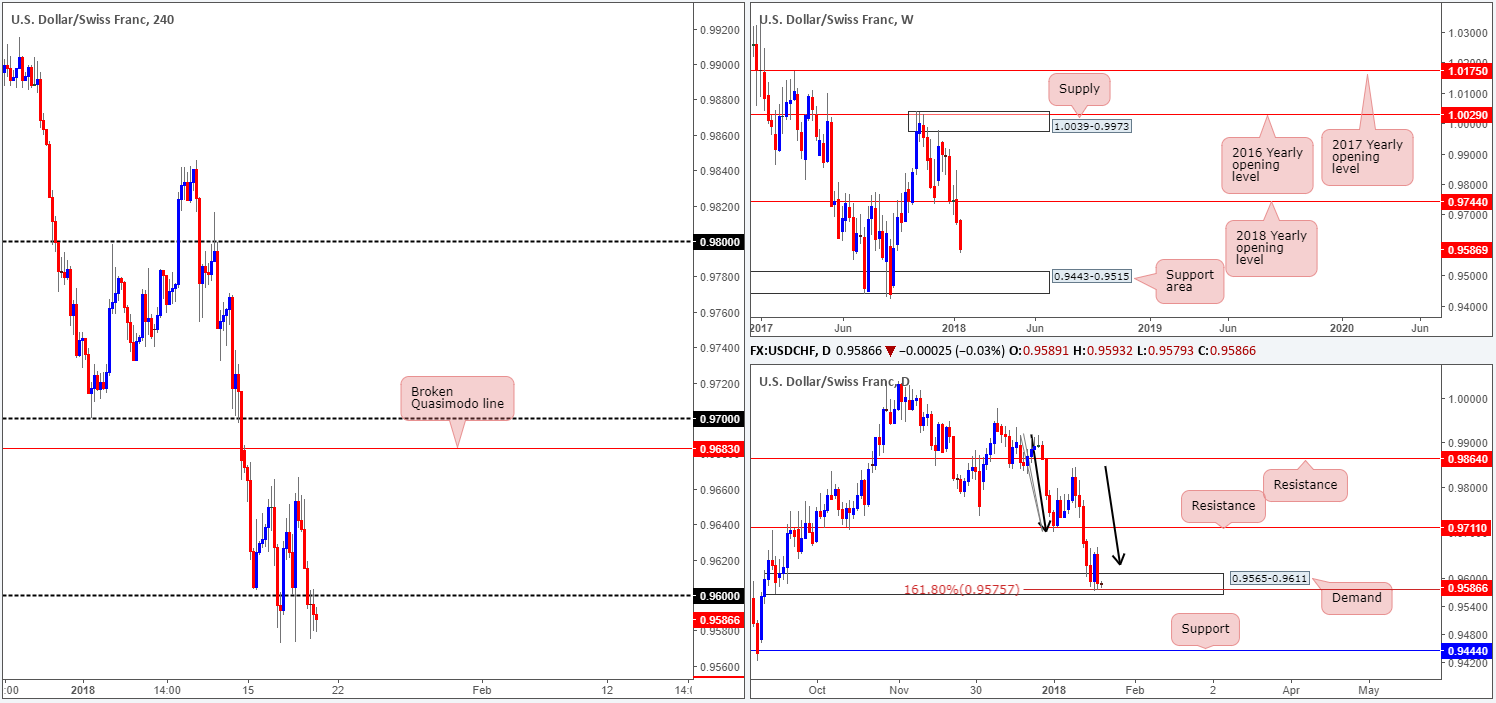
Coming in from the top this morning, it is clear to see that weekly price reflects a strong bearish stance at the moment. Further losses on this scale could bring this market down to as far south as the weekly support area drawn from 0.9443-0.9515. Daily flow, on the other hand, remains flirting with the lower limits of a daily demand area at 0.9565-0.9611, which is bolstered by additional support coming in from a daily AB=CD (see black arrows) 161.8% Fib ext. point at 0.9575.
H4 price edged its way beneath the 0.96 handle as we moved into US trading yesterday. This number, as you can see, has so far provided resistance to the market. The next area of concern below can be seen at the H4 mid-level support at 0.9550 – just underneath the current daily demand.
Market direction:
Further upside is hindered by the 0.96 barrier and threat of further selling on the weekly timeframe, whereas, further downside is restricted by the aforementioned daily demand base!
Whichever direction one selects today, you’ll face potentially strong opposition. Without a clear path free of nearby structure, opting to remain on the sidelines may be the better path to take.
Data points to consider: US prelim UoM consumer sentiment at 3pm followed by FOMC member Quarles speaking at 5.15pm; CHF PPI m/m at 8.15am GMT.
Areas worthy of attention:
Supports: 0.9443-0.9515; 0.9565-0.9611; 0.9575.
Resistances: 0.96 handle; 0.9711; 0.9744.
DOW 30:
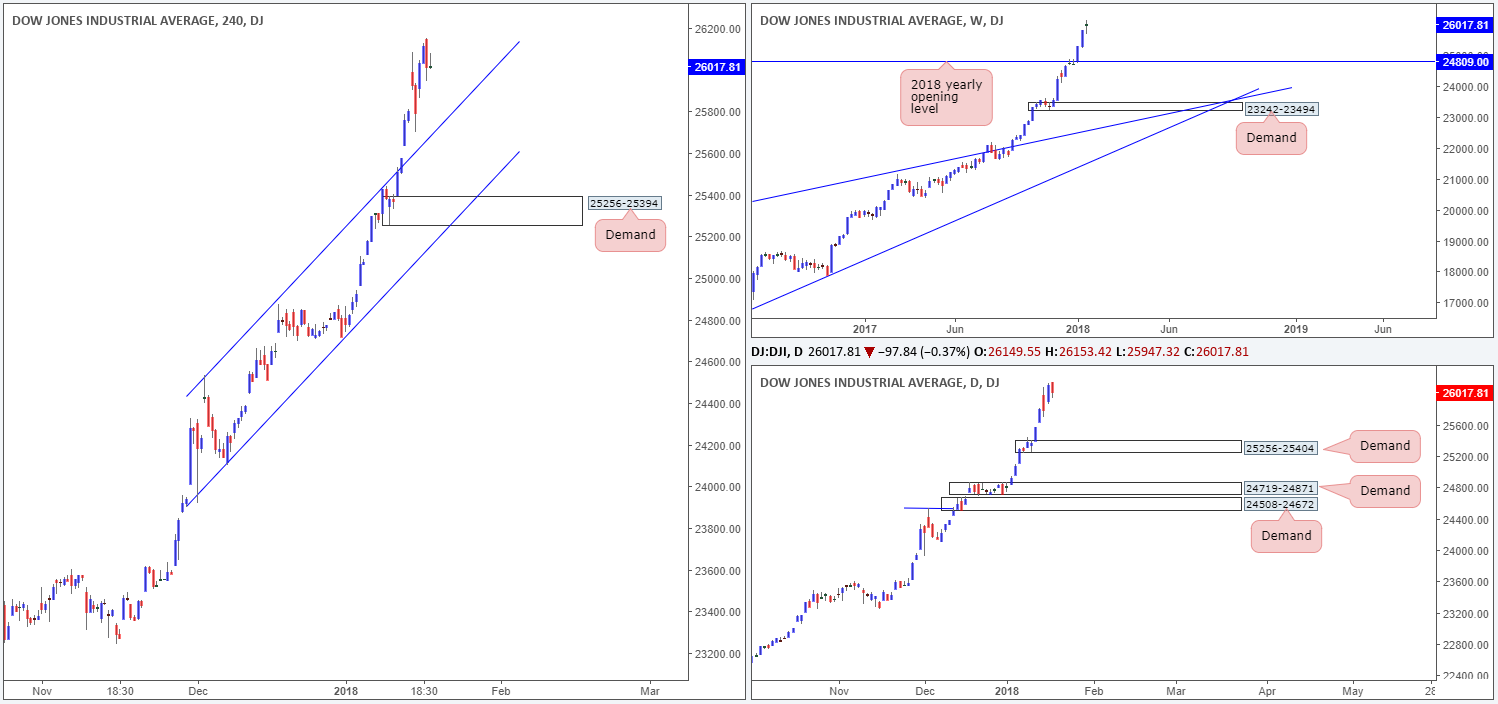
US equities pulled back from record highs of 26153 on Thursday, down 0.37% on the day. Further losses from this point may eventually pull the index south to retest the H4 channel resistance-turned support (extended from the high 24534). A violation of this line, however, would likely clear the river south down to at least the H4 demand base sitting at 25256-25394. Also of particular interest is that this H4 demand is located within the lower limits of daily demand registered at 25256-25404.
Market direction:
Levels of interest are as follows:
- Look to trade any retest seen off of the recently broken H4 channel resistance-turned support.
- Failing that, look for price to dip lower and test the H4 demand at 25256-25394. As this area is housed within the lower limits of the aforementioned daily demand, the odds of price responding from this zone are high, in our view.
Data points to consider: US prelim UoM consumer sentiment at 3pm followed by FOMC member Quarles speaking at 5.15pm; CHF PPI m/m at 8.15am GMT.
Areas worthy of attention:
Supports: H4 channel support; 25256-25394; 25256-25404.
Resistances: …
GOLD:
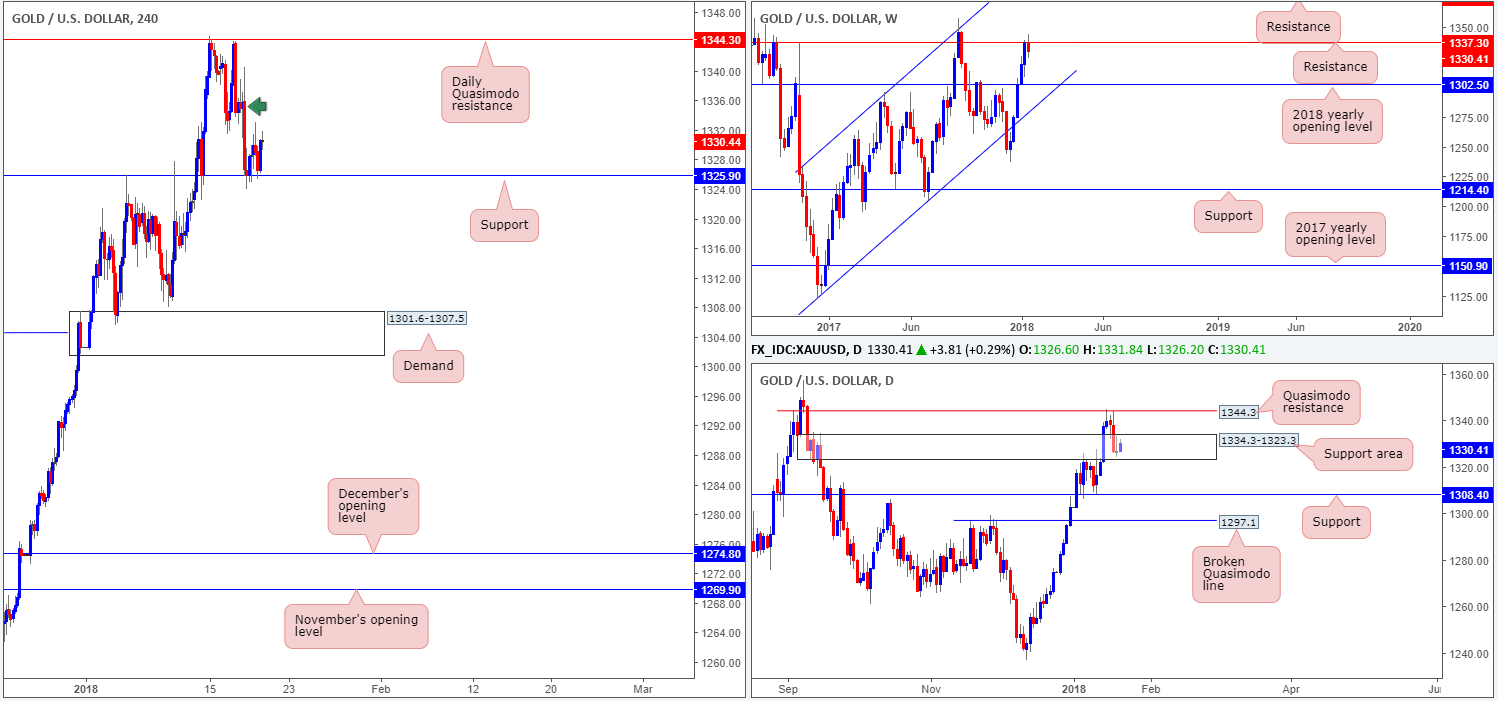
In spite of the gold market seen trading from a weekly resistance at 1337.3, H4 price maintained support at 1325.9, as did the daily support area registered at 1334.3-1323.3.
In the event that the buyers move it into second gear today, we foresee some resistance forming around the 1335.0 region on the H4 scale (H4 supply marked with a green arrow at 1340.5-1355.5). On the daily timeframe, however, the next base of resistance is not seen until we reach 1344.3: a daily Quasimodo resistance.
Market direction:
Attempting to long the price of gold at current price could potentially work out, should you be willing to liquidate around 1335.0. Weekly selling pressure from the weekly resistance level mentioned above will likely be a concern for most buyers right now.
Whichever direction one selects today, opposition is clearly seen at both ends, so trade vigilantly!
Areas worthy of attention:
Supports: 1325.9; 1334.3-1323.3.
Resistances: 1337.3; 1344.3.
This site has been designed for informational and educational purposes only and does not constitute an offer to sell nor a solicitation of an offer to buy any products which may be referenced upon the site. The services and information provided through this site are for personal, non-commercial, educational use and display. IC Markets does not provide personal trading advice through this site and does not represent that the products or services discussed are suitable for any trader. Traders are advised not to rely on any information contained in the site in the process of making a fully informed decision.
This site may include market analysis. All ideas, opinions, and/or forecasts, expressed or implied herein, information, charts or examples contained in the lessons, are for informational and educational purposes only and should not be construed as a recommendation to invest, trade, and/or speculate in the markets. Any trades, and/or speculations made in light of the ideas, opinions, and/or forecasts, expressed or implied herein, are committed at your own risk, financial or otherwise.
The use of the site is agreement that the site is for informational and educational purposes only and does not constitute advice in any form in the furtherance of any trade or trading decisions.
The accuracy, completeness and timeliness of the information contained on this site cannot be guaranteed. IC Markets does not warranty, guarantee or make any representations, or assume any liability with regard to financial results based on the use of the information in the site.
News, views, opinions, recommendations and other information obtained from sources outside of www.icmarkets.com.au, used in this site are believed to be reliable, but we cannot guarantee their accuracy or completeness. All such information is subject to change at any time without notice. IC Markets assumes no responsibility for the content of any linked site. The fact that such links may exist does not indicate approval or endorsement of any material contained on any linked site.
IC Markets is not liable for any harm caused by the transmission, through accessing the services or information on this site, of a computer virus, or other computer code or programming device that might be used to access, delete, damage, disable, disrupt or otherwise impede in any manner, the operation of the site or of any user’s software, hardware, data or property.


