
A note on lower timeframe confirming price action…
Waiting for lower timeframe confirmation is our main tool to confirm strength within higher timeframe zones, and has really been the key to our trading success. It takes a little time to understand the subtle nuances, however, as each trade is never the same, but once you master the rhythm so to speak, you will be saved from countless unnecessary losing trades. The following is a list of what we look for:
- A break/retest of supply or demand dependent on which way you’re trading.
- A trendline break/retest.
- Buying/selling tails/wicks – essentially we look for a cluster of very obvious spikes off of lower timeframe support and resistance levels within the higher timeframe zone.
- Candlestick patterns. We tend to only stick with pin bars and engulfing bars as these have proven to be the most effective.
We search for lower timeframe confirmation between the M15 and H1 timeframes, since most of our higher-timeframe areas begin with the H4. Stops are usually placed 5-10 pips beyond confirming structures.
EUR/USD:
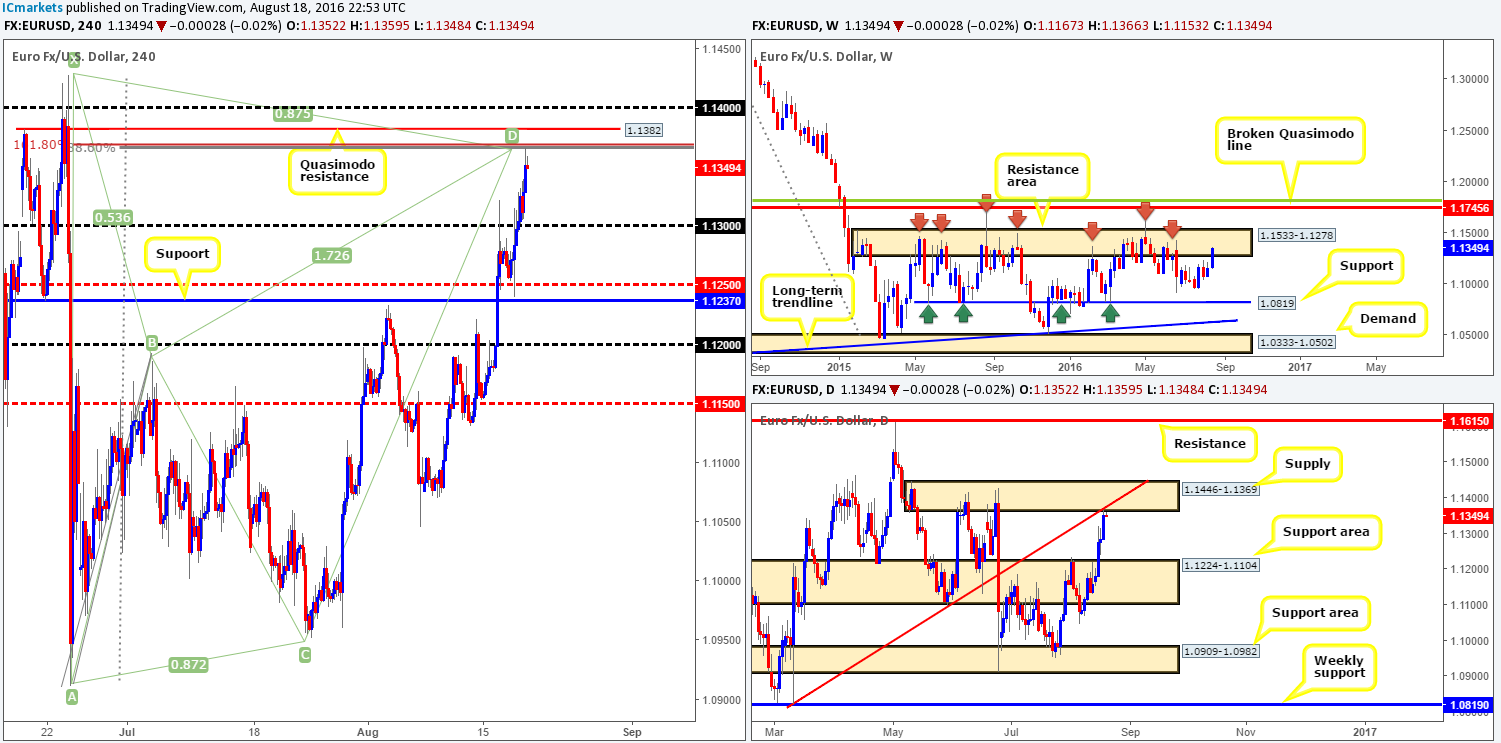
In our previous report, our team mentioned that we had set a pending sell order at 1.1362 with a stop placed at 1.1432. As you can see, this order was recently filled and is currently sitting in the green. For those who missed the report, here’s our reasoning behind our current trade:
- H4 Quasimodo resistance at 1.1382.
- Nice-looking H4 harmonic bearish Bat pattern which shows completion around the 1.1367ish range (H4 88.6% Fib resistance/H4 161.8% Fib extension).
- Psychological resistance at 1.14.
- Daily supply area at 1.1446-1.1369 which encapsulates the H4 Quasimodo sell line.
- Daily trendline resistance (1.0821) which fuses beautifully with the H4 Quasimodo sell line.
- And finally let’s not forget that all of the above is housed within a weekly resistance area given at 1.1533-1.1278.
Well done to any of our readers who sold alongside us!
Pushing forward, we have an initial target objective set at the 1.13 handle, which, in our opinion, should easily be achieved today. Ideally, we’ll be looking to reduce risk to breakeven here and take 50% of the position off the table before the week’s close, as we absolutely despise leaving open positions live over the weekend! Our final take-profit target for this sell can be seen around the H4 support line coming in at 1.1237, due to this barrier lurking just above the daily support area drawn from 1.1224-1.1104 – the next downside target on the daily timeframe.
Levels to watch/live orders:
- Buys: Flat (Stop loss: N/A).
- Sells: 1.1362 [LIVE] (Stop loss: 1.1432).
GBP/USD:
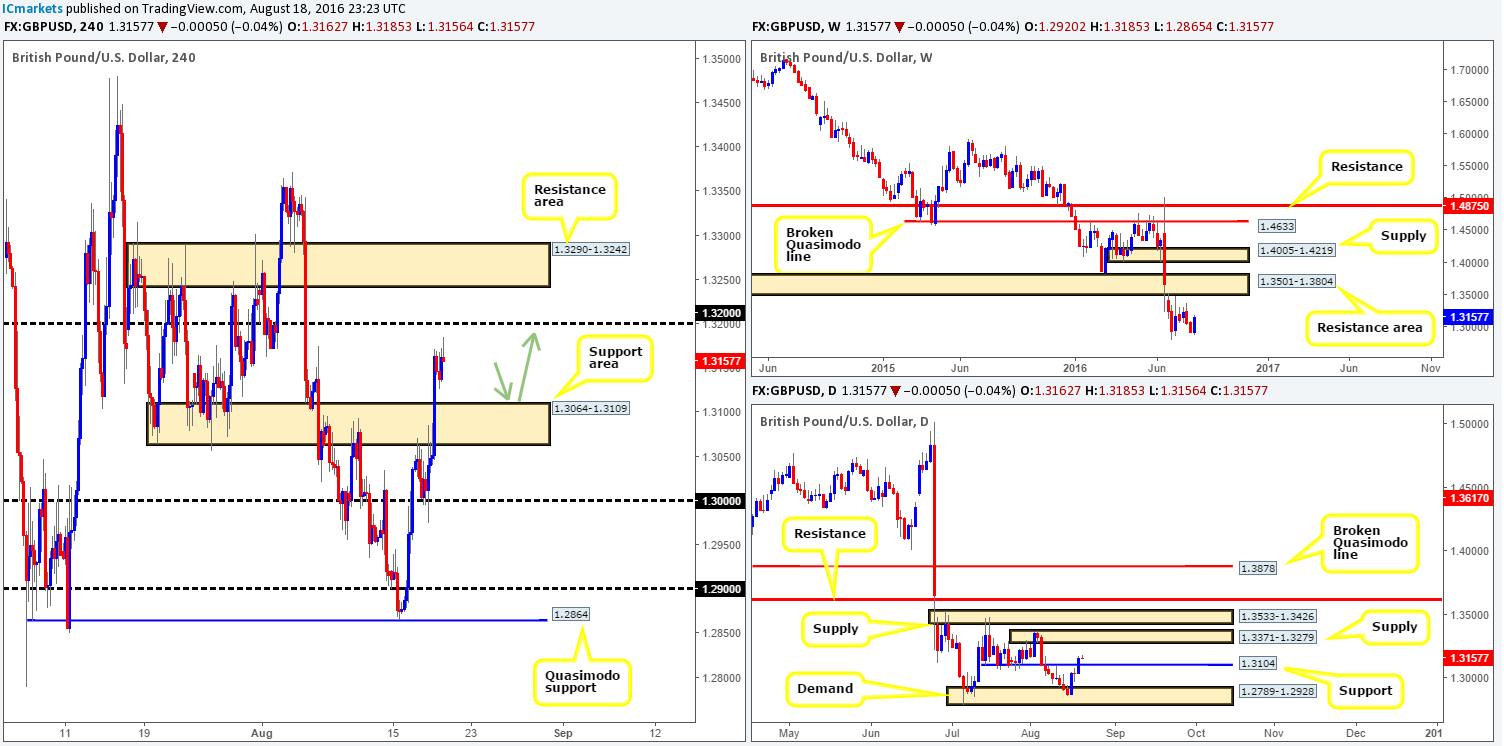
Boosted by yesterday’s stronger than expected UK retail sales report, cable rocketed higher going into the London open. This move, as is shown on the H4 chart, took out a H4 resistance area at 1.3064-1.3109 (now acting support), and also a daily resistance line at 1.3104 (now acting support – see the daily chart) which is lodged within this H4 area.
In light of this recent movement, there’s space now seen for H4 price to rally up to at least the 1.32 handle, followed by a nearby H4 resistance area at 1.3290-1.3242. On top of this, daily action also shows room to continue north towards daily supply penciled in at 1.3371-1.3279 (surrounds the above said H4 resistance zone).
Our suggestions: Watch for the H4 candles to retest the H4 support area at 1.3064-1.3109. Should this zone show signs of strength, one can then begin looking to enter long. We would, however, strongly advise waiting for lower timeframe price action to form before pulling the trigger (see the top of this report for lower timeframe entry techniques). The reason being is that although H4 and daily structure agree with the above buy zone, let’s not forget that the GBP is in a strong downtrend at present (see the weekly chart).
In the event that one is able to pin down an entry from within this zone today, 1.32 and the H4 resistance area at 1.3290-1.3242 are our preferred take-profit zones.
Levels to watch/live orders:
- Buys: 1.3064-1.3109 [Tentative – confirmation required] (Stop loss: dependent on where one confirms this area).
- Sells: Flat (Stop loss: N/A).
AUD/USD:
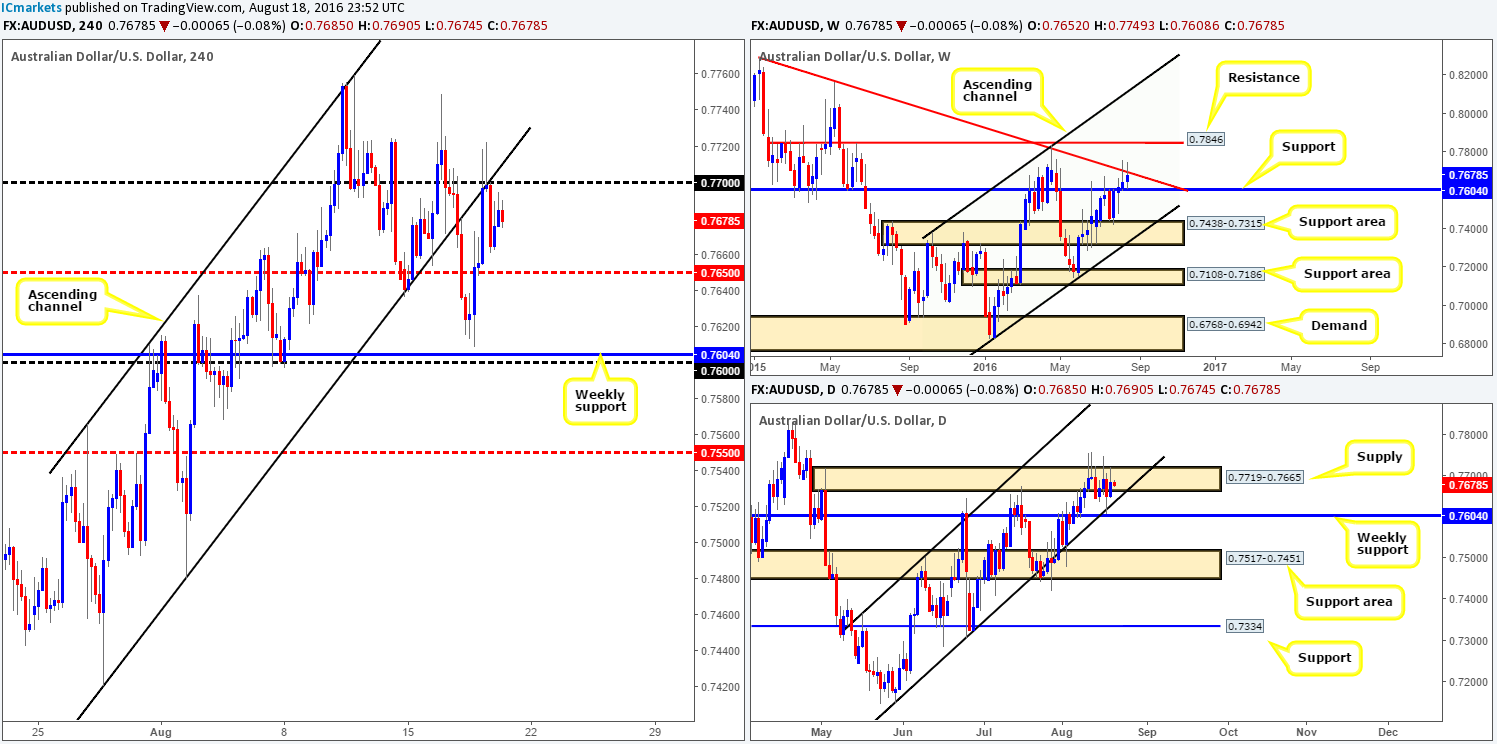
The Australian labor market showed a dramatic improvement yesterday, consequently pushing the commodity currency to highs of 0.7718 early on in the day. However, the rally was a relatively short-lived one since price topped out around the 0.7720 region and traded back below the 0.77 handle, forming a H4 bearish pin-bar candle. This candle – coupled with the 0.77 handle and the underside of a recently broken H4 channel support (now resistance) taken from the low 0.7420, as well as a nearby weekly trendline resistance extended from the high 0.8895, was enough to condone a short in our opinion. This was a noted move to watch for in yesterday’s report so we hope some of our readers are currently short!
In view of H4 price now seen trading mid-range between 0.77 and the H4 mid-way support 0.7650, where does one go from here? Well, as we mentioned in our previous analysis, the higher-timeframe structures are somewhat cramped at the moment. While the above said weekly trendline resistance holds prices lower, there’s a long-term weekly support band lurking just below seen at 0.7604 capping downside. By the same token, daily supply at 0.7719-0.7665 continues to hold prices lower, but given the above said weekly support positioned just below and a merging daily channel support taken from the low 0.7148, price is somewhat restricted here too.
Our suggestions: If you’re still short from 0.77, we’d be looking to take at least 70% of the position off the table around the 0.7650ish range, leaving the rest to potentially run down to the weekly support. Other than this though guys, we see very little opportunity to trade this pair right now.
Levels to watch/live orders:
- Buys: Flat (Stop loss: N/A).
- Sells: Flat (Stop loss: N/A).
USD/JPY:
Beginning with a look at the weekly chart this morning, we can see that the current weekly candle remains trading below weekly support found at 100.61. As mentioned in our previous reports, we feel it’s still best to wait for the weekly candle to close shop before presuming that this support is consumed.
Looking over to the H4 chart, the large psychological boundary 100 appears to still have a hand in this fight! Assuming that the buyers continue to defend this number as they did back in early July and also more recently on the 16th August, weekly price still has a chance of closing back above the current weekly support this week.
Our suggestions: Uncertainty surrounding the weekly support’s strength bothers us! It’s very difficult to judge. Will it become a new resistance or was this recent push lower simply a fakeout to bounce higher? Despite the overall trend pointing south, until we know the answer to the above question we’d feel uncomfortable risking capital trading this pair. Therefore, our team will remain on the sidelines and re-evaluate going into Monday’s sessions.

Levels to watch/live orders:
- Buys: Flat (Stop loss: N/A).
- Sells: Flat (Stop loss: N/A).
USD/CAD:
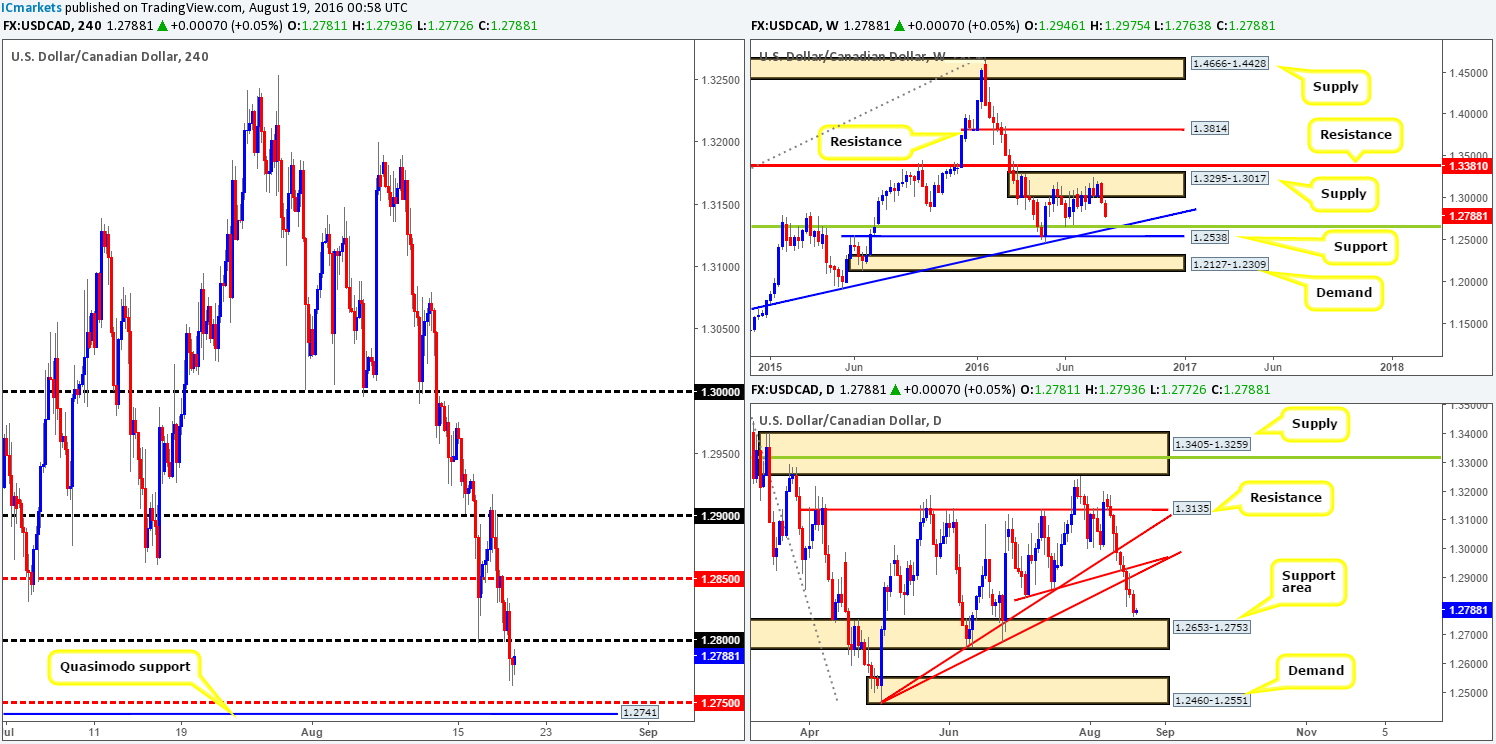
Weighed on heavily by oil’s recent advance, the USD/CAD pair continued to trade lower yesterday following a retest off the H4 mid-way resistance 1.2850. This was a noted move to watch for in our previous report so we hope some of our readers managed to bag some pips from here!
With daily price now seen trading just ahead of a daily support area at 1.2653-1.2753, and weekly action showing room to continue lower down to a weekly trendline support extended from the high 1.1278 (intersects beautifully with a weekly 38.2 % Fib support line at 1.2649), a short from the 1.28 handle looks interesting.
Our suggestions: Given the higher-timeframe picture, look for lower timeframe confirmed (see the top of this report) shorts from the 1.28 handle today, targeting the H4 mid-way support 1.2750/H4 Quasimodo support at 1.2741.Should this play out, the 1.2750 range would also be a good location to begin hunting for longs considering that it is housed within the aforementioned daily support area. However, caution is still advised (waiting for lower timeframe confirmation is recommended) due to the weekly chart suggesting that price could potentially stab below the current daily support area to the weekly 38.2% Fib support mentioned above at 1.2649.
Levels to watch/live orders
- Buys: 1.2750 range [Tentative – confirmation required] (Stop loss: dependent on where one confirms this area).
- Sells: 1.28 region [Tentative – confirmation required] (Stop loss: dependent on where one confirms this area).
USD/CHF:
Coming in from the weekly chart this morning, the Swissy is currently lurking fifty or so pips ahead of a major weekly support level coming in at 0.9508, which merges with a weekly trendline support extended from the low 0.8703. Sliding down into the daily chart, daily support at 0.9584 was recently wiped out (now acting resistance), potentially opening up the path south for further downside to a daily Quasimodo support drawn from 0.9498 (sits just below the aforementioned weekly support level). Nevertheless, as we hope is demonstrated on the daily chart, price is finding support around the tip of a daily AB=CD completion point taken from the high 0.9950. This does not, however, mean price will not stretch down to test the daily Quasimodo support barrier.
Our suggestions: In regard to the recent selling seen on this pair, the unit is now retesting the underside of a H4 mid-way resistance level at 0.9550. Should this number hold as resistance, it’s likely we’ll see a touch of the 0.95 handle going into today’s more liquid sessions, which, given the higher –timeframe structures listed above in bold, would be a fantastic level to buy from at market with a stop set below the daily Quasimodo apex at 0.9440.
Seeing as we are currently short the EUR/USD (see the top of this report), we’re secretly hoping that price breaks higher (allowing us to take some profit) before continuing south!
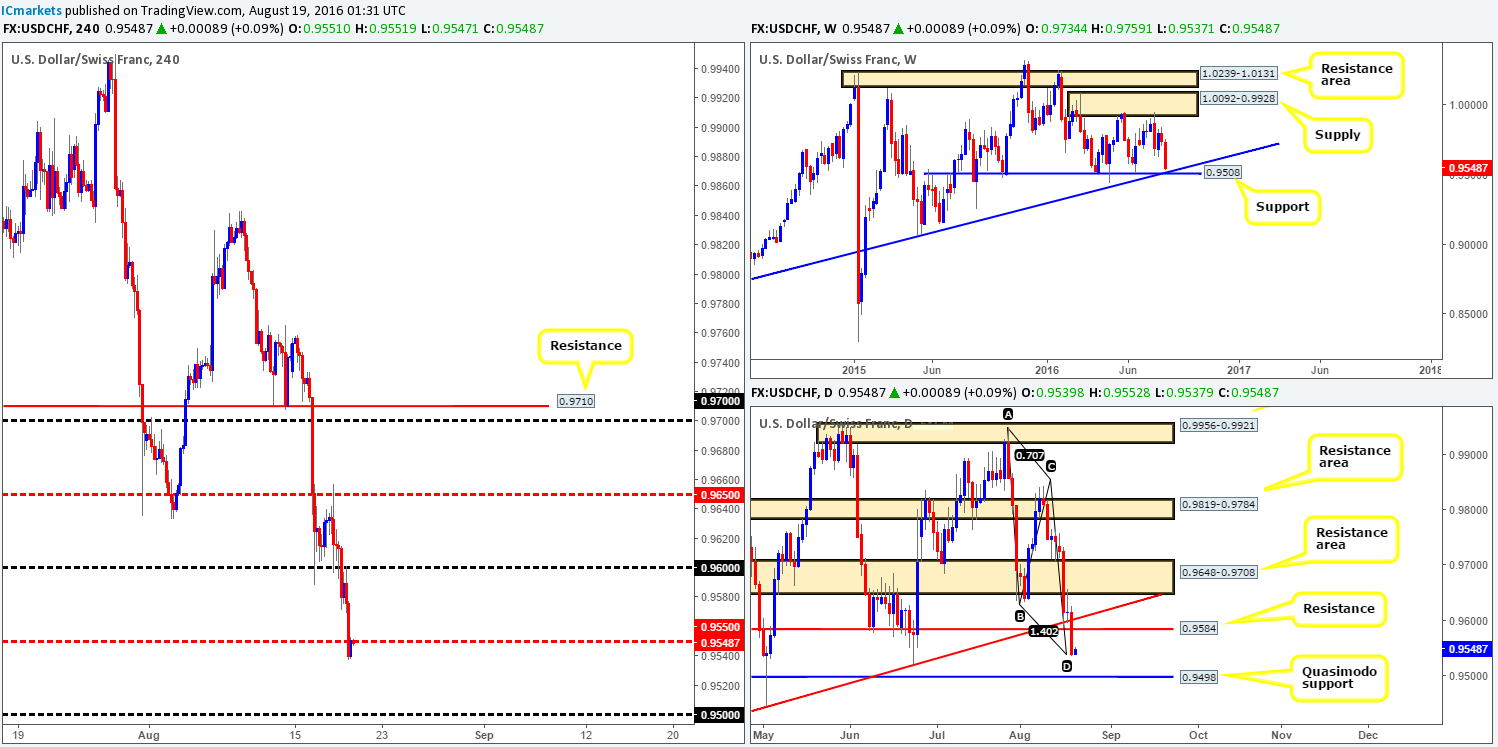
Levels to watch/live orders:
- Buys: 0.95 [Pending order possible] (Stop loss: 0.9440).
- Sells: Flat (Stop loss: N/A).
DOW 30:
Early on in yesterday’s US session, the DOW spiked lower to test the H4 support level coming in at 18532 and rotated nicely. Now, this was a noted barrier to keep an eye on for longs in our previous report, so we hope some of our readers took advantage of this. With price now finding resistance around the 18590 region, the equity market may retest this H4 support once again today.
In that price chalked up a picture-perfect weekly pin bar off a weekly support area coming in at 18365-18158 two weeks ago, and daily action recently printing a nice-looking pin bar off of the minor daily support at 18480, higher prices are still likely on the cards.
Our suggestions: In light of the above points, for those who are already long from the current H4 support, we’d advise taking some profits off the table and maybe reducing risk to breakeven. The remaining portion of your position can be left to run, targeting the H4 Quasimodo resistance at 18639. Following this, we’d look for price to punch to fresh highs with the aim of joining the current trend.
Should price retest the above said H4 support level today, nevertheless, a buy from here on the basis that the trade is backed by a sound lower timeframe buy signal is reasonable in our book. This could be either an engulf of supply followed by a subsequent retest, a trendline break/retest or simply a collection of well-defined buying tails around the H4 zone.
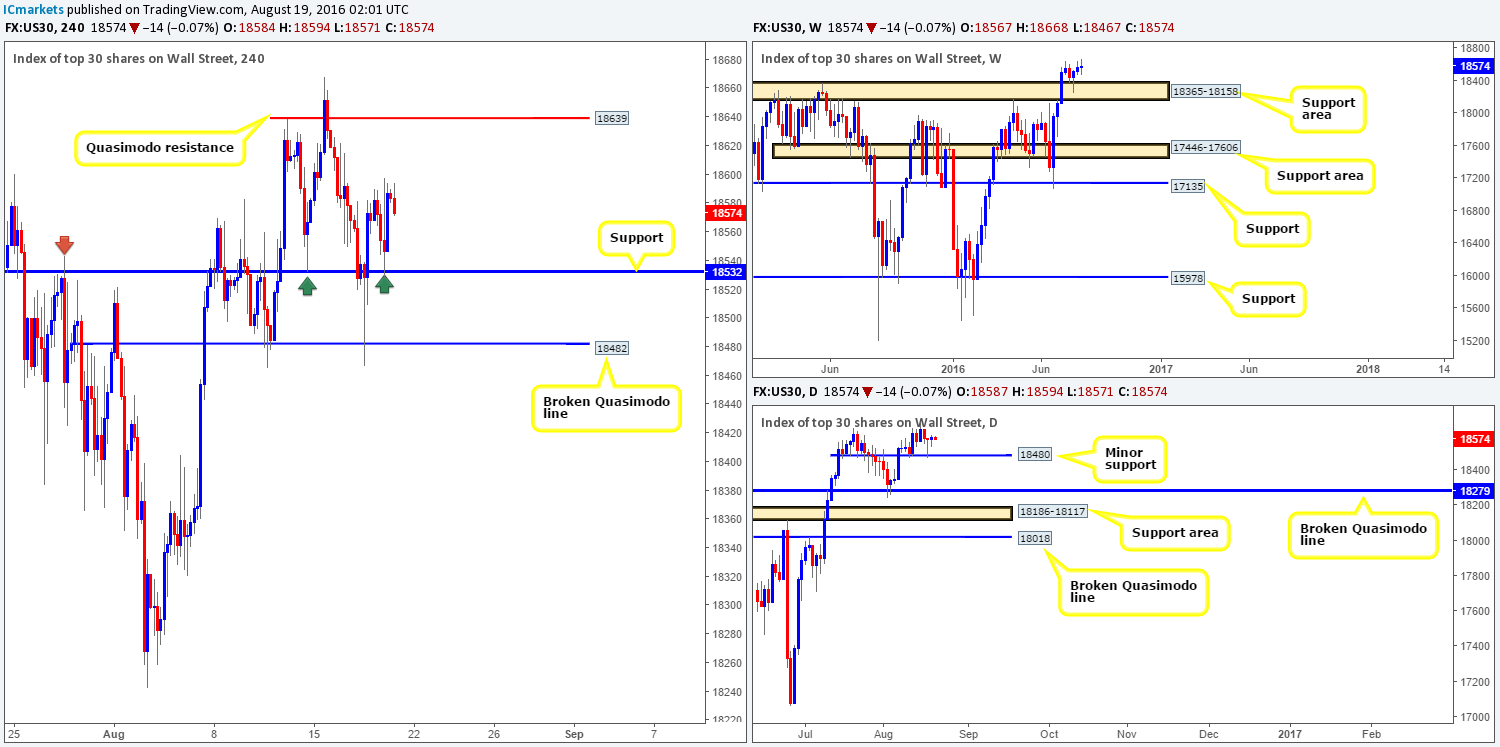
Levels to watch/live orders:
- Buys: 18532 [Tentative – confirmation required] (Stop loss: 18438ish region looks best).
- Sells: Flat (Stop loss: N/A)
GOLD:
Recent action shows that the metal extended lower following yesterday’s bounce from the daily resistance level at 1354.6. With price clearly sporting a bearish tone from the above said level at the moment, the next H4 downside target to have an eyeball on is the minor H4 trendline support taken from the low 1329.7. A break below this line could, in our opinion, seal the deal for lower prices. While there is a possibility of a reaction being seen from the H4 mid-range Quasimodo line at 1332.3, the chances of a break below here are high due to where price has just rebounded from (daily resistance).
Our suggestions: Watch for a clean break below the current H4 trendline and look to trade any retest seen to the underside of this barrier. Should this come to fruition, we’d ultimately be looking to target the H4 demand at 1315.6-1319.6 which is housed within a daily demand zone at 1305.3-1322.8 (the next downside target on the daily timeframe). However, we would not advise simply ignoring the above said H4 broken Quasimodo line, a reaction still may be seen from here. It is, of course, down to the individual trader to determine the strength of the bulls here before deciding on whether to hold for a possible break lower, or completely close the trade out.
This setup may not come into view today; it may be one we can store away for early next week.

Levels to watch/live orders:
- Buys: Flat (Stop loss: N/A).
- Sells: Watch for a break below the current H4 trendline support and look to trade any retest seen thereafter.


