
Key risk events today:
China GDP q/y; China Fixed Asset Investment ytd/y; China Industrial Production y/y; EU Economic Summit; FOMC Member George and Clarida Speak; BoE Gov Carney Speaks.
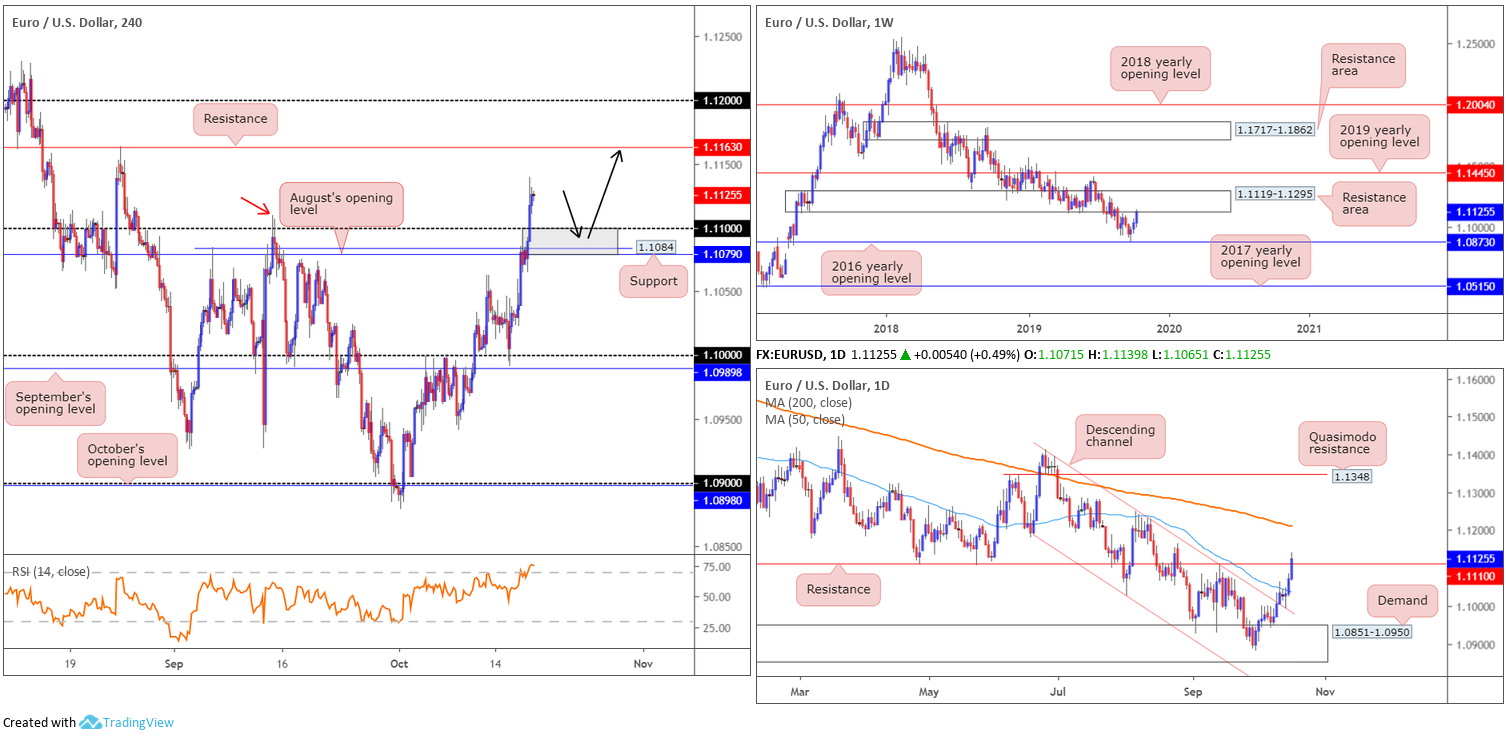
EUR/USD:
Benefiting from a waning buck after more broadly downbeat US data (industrial production, housing starts and headline Philly Fed) and largely tracking its UK counterpart, Europe’s shared currency added more than 50 points and registered a third successive gain Thursday.
Brushing aside August’s opening level at 1.1079, a resistance (now acting support) at 1.1084 and the 1.11 handle (grey zone), the H4 candles exhibit scope to press as far north as notable resistance priced in at 1.1163, followed by the 1.12 handle. Chart studies based on H4 structure, therefore, underlines a potential retest formation (black arrows) at 1.1079/1.11, targeting the noted H4 resistances.
On a wider perspective, daily movement recently crossed above resistance at 1.1110, potentially exposing the 200-day SMA (orange – 1.1210). Note both the 200-day SMA and the 50-day SMA (blue – 1.1037) both remain facing south. The story on the weekly timeframe, after coming within touching distance of the 2016 yearly opening level at 1.0873 two weeks ago, has seen the unit shake hands with the underside of a resistance area coming in at 1.1119-1.1295.
Areas of consideration:
A retest at 1.1079/1.11 on the H4 timeframe is certainly a possible scenario today, particularly as we engulfed a notable swing high (red arrow) at 1.1109 and display room to advance to H4 resistance at 1.1163. This is further supported on the back of the recent resistance break on the daily timeframe at 1.1110. The only downside, of course, is weekly price testing the underside of a resistance area.
Should a retest of the H4 zone come to fruition, traders may wish to wait and see if a H4 bullish candlestick pattern forms before pulling the trigger. This helps identify buyer intent, which is a necessity knowing we’re trading into a weekly resistance zone, and also provides entry and exit parameters to work with.
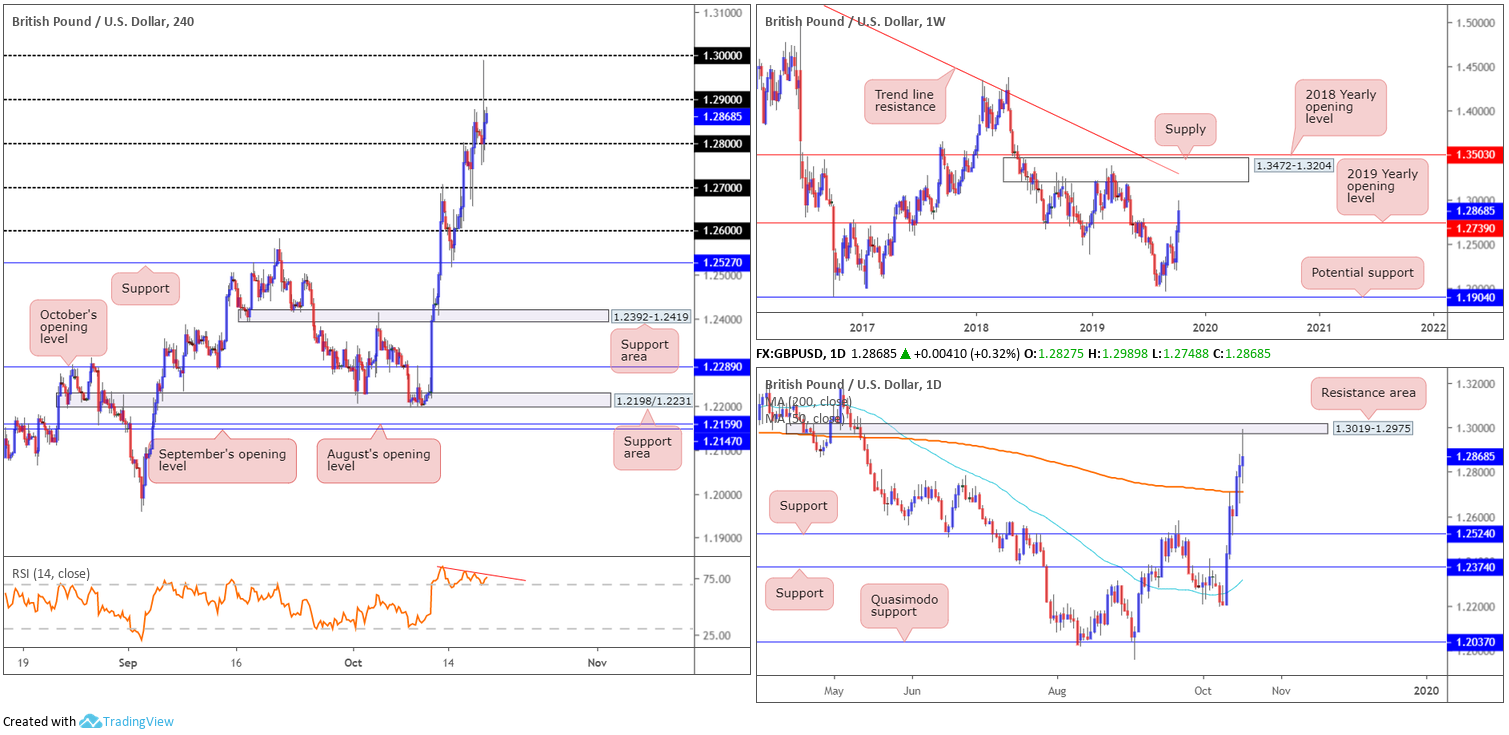
GBP/USD:
The pound remained at the mercy of breaking Brexit news Thursday, with early reports that the DUP is still dissatisfied with the draft proposals drawn up by UK and EU negotiators. The loss of the DUP is a significant blow to the prospects of the deal getting through parliament. GBP/USD surged on the news, tripping buy stops above the 1.29 handle, both from sellers attempting to fade the figure and those bidding the breakout, reaching highs of 1.2989 before swiftly rotating lower and closing back under 1.29 into the close. Indicator-based traders may also want to acknowledge the relative strength index (RSI) is currently seen challenging overbought ground and pencilling in bearish divergence (red line).
Interestingly, price action on the daily timeframe reacted to a sturdy resistance area coming in at 1.3019-1.2975, with the next downside target from this point sited at the 200-day SMA (orange – 1.2711). In terms of where we stand on the weekly timeframe, though, longer-term flow recently tunnelled above its 2019 yearly opening level at 1.2739, potentially setting the stage for a run to supply residing at 1.3472-1.3204.
Areas of consideration:
Overall market sentiment remains biased to the upside. That is clear. However, finding a logical support base in which to take advantage of this movement is proving problematic. While we do have weekly price suggesting higher levels could be in store, daily price is seen respecting a resistance area at 1.3019-1.2975 and shows room to push lower.
With UK Parliament set to hold a special Saturday sitting this weekend, where PM Johnson will attempt to pass his deal through Parliament, alongside the conflicting technical signals at present, opting for the sidelines today may be the safer (and more profitable) path.
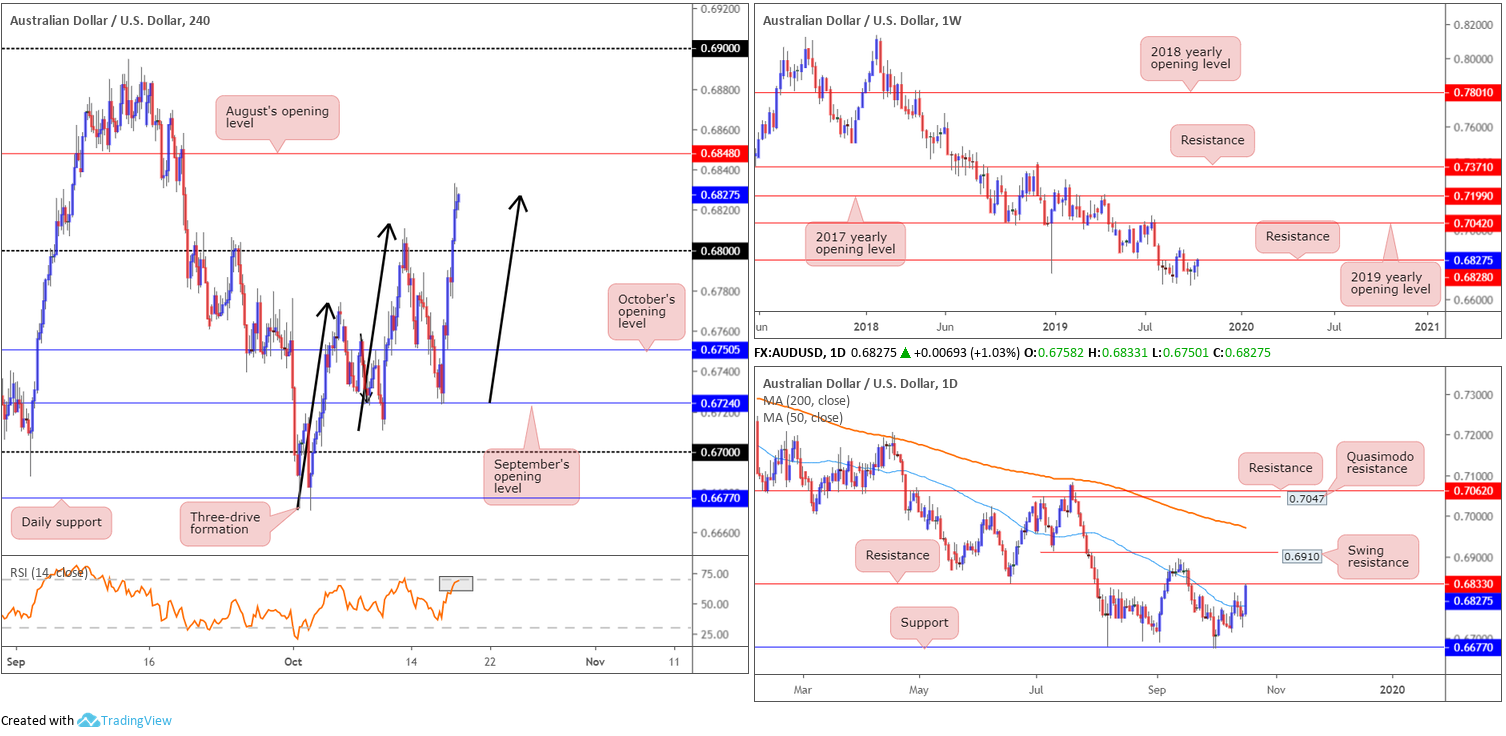
AUD/USD:
AUD/USD bulls strengthened their grip Thursday, largely as a result of an upbeat jobs report which saw strong fulltime employment, and a weakening greenback which now trades south of 98.00 (dollar index).
Technically, nonetheless, the pair is considered overbought. H4 flow, following a sharp break of 0.68, completed a three-drive formation (black arrows) at 0.6828, sited 20 points south of August’s opening level at 0.6848. By and of itself, this pattern has likely garnered the interest of sellers today. In addition to this, though, the relative strength index (RSI) also elbowed its way to near-overbought territory.
Meanwhile, supporting a move lower from the three-drive formation is weekly and daily structure. Weekly price recently crossed swords with resistance at 0.6828, while daily action has resistance plotted at 0.6833. While the next downside target on the daily timeframe falls in at the 50-day SMA (blue – 0.6778), H4 action has the 0.68 handle in sight as the next support.
Areas of consideration:
A short at current price based on the noted three-drive pattern on the H4 timeframe is certainly an option today, with a protective stop-loss order plotted above August’s opening level at 0.6848. This provides approximately a 1:1 risk/reward ratio to 0.68, offering ample room to reduce risk to breakeven. Ultimately, though, traders are likely expecting a generous move to the downside from the higher-timeframe resistances mentioned above, therefore a break of 0.68 is likely expected.
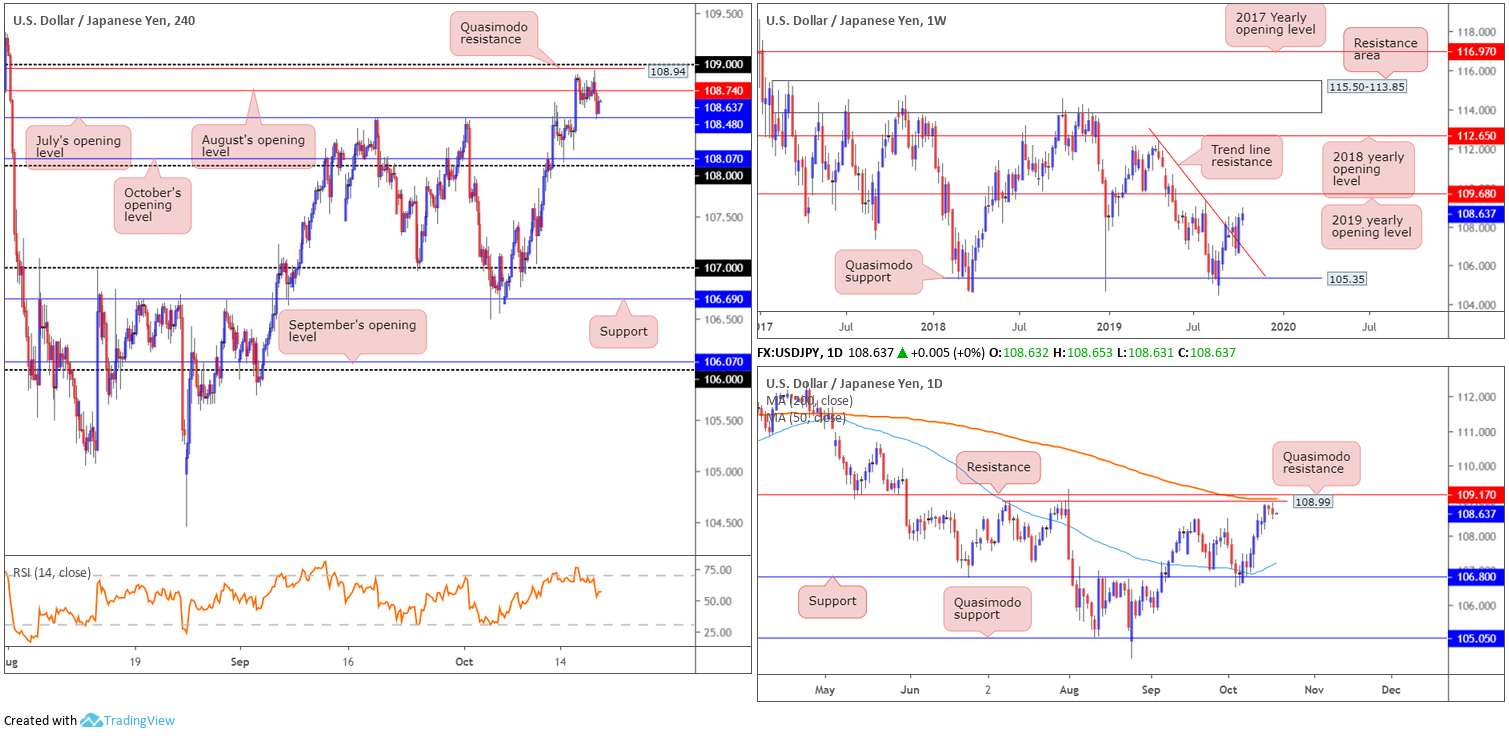
USD/JPY:
The US dollar finished Thursday a shade lower against the Japanese yen, consequently producing a mild bearish outside pattern on the daily timeframe. With UK Parliament set to hold a special Saturday sitting this weekend, where PM Johnson will attempt to pass his deal through Parliament, additional ranging action might be on the cards today.
From a technical perspective, however, the outlook remains unchanged. The H4 candles, although treading water under August’s opening level at 108.74 off July’s opening level at 108.48, remain positioned within touching distance of 109, which happens to align with Quasimodo resistance at 108.94.
Latest from the weekly timeframe has the current candle extending gains following the break of trend line resistance (etched from the high 112.40) last week. The next upside target from this point is seen at the 2019 yearly opening level drawn from 109.68. Although weekly price appears to be gearing up for additional upside, daily price is seen trading within striking distance of Quasimodo resistance at 108.99, the 200-day SMA (orange – 109.06) and resistance coming in at 109.17.
Areas of consideration:
Outlook unchanged.
The 109 handle, given it holds notable confluence from the H4 and daily timeframes, is still a barrier worthy of attention. The only grumble is weekly price demonstrates scope to run beyond 109 to 109.68. To help overcome this and attempt to avoid an unnecessary loss, interested sellers from 109 are urged to consider waiting for additional H4 candlestick confirmation to form before pulling the trigger – think bearish engulfing or shooting star patterns, or even a full-bodied bearish candle. By doing so, not only does this identify seller intent, it also provides entry and risk levels to work with.
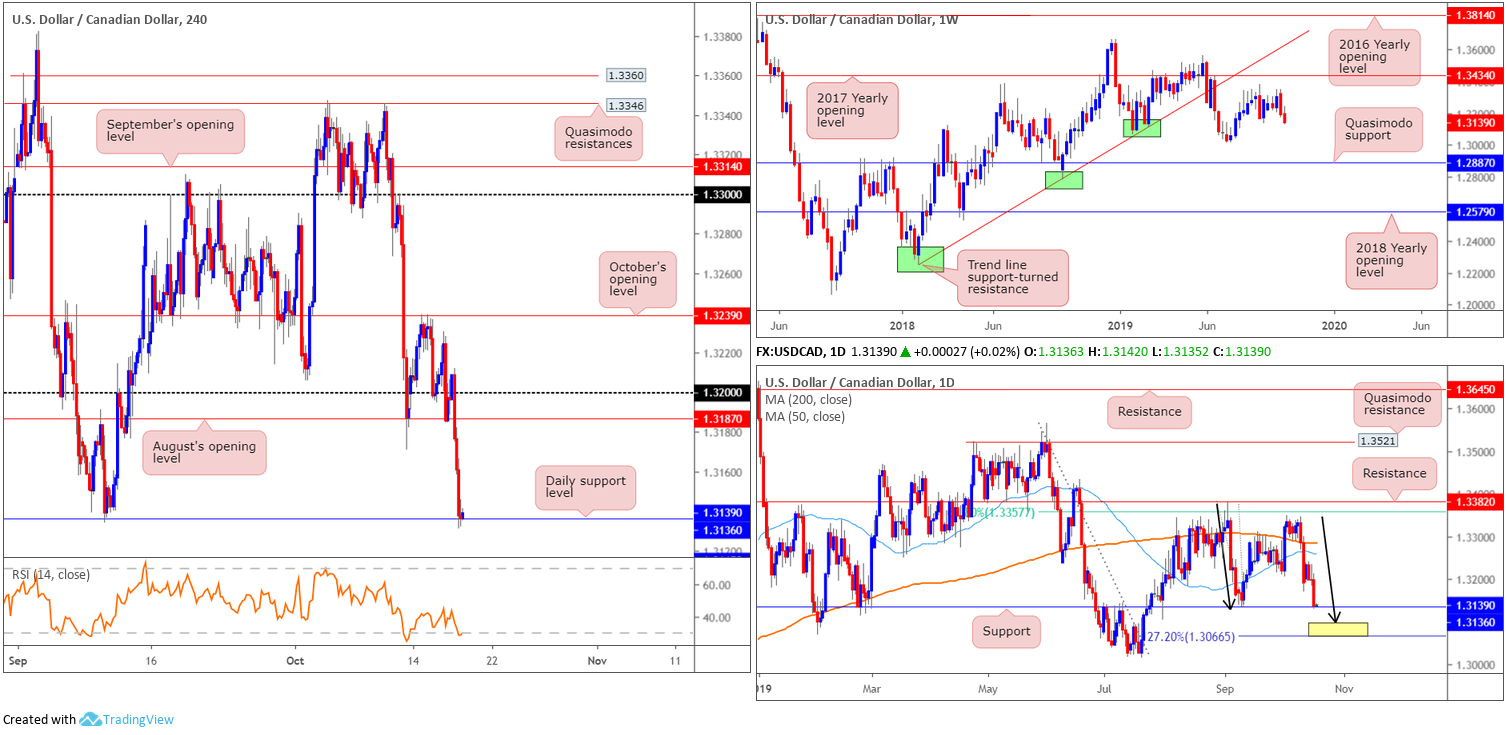
USD/CAD:
The USD/CAD concluded sharply lower Thursday, breaking through 1.32 and August’s opening level at 1.3187 on the H4 scale. Upbeat manufacturing sales out of Canada, rising WTI prices and lower-than-expected US industrial production collectively weighed on the pair, consequently guiding the unit to daily support at 1.3136 into the close. Beyond this level, traders’ crosshairs are likely fixed on Quasimodo support at 1.3115, followed by the 1.31 handle (not visible on the screen).
As can be seen from the daily timeframe, 1.3136 boasts reasonably strong historical significance. The 200-day SMA (orange – 1.3284) is slightly tilting north, while the 50-day SMA (blue – 1.3258) is currently facing south. In addition, beneath 1.3136, we also have a potential ABCD (black arrows) reversal zone (yellow) in view between a 127.2% Fibonacci extension point at 1.3066 and the tip of the ABCD correction at 1.3096.
Following last week’s bearish engulfing candle, sellers are finally making an appearance. Support is visible in the form of the 1.3015 July 15 low, followed by Quasimodo support stationed at 1.2887. The primary trend in this market has remained north since bottoming in September 2017. Currently, though, we appear to be in a secondary downtrend, with the peak set at 1.3661.
Areas of consideration:
Searching for long opportunities off the current daily support at 1.3136 is likely of interest to some traders this morning. Entering long without additional candlestick confirmation, however, is considered a chancy move. This is due to weekly price suggesting further selling to 1.3015 may be in store, and the daily ABCD correction completes just beneath it around 1.3066/1.3096. Therefore, failure at 1.3136 opens potential buying opportunities at the 1.31 handle, sited just north of the said daily ABCD correction.
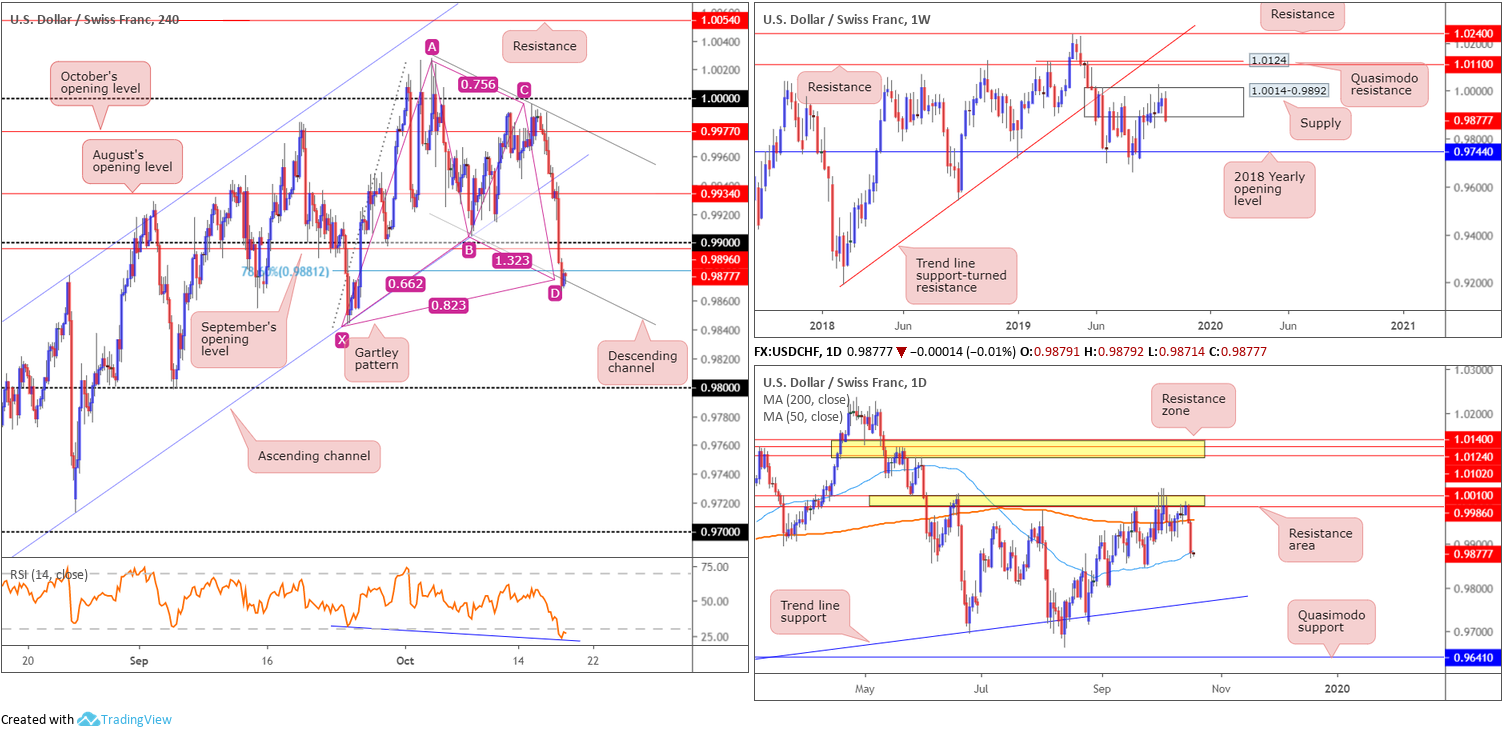
USD/CHF:
The US dollar continued to sag against the Swiss franc Thursday, settling at three-week lows. Weighed by persistent USD selling bias and disappointing US macroeconomic data, August’s opening level at 0.9934 on the H4 timeframe gave way, followed shortly after by a break of 0.99 and September’s opening level at 0.9896. The move concluded at channel support taken from the low 0.9659, shaped in the form of a Gartley pattern, terminating at 0.9881. It might also be worth noting the relative strength index is seen trading within oversold territory and currently producing hidden bullish divergence (blue line).
Elsewhere, activity on the weekly timeframe shows signs of life emerging out of supply coming in at 1.0014-0.9892. Additional selling from this point has the 2018 yearly opening level at 0.9744 to target. According to the primary trend, price reflects a somewhat bullish tone. However, do remain aware we have been rangebound since the later part of 2015 (0.9444/1.0240). The resistance area (yellow) stationed on the daily timeframe at 1.0010/0.9986 remains a prominent structure, which held price action lower Wednesday and prompted further downside yesterday, sealing a position beneath the 200-day SMA (orange – 0.9955) and drawing the unit towards the 50-day SMA (blue – 0.9884).
Areas of consideration:
A long based on the recently completed H4 Gartley pattern, with protective stop-loss orders plotted below the X point of the formation at 0.9843, is certainly worthy of consideration. Ultimately traders will likely be looking for a swift up move from this region, closing back above 0.99. This is due to the threat of further selling on the weekly timeframe.
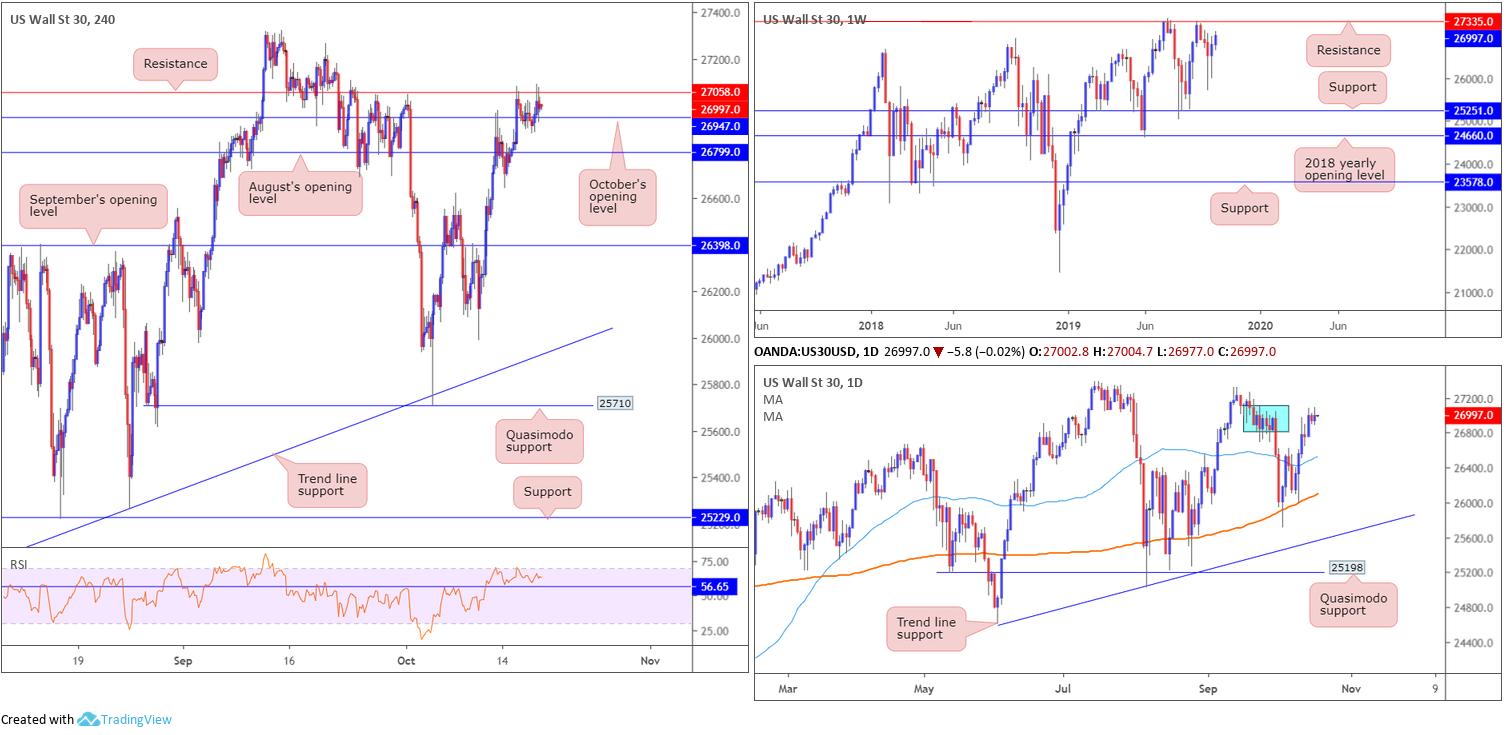
Dow Jones Industrial Average:
(Italics represent previous analysis).
A broad-based advance led all three major US stock averages to moderate gains Thursday, bolstered by encouraging geopolitical developments. The Dow Jones Industrial Average gained 23.90 points, or 0.09%; the S&P 500 also added 8.26 points, or 0.28%, and the tech-heavy Nasdaq 100 climbed 21.93 points, or 0.28%.
Chart studies, on the other hand, reveals price action remains mostly unmoved on the Dow. October’s opening level at 26947 on the H4 timeframe continues to draw support, though is hampered by resistance at 27058. Above 27058, limited supply is evident; therefore, a break of this level could signify a violation of daily supply at 27110-26813 may be on the cards along with a run towards weekly resistance at 27335.
Weekly price shows the ducks are being lined up for a possible approach towards weekly resistance at 27335, sited only a few points south of the all-time high 27388. Despite a minor setback to 21452, the primary trend in this market remains facing northbound.
Research on the daily timeframe places a bold question mark on supply between 27110-26813 (blue – positioned just south of weekly resistance at 27335), having seen limited downside attempts since the unit tested the area late last week. It may also interest some traders to note the 200/50-day SMAs both continue to face north.
Areas of consideration:
Outlook unchanged.
A H4 close above 27058 will highlight potential bullish scenarios to weekly resistance at 27335. Conservative traders will likely require at least a retest of 27058 to play out before pulling the trigger (entry and risk can then be measured off the rejection candle’s structure).
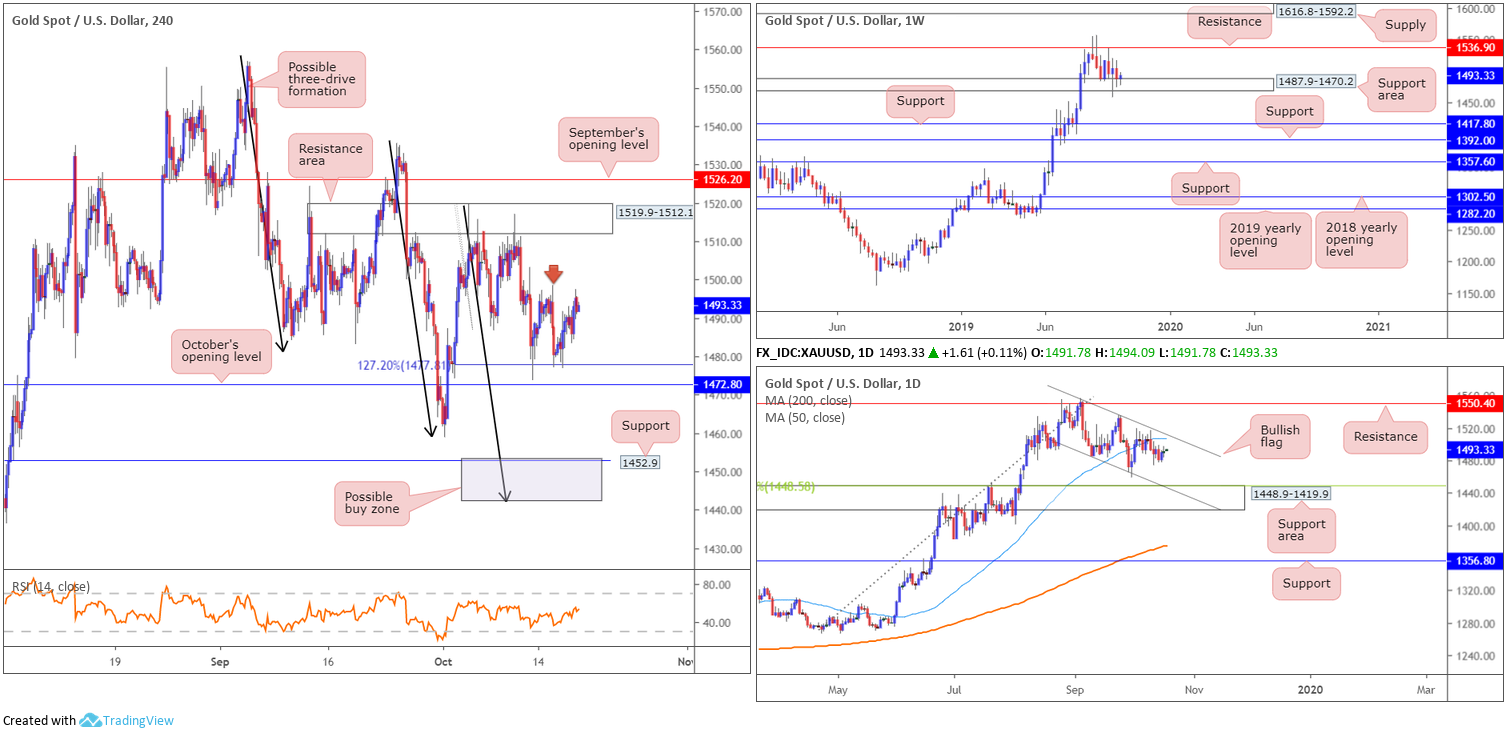
XAU/USD (GOLD):
(Italics represent previous analysis).
Since the beginning of the week, gold, in $ terms, has been entrenched within a reasonably tight range (1498.4/1477.2). Wednesday saw increased demand for the yellow metal, with Thursday also pushing mildly higher.
As evident from the H4 timeframe, the candles established support off the 127.2% Fibonacci extension point at 1477.8, which happens to be closely shadowed by October’s opening level at 1472.8. Beyond here, the October 1st low 1458.9 is in sight, followed by support coming in at 1452.9 as well as a possible three-drive formation (black arrows) at 1442.1 (grey zone).
In terms of the overall technical picture, weekly price trades mildly higher on the week, engaging with a support area at 1487.9-1470.2. To the upside, resistance is seen at 1536.9, whereas two layers of support are visible at 1392.0 and 1417.8 in the event we push for lower ground. In terms of the longer-term primary trend, gold has been trading northbound since the later part of 2015.
Daily flow shows a bullish flag has been in motion since early September (1557.1/1485.3). Last week saw the unit cross beneath its 50-day SMA (blue – 1506.7), consequently opening downside to a possible test of a support area coming in at 1448.9-1419.9 (which happens to have its upper edge bolstered by a 38.2% Fibonacci ratio 1448.5 and a channel support [taken from the low 1485.3]).
Areas of consideration:
In essence, the unit remains entrenched within a long-term uptrend, though shows signs of weakness at the current weekly support area, particularly following the breach of its lower edge two weeks ago. Daily price demonstrates the market has room to press lower until reaching a support area at 1448.9-1419.9. H4 price is testing Fibonacci (ext.) support at 1477.8, with October’s opening level at 1472.8 sited as the next point of interest. The grey zone between 1442.1/1452.9 is considered a potential buy zone, given it is formed by reasonable H4 support and a possible three-drive formation (black arrows), as well as being located within the said daily support area.
Should H4 price remain defensive north of 1477.8, however, and we break through 1498.4 (red arrow), further upside towards 1519.9-1512.1, and possibly September’s opening level at 1526.2, could be in store.
The accuracy, completeness and timeliness of the information contained on this site cannot be guaranteed. IC Markets does not warranty, guarantee or make any representations, or assume any liability regarding financial results based on the use of the information in the site.
News, views, opinions, recommendations and other information obtained from sources outside of www.icmarkets.com.au, used in this site are believed to be reliable, but we cannot guarantee their accuracy or completeness. All such information is subject to change at any time without notice. IC Markets assumes no responsibility for the content of any linked site.
The fact that such links may exist does not indicate approval or endorsement of any material contained on any linked site. IC Markets is not liable for any harm caused by the transmission, through accessing the services or information on this site, of a computer virus, or other computer code or programming device that might be used to access, delete, damage, disable, disrupt or otherwise impede in any manner, the operation of the site or of any user’s software, hardware, data or property.


