
A note on lower-timeframe confirming price action…
Waiting for lower timeframe confirmation is our main tool to confirm strength within higher timeframe zones, and has really been the key to our trading success. It takes a little time to understand the subtle nuances, however, as each trade is never the same, but once you master the rhythm so to speak, you will be saved from countless unnecessary losing trades. The following is a list of what we look for:
- A break/retest of supply or demand dependent on which way you’re trading.
- A trendline break/retest.
- Buying/selling tails/wicks – essentially we look for a cluster of very obvious spikes off of lower timeframe support and resistance levels within the higher timeframe zone.
- Candlestick patterns. We tend to stick with pin bars and engulfing bars as these have proven to be the most effective.
We typically search for lower-timeframe confirmation between the M15 and H1 timeframes, since most of our higher-timeframe areas begin with the H4. Stops are usually placed 3-5 pips beyond confirming structures.
EUR/USD:
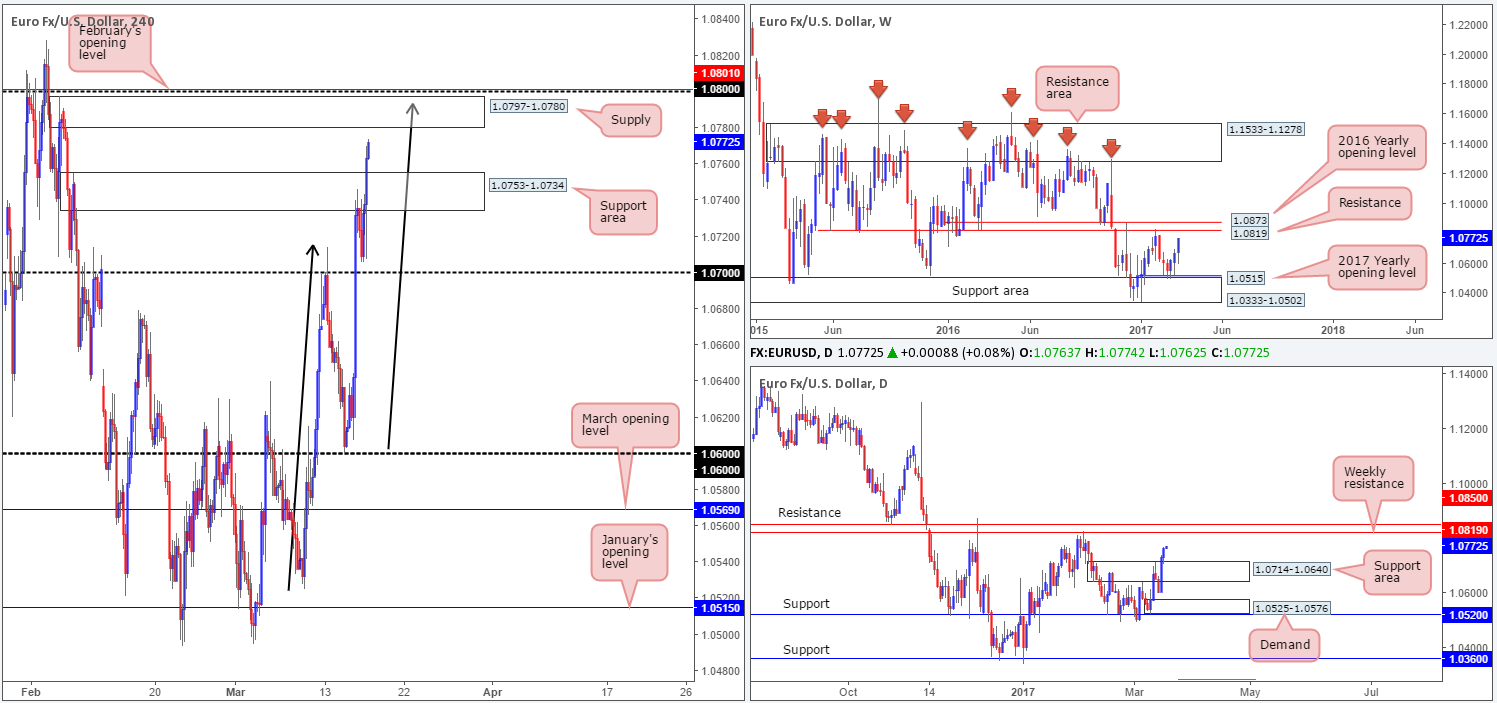
The single currency is marginally stronger today after the pair endured and finally conquered the H4 supply zone at 1.0753-1.0734. In view of the unit’s close proximity to a H4 supply at 1.0797-1.0780, what’s likely in store for this major today? Well, the current H4 supply is a rather interesting barrier. Not only does it boast February’s opening level at 1.0801 and the 1.08 handle a few pips above, but it also houses a possible H4 AB=CD (black arrows) bearish completion point (0.0793) taken from the low 1.0525.
What’s also notable from a technical perspective is the weekly resistance hurdle drawn from 1.0819. This is, on both the weekly and daily charts, the next upside target in view. As such, for traders interested in shorting from the aforementioned H4 supply area will need to prepare for the possibility of a fakeout up to this weekly level!
Our suggestions: Rather than placing a pending sell order within our current H4 supply and setting a stop in order to try and cover the possibility of a fakeout, our desk has decided to wait and see if the fakeout occurs before entering this market. In the event that our analysis is correct and the fakeout does indeed take place, we may look to enter on the close of the fakeout candle and place stops beyond its high. It could prove to be one of those monster trades given that we’re dealing with the weekly timeframe, so it is certainly worth the wait!
Data points to consider: US prelim UoM consumer sentiment at 2pm GMT.
Levels to watch/live orders:
- Buys: Flat (stop loss: N/A).
- Sells: 1.0797-1.0780 ([wait for price to fake above this area to 1.0819 before considering shorts] stop loss: ideally beyond the fakeout candle).
GBP/USD:
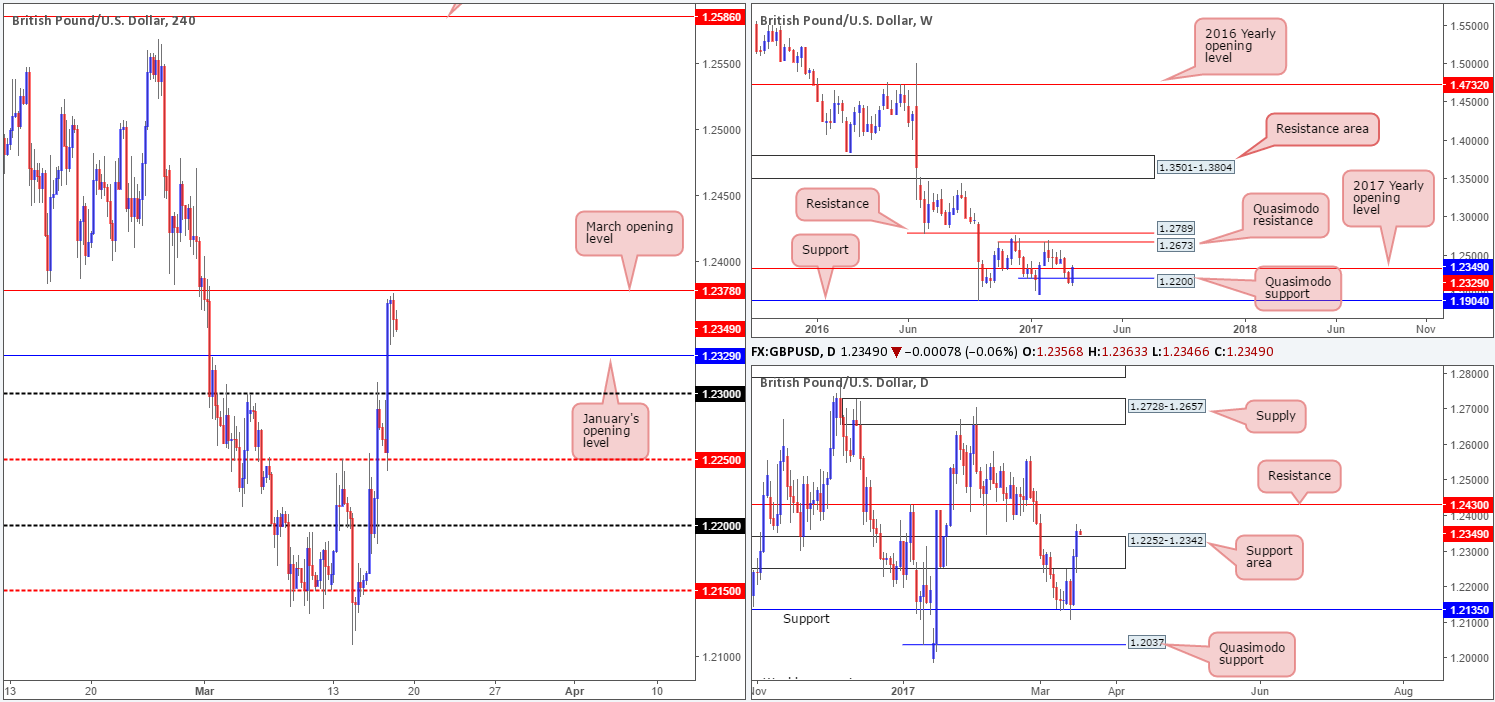
GBP bulls rose up and took charge after retesting the H4 mid-way level at 1.2250 during London’s lunchtime. The explosive move from this number was fuelled by a surprisingly hawkish BoE. January’s opening base line at 1.2329 was taken out in one fell swoop, with the pair only starting to show a sign of stabilizing once price came within striking distance of March’s opening line at 1.2378. What this latest advance also accomplished was a close above the daily resistance area at 1.2252-1.2342 (now a potential support zone), which may open the gates for price to challenge daily resistance at 1.2430.
Our suggestions: Until we witness a weekly close beyond January’s opening level, we are not giving the recent daily break much acknowledgment. However, at the same time we are not willing to risk trading short based on this! With that being the case, we feel it’s best to remain on the sidelines today and reassess going into the new week.
Data points to consider: US prelim UoM consumer sentiment at 2pm GMT.
Levels to watch/live orders:
- Buys: Flat (stop loss: N/A).
- Sells: Flat (stop loss: N/A).
AUD/USD:
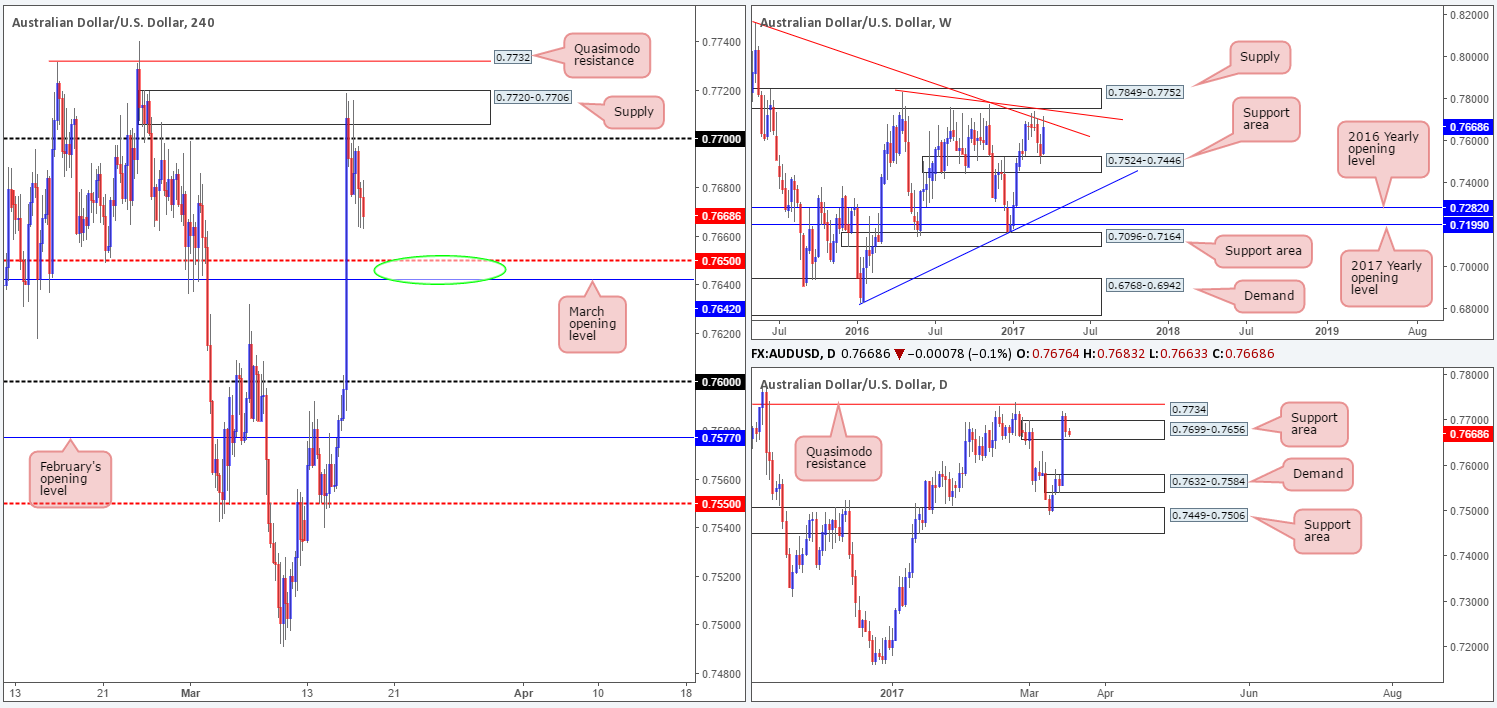
Australian employment figures came in lower than expected yesterday, consequently sending the pair south. As a result of this, the H4 candles failed to sustain gains beyond the 0.77 handle, whilst the H4 supply at 0.7720-0.7706 remained intact.
Seeing as how daily action continues to trade within the walls of a daily support area seen at 0.7699-0.7656, and weekly price appears to be showing a sign of weakness after connecting with the weekly trendline resistance stretched from the high 0.8163, trading from current price is tricky, in our opinion.
While there’s a possibility of a bounce being seen from the nearby 0.7642/0.7650 neighborhood (green circle – March opening line and H4 mid-way support), we still have a keen interest in the H4 Quasimodo resistance seen beyond the current H4 supply at 0.7732.
Our suggestions: 0.7732 converges closely with a daily Quasimodo resistance line at 0.7734, and is also positioned nearby weekly supply at 0.7849-0.7752, which happens to merge nicely with another weekly trendline resistance taken from the high 0.7835. As highlighted in yesterday’s report, we would, dependent on the time of day, likely look to go in aggressive at 0.7732 and place stops above the apex high at 0.7740. However, given the current distance from this barrier, this may be a level for next week.
Data points to consider: US prelim UoM consumer sentiment at 2pm GMT.
Levels to watch/live orders:
- Buys: Flat (stop loss: N/A).
- Sells: 0.7732 (Stop loss: 0.7742).
USD/JPY:
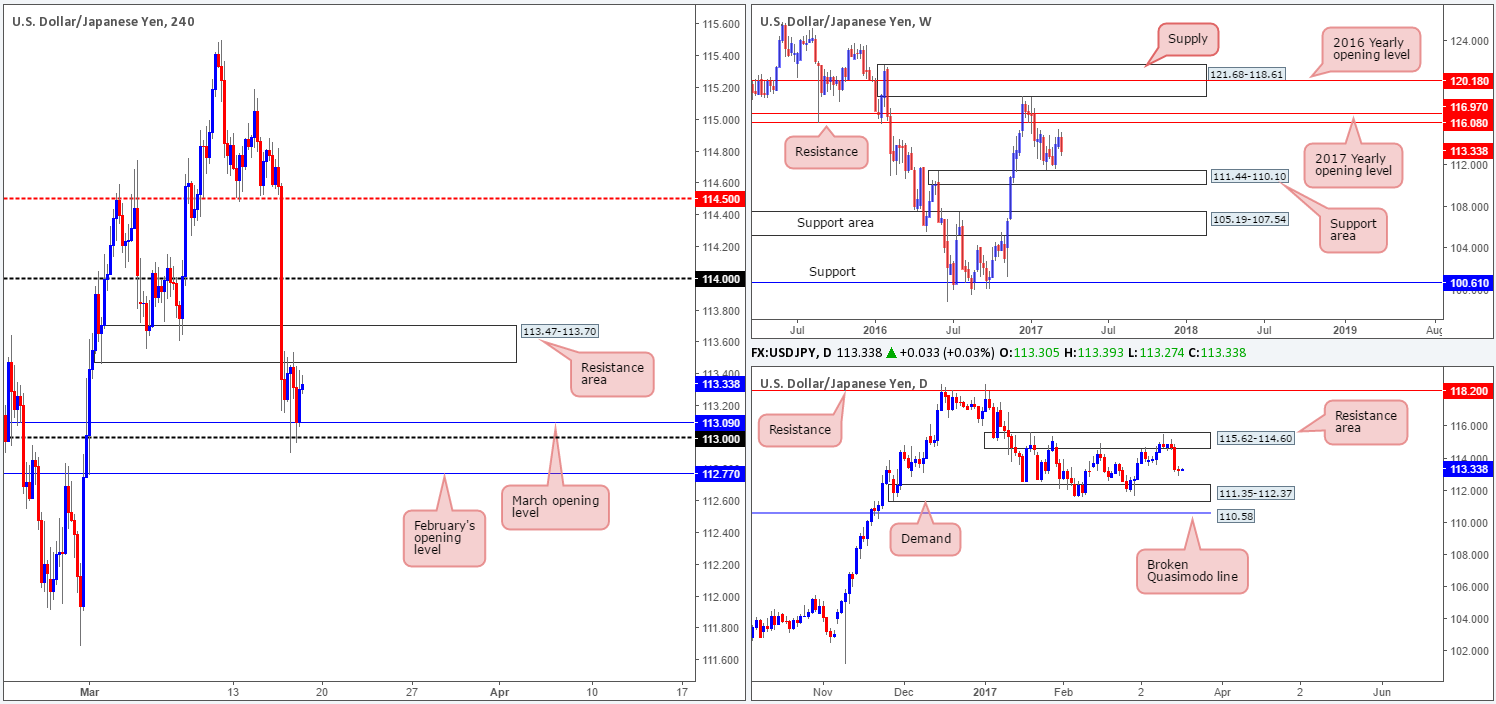
Despite Wednesday’s aggressive selloff, the USD/JPY pair was reasonably lackluster during the course of yesterday’s sessions. Looking at the H4 structure this morning, we can see that the H4 candles are capped between a H4 resistance area 113.47-113.70 and the 1.08 handle/ March opening level at 113.09. Looking over to the bigger picture, both the weekly and daily charts indicate room to extend lower this week. The closest support structure can be seen at 111.35-112.37: a daily demand zone which sits around the top edge of a weekly support area drawn from 111.44-110.10.
Our suggestions: Despite the higher-timeframe picture suggesting that shorts are the best bet, there’s little wiggle room seen beyond the current H4 range as February’s opening level at 112.77 sits nearby! Consequent to this, we do not see a lot to hang our hat on at the moment.
Data points to consider: US prelim UoM consumer sentiment at 2pm GMT.
Levels to watch/live orders:
- Buys: Flat (stop loss: N/A).
- Sells: Flat (stop loss: N/A).
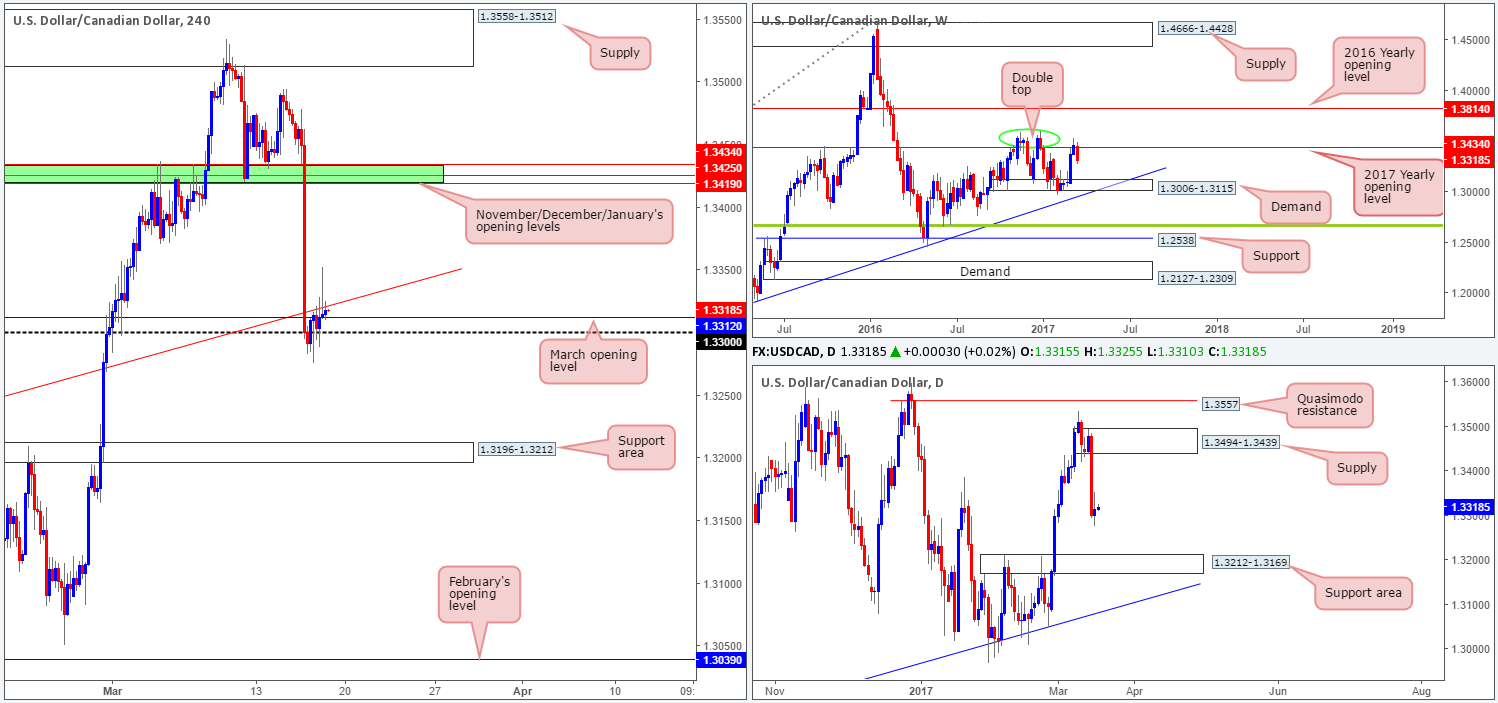
USD/CAD:
The USD/CAD took on more of a subdued stance yesterday, following Wednesday’s aggressive selloff. Despite the pair catching fresh bids from the 1.33 neighborhood, the nearby H4 trendline resistance extended from the high 1.3171 has done a superb job in holding the unit lower.
As far as we’re concerned, other than the 1.33 boundary, there’s very little support structure seen in this market until we connect with the H4 support area coming in at 1.3196-1.3212 (fixed within a daily support area at 1.3212-1.3169). To that end, our team is ultimately looking to sell beyond 1.33 today.
Our suggestions: Supposing that we happen to see a H4 close print below 1.33 followed up with a retest as resistance, and a reasonably sized H4 bearish candle, we will be all over this, targeting the aforementioned H4 support area.
Data points to consider: US prelim UoM consumer sentiment at 2pm. Canadian manufacturing sales at 12.30pm GMT.
Levels to watch/live orders:
- Buys: Flat (stop loss: N/A).
- Sells: Watch for price to engulf 1.33 and then look to trade any retest seen thereafter ([waiting for a reasonably sized H4 bear candle to form following the retest is advised before pulling the trigger] stop loss: ideally beyond the trigger candle).
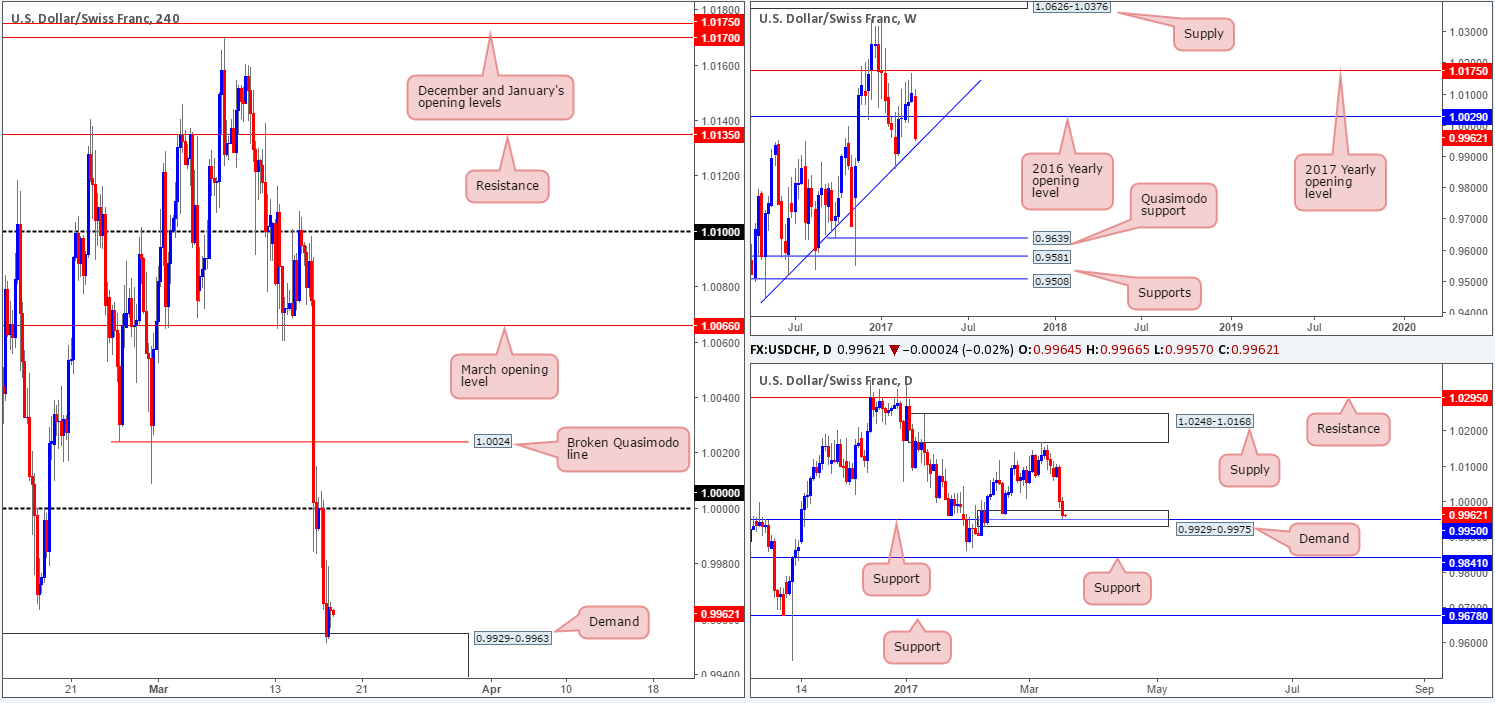
USD/CHF:
Beginning with a look at the weekly chart this morning, price is currently seen within touching distance of the weekly trendline support etched from the low 0.9443. Along the same vein, daily flow recently came within an inch of connecting with daily support at 0.9950, which is seen fixed within daily demand at 0.9929-0.9975.
Swinging across to the H4 chart, we can see that price has also shaken hands with a H4 demand base coming in at 0.9929-0.9963. As this demand sits within the confines of the current daily demand which also intersects beautifully with the above noted weekly trendline support, we have a keen interest in buying this market.
Our suggestions: Ideally, before we look to press the buy button here, however, we’d like to see the weekly trendline support tested. Assuming that a reasonably sized H4 bull candle forms off this line, this will be our cue to enter long, as by that point all three timeframes will be trading in unison.
Data points to consider: US prelim UoM consumer sentiment at 2pm GMT.
Levels to watch/live orders:
- Buys: 0.9929-0.9963 ([waiting for a reasonably sized H4 bull candle to form off the current weekly trendline support is advised before pulling the trigger] stop loss: ideally beyond the trigger candle).
- Sells: Flat (stop loss: N/A).
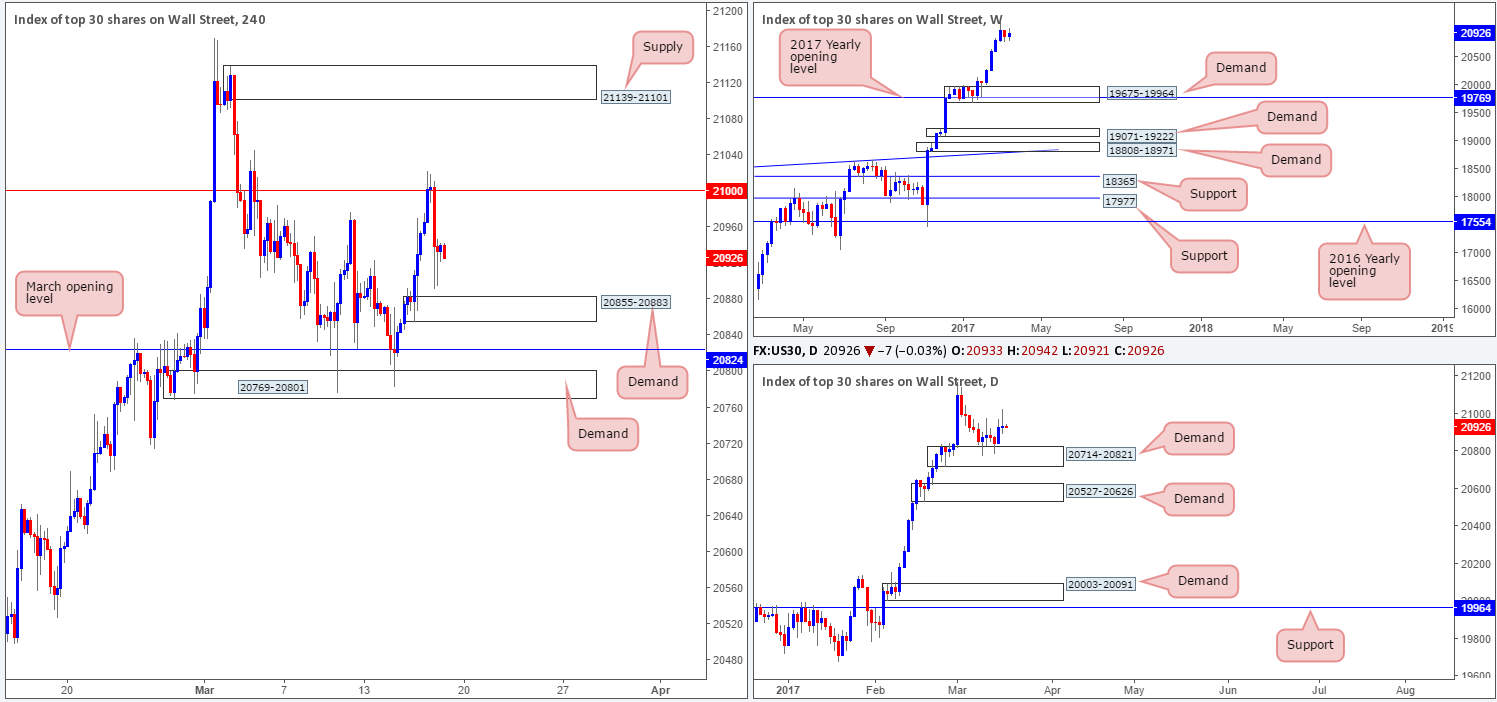
DOW 30:
Although price closed marginally higher yesterday, US equities did selloff from the 21000 mark and came within an inch of clipping the top edge of a H4 demand base pegged at 20855-20883. Even though both the weekly and daily charts show little resistance on the horizon, we still cannot afford to buy this market just yet. Once, or indeed if, the 21000 H4 resistance is conquered, we will then have a relatively free run up until the H4 supply zone picked at 21139-21101.
Our suggestions: Quite simply, we’re still watching for a H4 close to print beyond the 21000 perimeter. In the event that this comes into view, and price retests 21000 as support and prints a reasonably sized H4 bull candle, we would consider entering long from here, targeting the aforementioned H4 supply and possibly beyond.
Data points to consider: US prelim UoM consumer sentiment at 2pm GMT.
Levels to watch/live orders:
- Buys: Watch for price to engulf 21000 and then look to trade any retest seen thereafter ([waiting for a reasonably sized H4 bull candle to form following the retest is advised before pulling the trigger] stop loss: ideally beyond the trigger candle).
- Sells: Flat (stop loss: N/A).
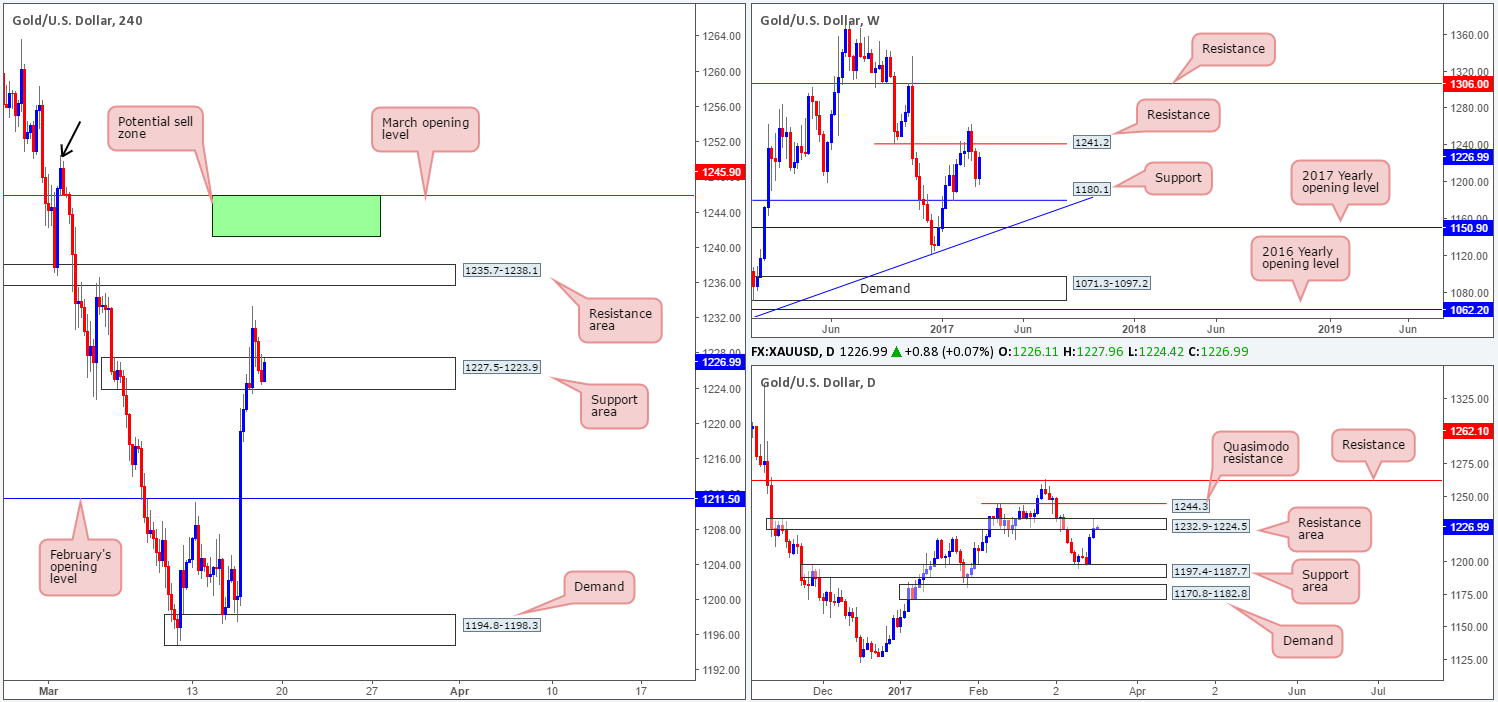
GOLD:
In recent trading, the yellow metal sold off from a session high of 1233.4 and ended the day closing within the walls of a H4 support zone at 1227.5-1223.9. While it may be tempting to buy from this region, one must remain cognizant of the daily candles trading within a daily resistance area coming in at 1232.9-1224.5. On the other side of the ledger, nevertheless, weekly still price looks poised to extend north up to the 1241.2 resistance level.
Although a buy from the current H4 support area is not something we’d label high probability, a sell from the daily Quasimodo resistance level at 1244.3 most certainly is. Not only is this barrier a strong line in and of itself, let’s also remember that it is positioned nearby a weekly resistance line seen a little lower at 1241.2 and March’s opening level at 1245.9.With that being the case, we have a potential reversal zone fixed between 1245.9/1241.2 (green area on the H4 chart).
Our suggestions: 1245.9/1241.2 is our only area of interest this morning. To be on the safe side here, nonetheless we would strongly advise placing stops above 1250.5 (H4 supply high marked with a black arrow).
Levels to watch/live orders:
- Buys: Flat (stop loss: N/A).
- Sells: 1245.9/1241.2 region (stop loss: 1251.5).


