
EUR/USD:
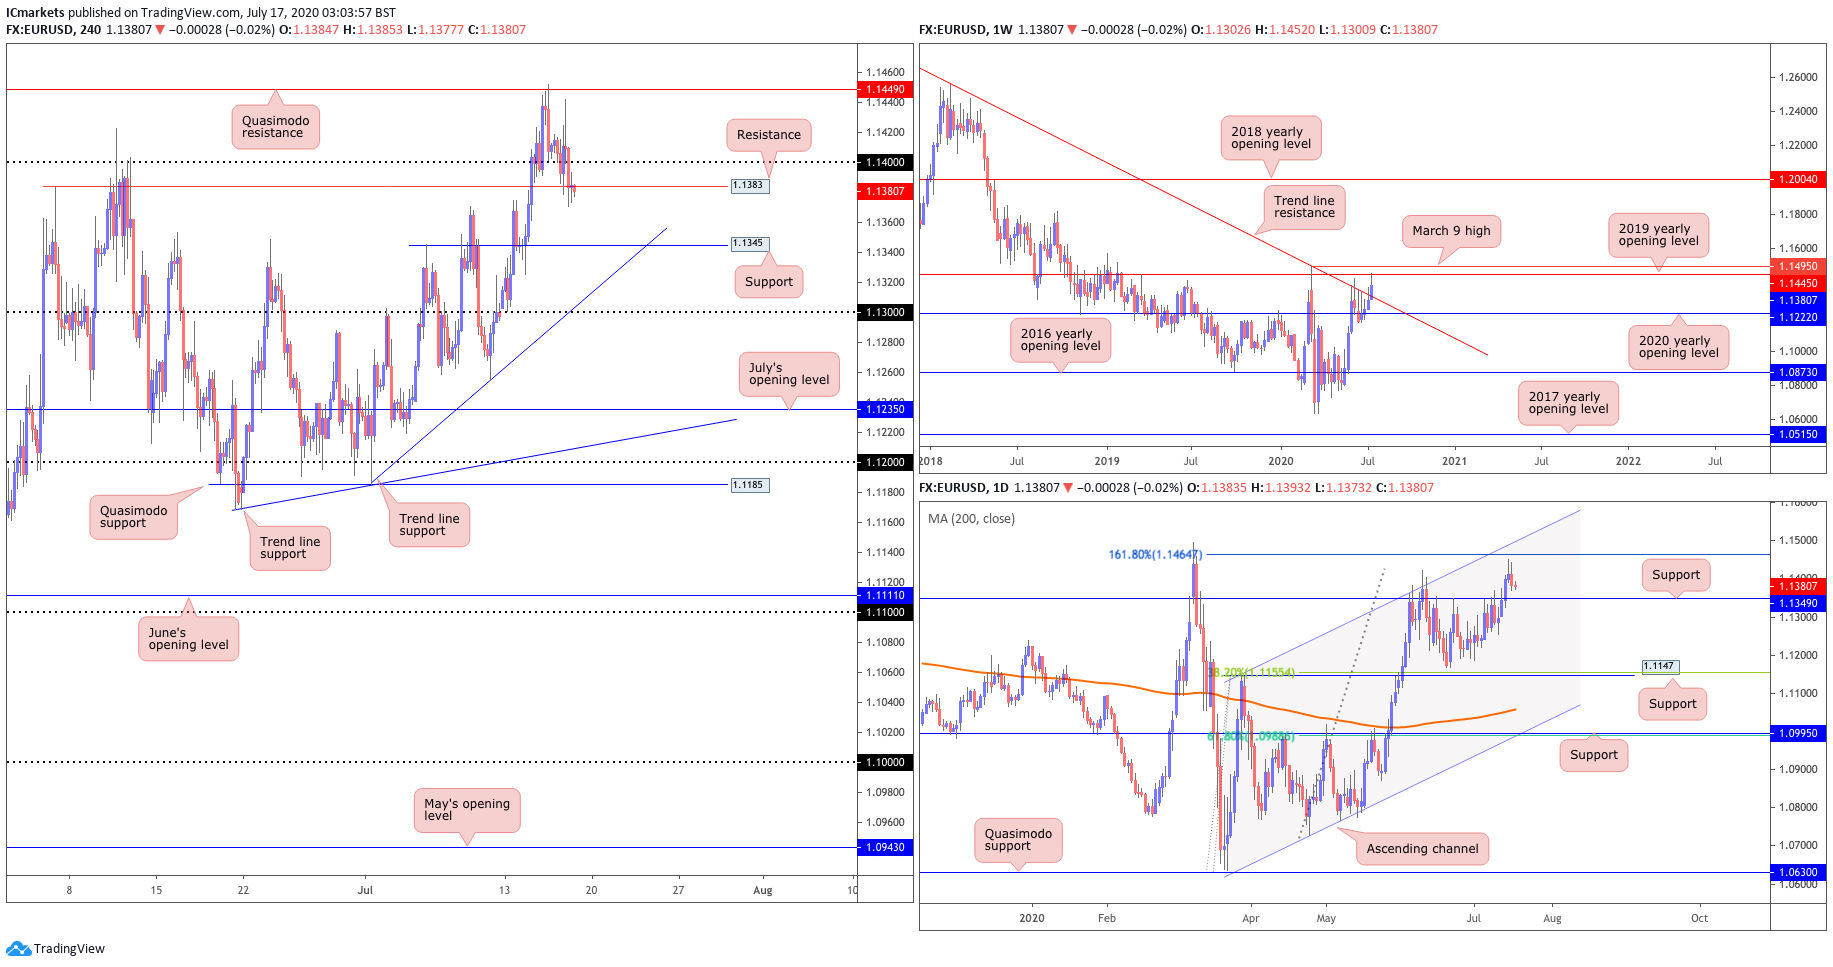
On the H4 timeframe, prices broke a key support-turned-resistance level at 1.1383 where we could see a further drop to our next support level at 1.1345.
Further afield, we see weekly price recently trekked above long-term trend line resistance, extended from the high 1.2555, and shook hands with the 2019 yearly opening level at 1.1445. With respect to the overall trend, the pair remains southbound until breaking the 1.1495 March 9 high.
A closer reading of price action on the daily timeframe reveals the pair topped ahead of a 161.8% Fibonacci extension point at 1.1464, positioned nearby channel resistance, extended from the high 1.1147.
Areas of consideration:
Prices closed below a key support-turned-resistance level at 1.1383 on our H4 timeframe and it opens room for more downside to test our next support level at 1.1345. In line with our bearish view on the weekly and daily timeframes, which showed that prices are near key resistance levels and faced bearish pressure from our descending trend line on the weekly chart as well.
Sellers short weekly resistance now face support at 1.1345 on the H4, which may have some traders reduce risk to breakeven. Given that the view on the larger time frames is bearish, a break of the 1.1345 key support level could see a further drop to test the 1.1300 level which is also a round number. Conservative traders will likely find a retest at the underside of 1.14/1.1383 particularly appealing.
GBP/USD:
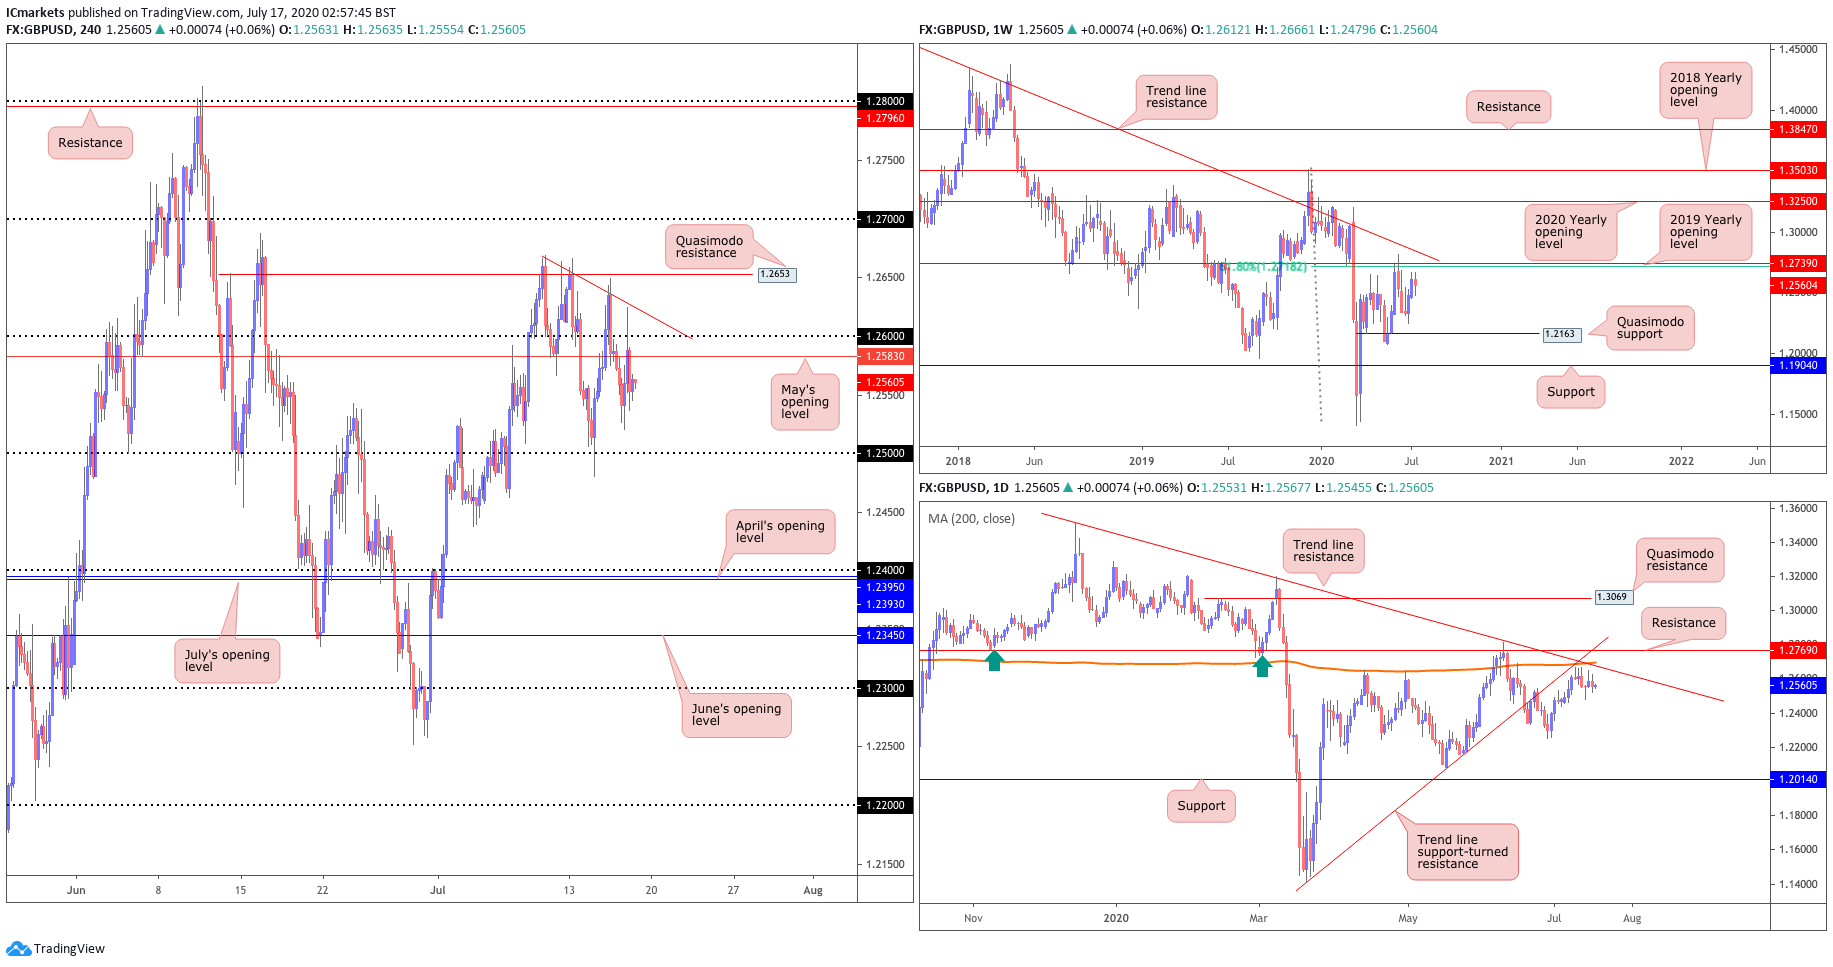
GBP/USD has been tracking lower after a reversal off our Quasimodo resistance at 1.2653 on the H4 timeframe.
From the weekly timeframe, following two consecutive weeks of gains, we can see the unit has price located within touching distance of considerable resistance, made up of a 61.8% Fibonacci retracement ratio at 1.2718 and the 2019 yearly opening level at 1.2739.
Movement on the daily timeframe, meanwhile, consolidates just south of substantial resistance, made up of trend line support-turned resistance, taken from the low 1.1409, another trend line resistance, extended from the high 1.3514, the 200-day SMA (orange – 1.2692) and resistance at 1.2769. This resistance combination also boasts a connection to the aforementioned weekly resistances.
Across the page, H4 price is crossing swords with the upper edge of May’s opening level at 1.2583, after peaking a few pips ahead of Quasimodo resistance at 1.2653 before we saw a strong reversal below that level. Note the round number 1.26 lurks just north of current action. Prices are still holding below the throws an intraday bearish tone into the mix, targeting 1.25 as the next support level.
Areas of consideration:
Prices remain under bearish pressure from our 1.2583 resistance, in line with the May’s opening level and descending trend line on our H4 timeframe. A solid retest at the underside of 1.26/1.2583 could see a further drop to our 1.2500 support level.
AUD/USD:
Stalking risk sentiment, AUD/USD drifted sideways.
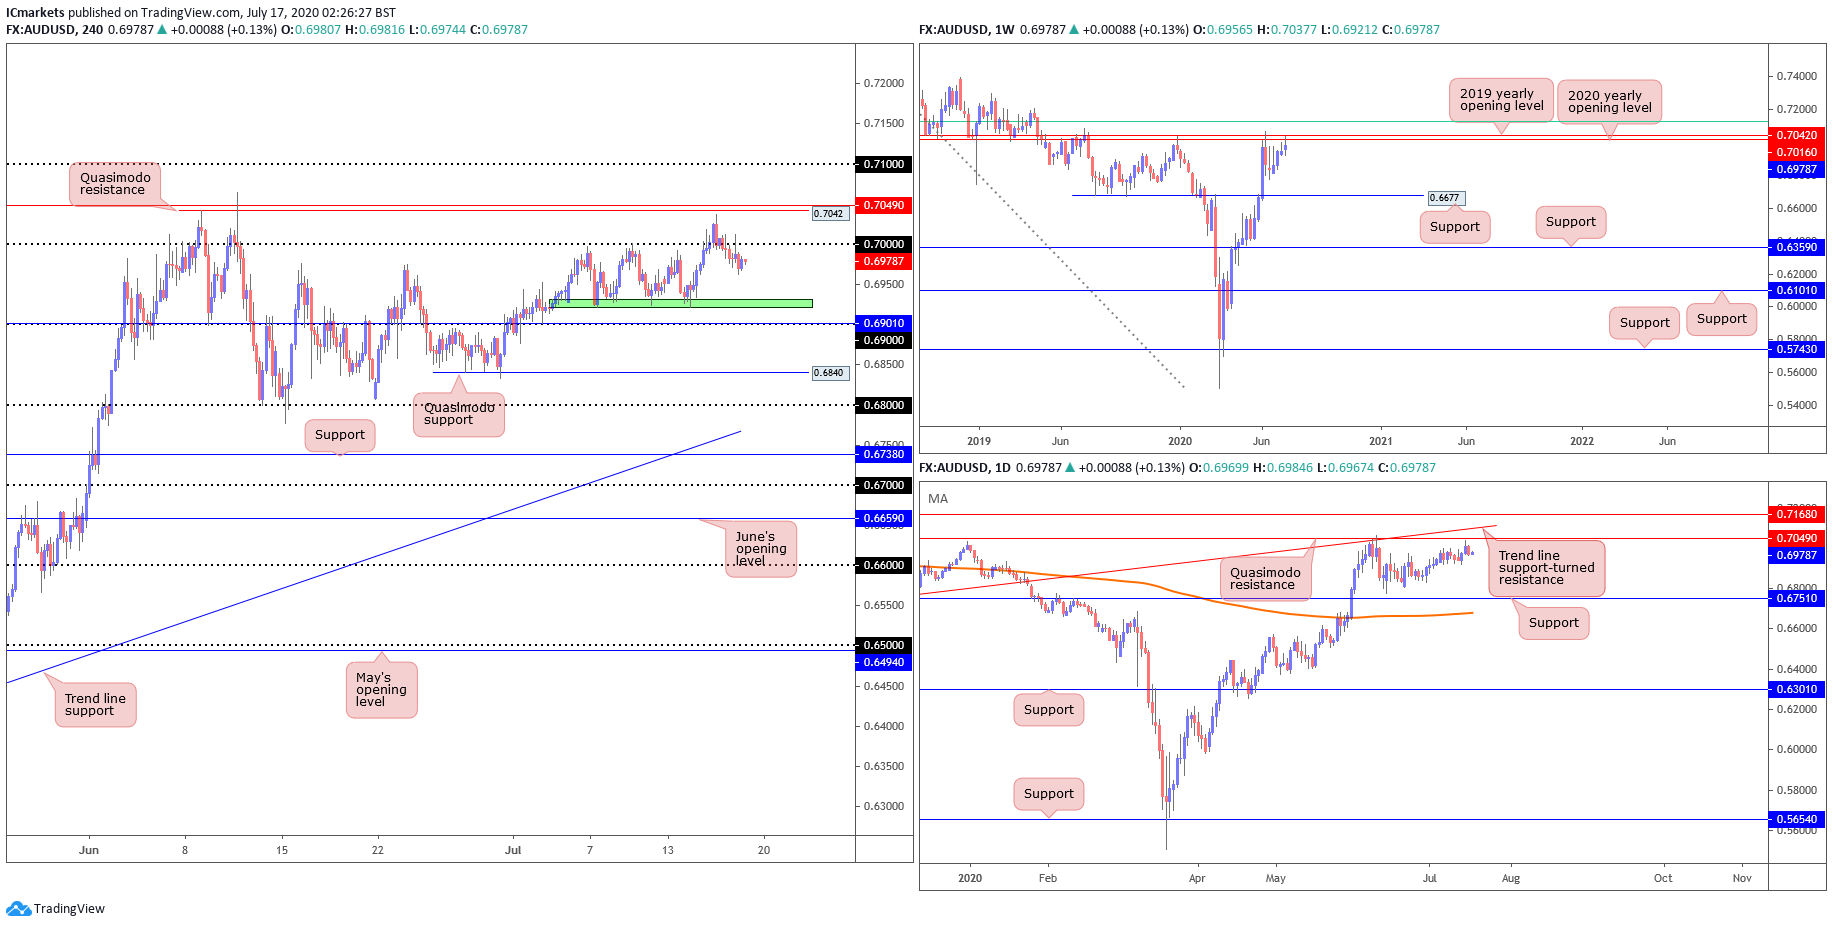
However, after reaching highs at 0.7037, a few pips under H4 Quasimodo resistance at 0.7042, the pair rotated southbound amid risk deterioration and even broke below key figure 0.70. As expected, the pullback back to H4 support around 0.6930ish (green), an area that has held since early July is currently in progress.
On the Weekly, resistance, forged in the shape of a 2020 yearly opening level and a 2019 yearly opening level, at 0.7016 and 0.7042, respectively, took hold in recent trading. It might also interest some traders to note just above the said resistances we have a 61.8% Fibonacci retracement ratio sited at 0.7128 (green). In terms of support on the weekly timeframe, crosshairs remain fixed on 0.6677.
A closer reading of candle action on the daily timeframe shows price recently tested levels just south of Quasimodo resistance positioned at 0.7049, a level linking with trend line support-turned resistance, taken from the low 0.6670. Another level worth noting is support coming in at 0.6751 and the 200-day SMA (orange – 0.6677).
Areas of consideration:
With price now below the 0.70 key figure, and no near term support levels to hold the drop, we can expect more breakout sellers, effectively shorting the breakout candle’s close. A H4 retest at 0.70 as resistance, preferably in the form of a H4 bearish candlestick, would also likely see additional shorts join the party to possibly push price down towards H4 support around 0.6930 zone (green)
USD/JPY:
The US dollar gained strength against the Japanese yen Friday, mostly tracking the US dollar index as it responds to risk sentiment.
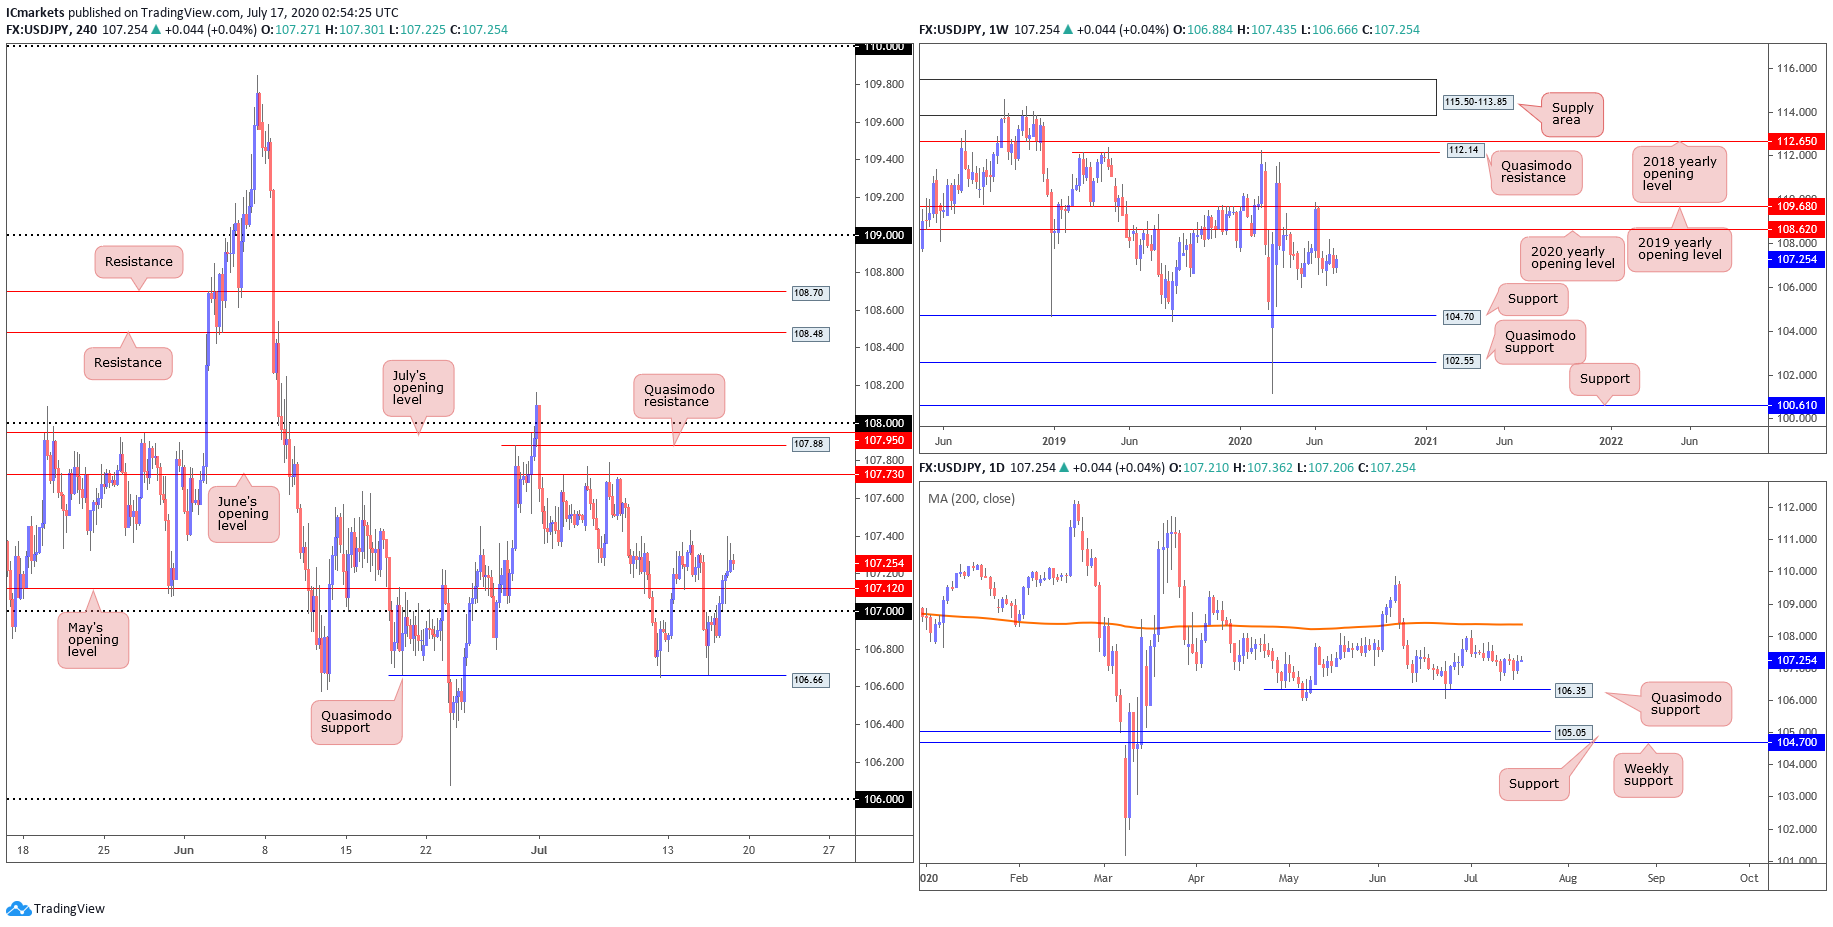
USD/JPY leapt through May’s opening level at 107.12 on the H4 timeframe and the 107 handle, clearing the pathway for familiar Quasimodo support coming in at 106.66. As price is testing the previous horizontal swing high at 107.40, it could open up more upside from there towards the June’s opening level at 107.73 if it could break above 107.40.
Further out on the weekly timeframe, price is seen consolidating beneath the 2020 yearly opening level at 108.62. Support, on the other hand, can be derived from the 105.98 6th May low, with a break uncovering long-term support plotted at 104.70. Technical structure on the daily time frame remains focused on Quasimodo support from 106.35 and the 200-day SMA (orange – 108.36), assuming we get past the 108.16 July 1st high.
Areas of consideration:
With respect to technical confluence, the 107 handle, aside from nearby support at 107.12 (May’s opening level [H4]) is somewhat lacking. With that being the case, conservative traders still interested in the resistance base may engage if additional confirmation is observed, a bearish candlestick formation, for example.
At the same time, if price manages to break above the previous swing high at 107.40, it will open up more upside for the pair towards June’s opening level at 107.73.
USD/CAD:
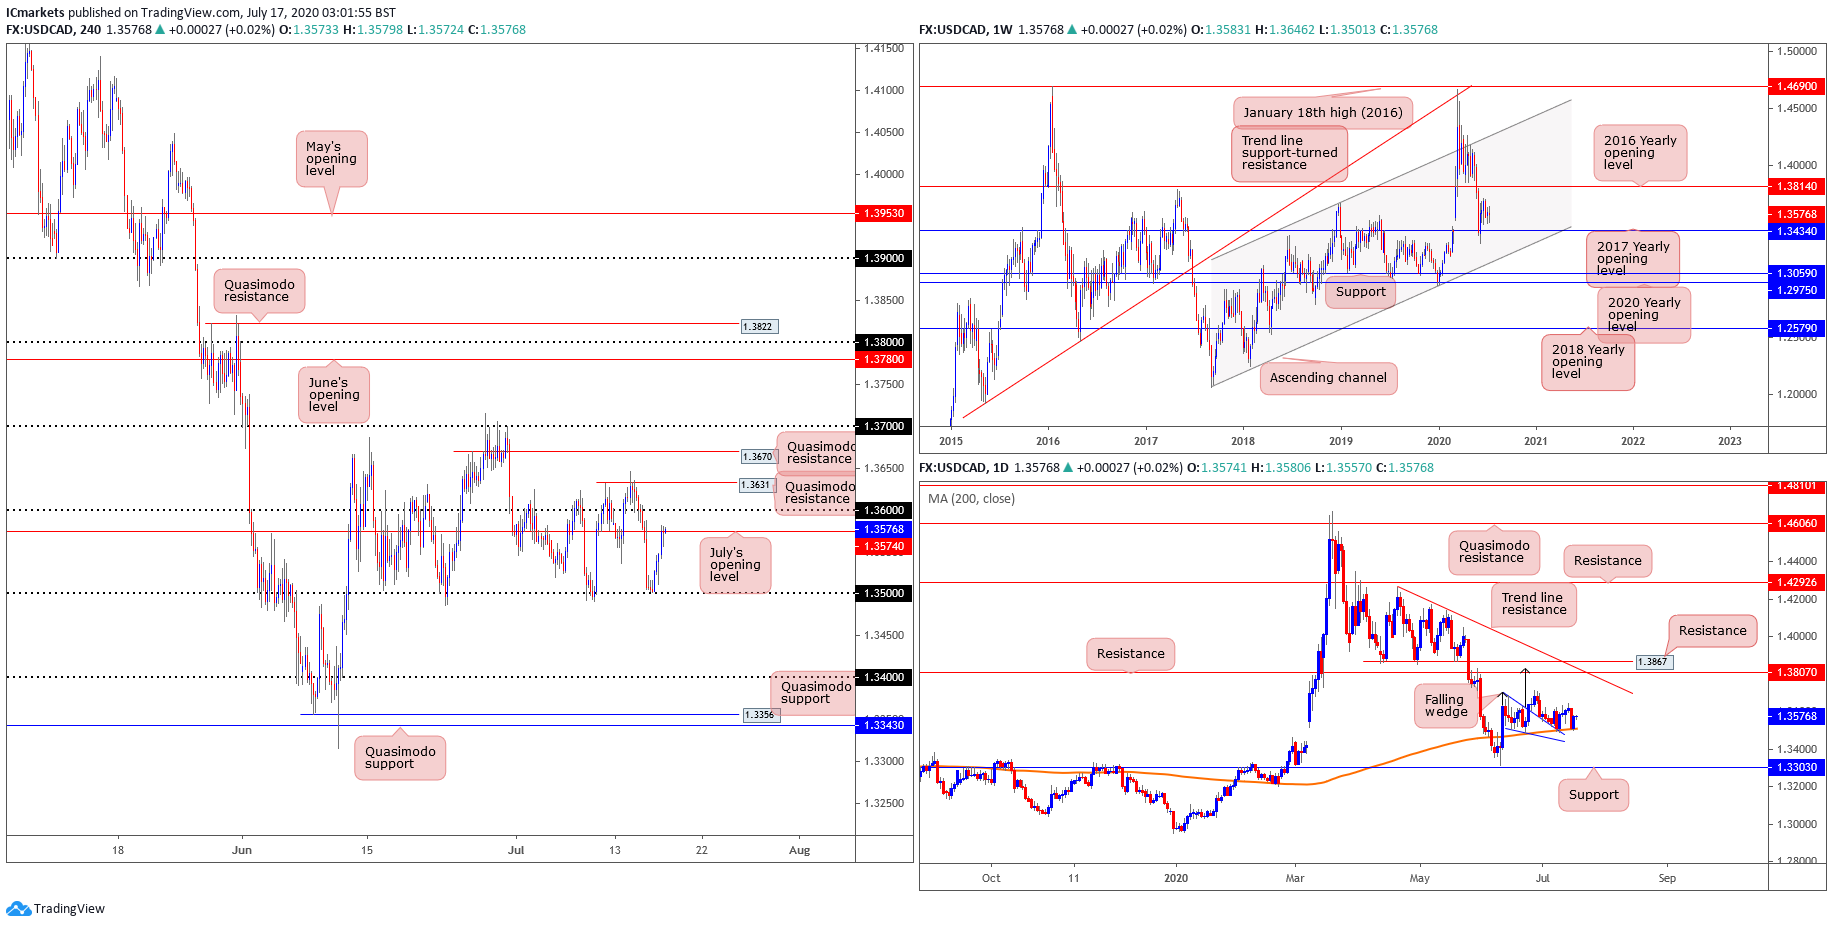
USD/CAD bounced higher from the key level at 1.350 and came back to July’s opening level. This is mostly due to the strengthening of the USD on the back of better than expected retail sales data despite disappointing jobless claims data.
As things stand, price is currently testing July’s opening level. A break above key level 1.36 could see price come back to retest Quasimodo resistance at 1.3631 and possibly even the next Quasimodo resistance at 1.3670. Otherwise, should price fail to break above 1.36, we might see the pendulum swing back towards 1.35 level on the H4.
Action on the weekly timeframe is currently stationed north of the 2017 yearly opening level at 1.3434. Beyond 1.3434, channel support, taken from the low 1.2061, can be viewed as the next potential floor. A USD/CAD bid throws the 2016 yearly opening level at 1.3814 in the pot as feasible resistance, with follow-through buying to try and tackle a dense block of supply between 1.4190/1.3912.
Technical movement on the daily timeframe shows price moving sideways however still holding above the 200-day SMA (1.3507). Should price recover, take-profit targets out of a falling wedge pattern can be measured by taking the base value and adding this figure to the breakout point (black arrows), which as you can see in this case, meets closely with resistance at 1.3807, followed by another layer of resistance at 1.3867.
Areas of consideration:
We watch closely key level resistance at 1.36 on the H4. A break above this resistance could possibly see a price run up to the next resistance at 1.3631 and possibly even towards the next key level at 1.37. Conservative traders, owing to the threat of fakeouts around psychological levels, may seek additional confirmation before pulling the trigger.
Otherwise, a failure to break above 1.36 could possibly see sellers make a showing and push price back down to 1.35 or even weekly support at 1.3434 (2017 yearly opening level) to target, followed by 1.34 on the H4.
USD/CHF:
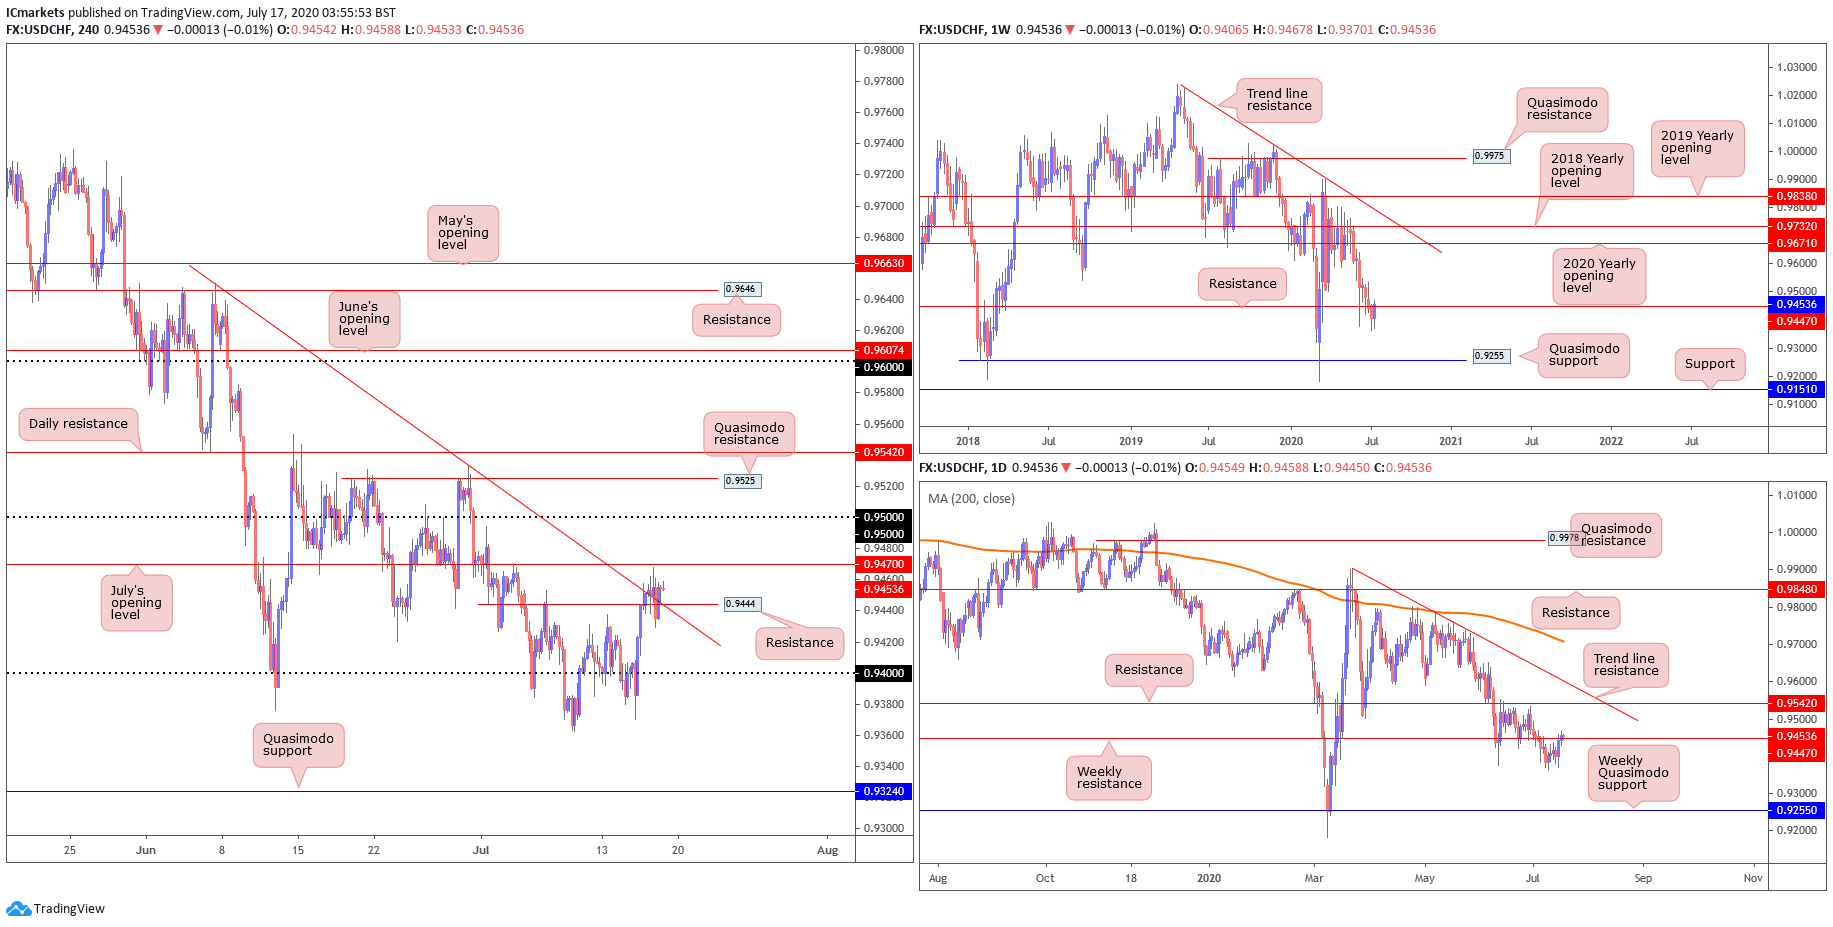
USD/CHF bulls entered an offensive phase Friday, consolidating and crossing paths with H4 resistance coming in at 0.9470 and trend line resistance, extended from the high 0.9730. July’s 0.9470 happens to be July’s opening level , which traders will acknowledge before the 0.95 handle.
Price action, based on the higher time frames,has surpassed previous resistance at 0.9447 and is now looking at resistance level at 0.9577.
Areas of consideration:
Keeping things simple this morning, bearish scenarios off H4 resistance at 0.9470 is likely on the watchlists for many traders today, owing to the confluence the level attracts, both locally and on the higher time frames. With some traders tucking protective stop-loss orders above H4 trend line resistance, the initial downside target will likely be set at 0.94.
Dow Jones Industrial Average:
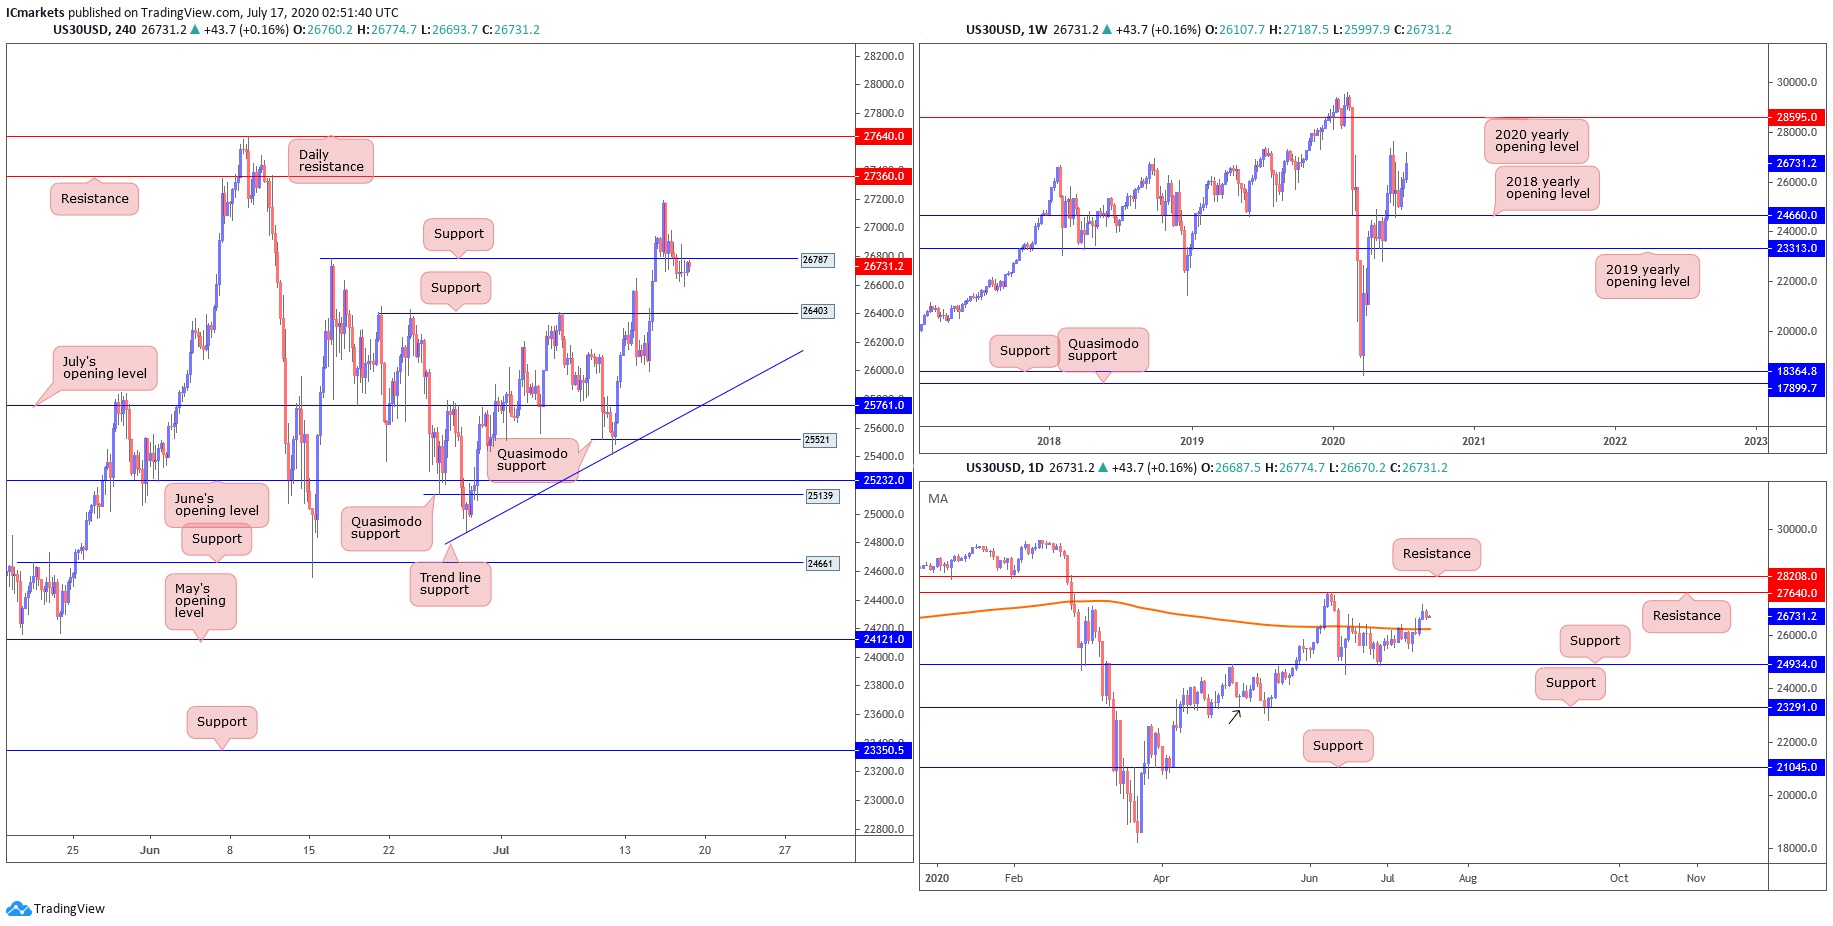
US equities finished Thursday lower after days of rally. The Dow Jones Industrial Average dropped 135.39 points, or 0.50%; the S&P 500 dropped 10.99 points, or 0.34%, and the tech-heavy Nasdaq concluded lower by 76.66 points, or 0.73%.
In recent sessions, traders observed price action retest 26787 on the H4 (June 16 high), after dropping from fresh weekly pinnacles around 27187.
The story on the daily timeframe reveals the 200-day SMA (orange – 26249) recently gave way, a dynamic value capping upside since mid-June. The move higher shifts interest towards resistance at 27640. From the weekly timeframe, the 2018 yearly opening level at 24660 remains an important base of support. In the event traders manage to keep their head above water here, we are likely to pull in the 27638 high, followed by the 2020 yearly opening level at 28595.
Areas of consideration:
Though price recently closed above the 200-day SMA, but on the H4 chart, price went down to retest the 26787 overlap resistance level. Recent doji candlestick is also suggesting a neutral sentiment among traders.If price manages to surpass the 26787 resistance level, more upside could be seen here.
XAU/USD (GOLD):
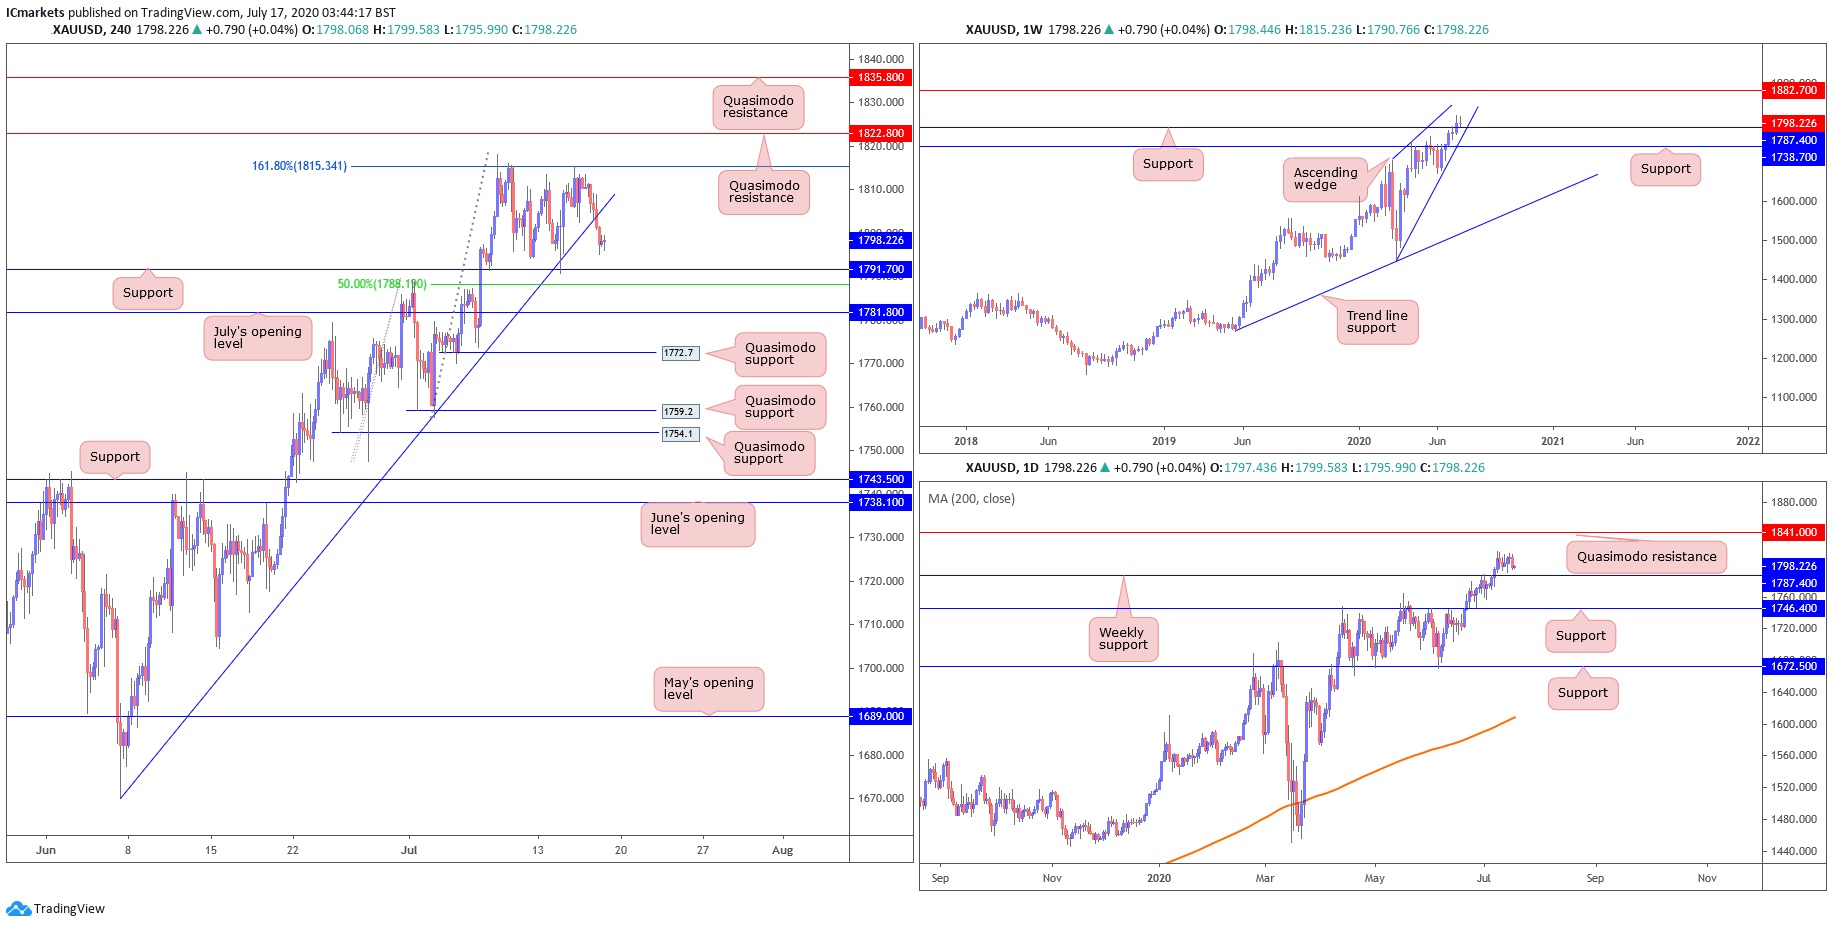
On our H4 chart, XAU/USD prices dipped and broke our ascending trend line after a strong reversal off our horizontal swing high resistance at 1815.00. The next support level that we are looking at would be at 1791.70.
Going forward, given that price broke our H4 ascending support line we remain bearish below this level and could see a further drop to test our next support area at 1791.700, close to the 50% fibonacci retracement area, in line with our ascending trend line on the weekly chart.
As a reminder, here’s where we stand on the higher timeframes:
From the weekly timeframe, bulls elbowed above Quasimodo resistance at 1787.4 (now a serving support) in recent trading. In line with the underlying trend, the break higher has perhaps laid the foundation for continuation buying to resistance stationed at 1882.7. Also of interest on the weekly timeframe is a potential ascending wedge pattern, forming between 1451.4/1818.20. In addition, clearing our 1815.00 horizontal swing high resistance on the H4 timeframe stresses a possible run to daily Quasimodo resistance at 1841.00.
Areas of consideration:
We could be seeing further downside in prices to test our next support area at 1791.70, in line with the weekly ascending trend line and 50% fibonacci retracement on the H4 timeframe before a bounce above this support area.
With the higher time frames pointing to further upside, as underscored in recent writing, additional buying opportunities might be found above 1791.70.
The accuracy, completeness and timeliness of the information contained on this site cannot be guaranteed. IC Markets does not warranty, guarantee or make any representations, or assume any liability regarding financial results based on the use of the information in the site.
News, views, opinions, recommendations and other information obtained from sources outside of www.icmarkets.com.au, used in this site are believed to be reliable, but we cannot guarantee their accuracy or completeness. All such information is subject to change at any time without notice. IC Markets assumes no responsibility for the content of any linked site.
The fact that such links may exist does not indicate approval or endorsement of any material contained on any linked site. IC Markets is not liable for any harm caused by the transmission, through accessing the services or information on this site, of a computer virus, or other computer code or programming device that might be used to access, delete, damage, disable, disrupt or otherwise impede in any manner, the operation of the site or of any user’s software, hardware, data or property.


