
EUR/USD:
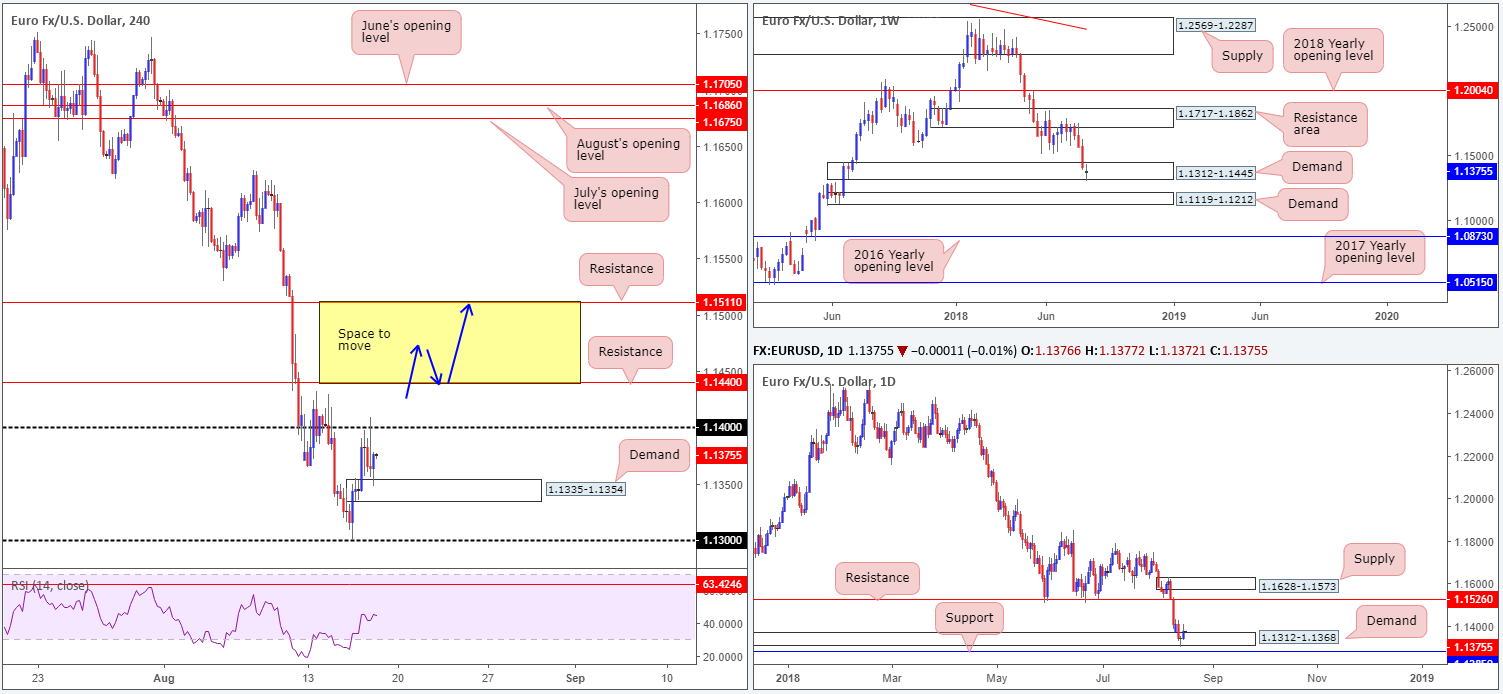
Despite a brief advance witnessed in early Asia, the H4 candles spent Thursday’s session carving out a consolidation between the 1.14 handle and a demand plotted at 1.1335-1.1354. Stop-loss orders beyond 1.14 have likely been tripped thanks to yesterday’s session high of 1.1409, potentially clearing the intraday path north towards nearby resistance at 1.1440.
Both weekly demand at 1.1312-1.1445 and its partner demand seen on the daily timeframe at 1.1312-1.1368 remain intact, despite price action marginally nudging beneath the lower edges of these zones on Wednesday. In terms of upside targets from here, the nearest area of interest falls in on the daily timeframe at 1.1526: a resistance level. Should sellers re-enter the fray, however, traders’ crosshairs will immediately be fixed on daily support coming in at 1.1285, followed closely by another layer of weekly demand at 1.1119-1.1212.
Areas of consideration:
While weekly and daily action portend buying at the moment, H4 structure has red flags positioned at the 1.14 level and nearby resistance mentioned above at 1.1440. To become buyers in this market, the team has noted to consider waiting and seeing if H4 price can close above 1.1440. A close above here that’s followed up with a retest (preferably in the shape of a full or near-full-bodied H4 bull candle – stop-loss orders can be positioned beyond the low of this formation) as support (see blue arrows) would, according to overall structure, be sufficient enough to likely encourage buying to H4 resistance at 1.1511 – positioned just south of daily resistance highlighted above at 1.1526.
Today’s data points: EUR final CPI y/y; US prelim UoM consumer sentiment.
GBP/USD:
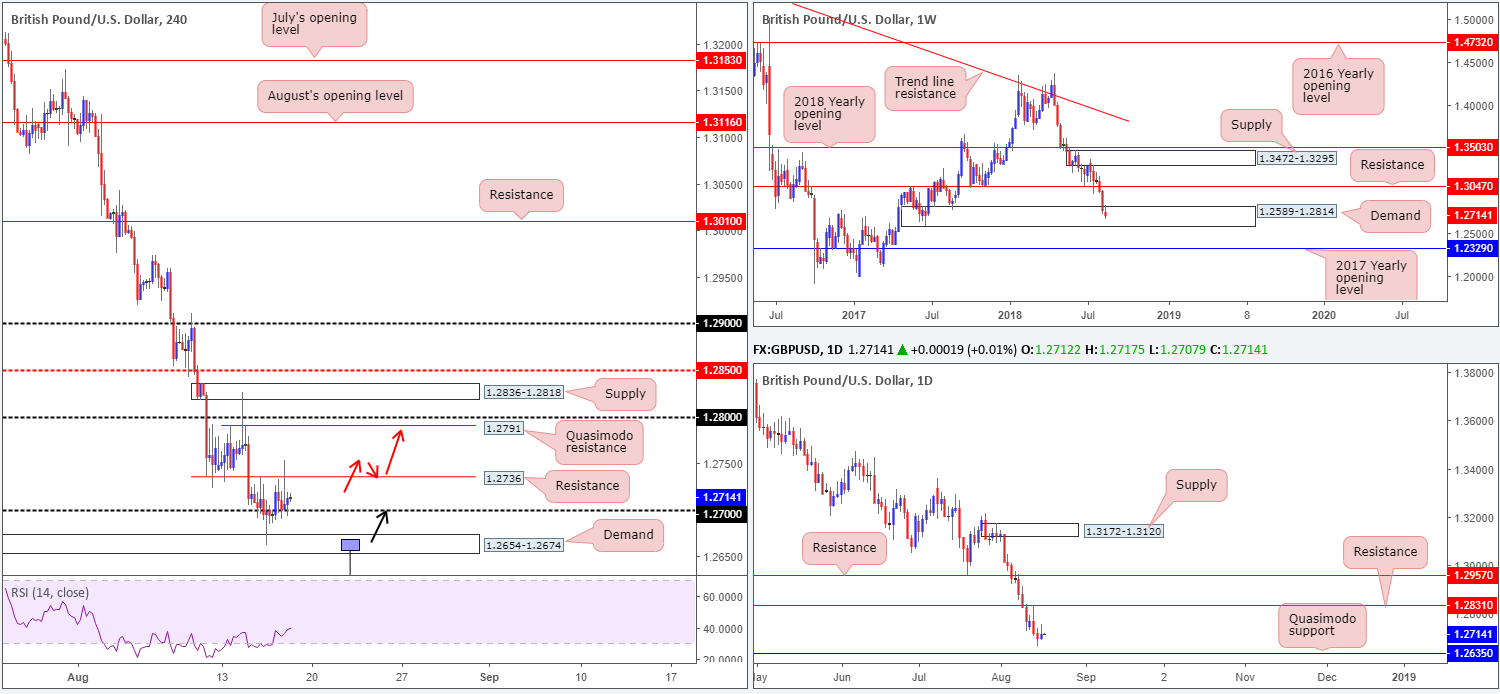
With some underlying traction from better-than-expected UK retail sales on Thursday, sterling managed to retain 1.27 status. Despite upbeat UK data, and a somewhat waning USD, though, the H4 candles are struggling to chalk up anything of note from 1.27, clearly finding nearby resistance at 1.2736 problematic.
Weekly players remain trading within the walls of a demand zone at 1.2589-1.2814, though has, as of yet, failed to produce anything meaningful to the upside from here. Daily action, on the other hand, exhibits potential to explore lower levels: the Quasimodo support at 1.2635.
Areas of consideration:
Intraday, a break above H4 resistance at 1.2736 will likely be enough to attract buyers into the market and pull the unit north towards H4 Quasimodo resistance at 1.2791. Assuming one is able to pin down a long above 1.2736 (preferably a retest play – see red arrows), this would be considered a valid setup, as far as the chart’s structure is concerned.
Alternatively, (as highlighted in Thursday’s report) with the daily Quasimodo support urging daily flow to press lower, not only might we witness further selling into the aforementioned weekly demand zone, we may also see the H4 demand engulfed at 1.2654-1.2674, given the area is positioned around 20 pips above the daily level.
Should a H4 bullish pin-bar formation take shape that pierces through the lower edge of the noted H4 demand and taps the daily Quasimodo support (see the H4 chart for a visual representation), a long on the close of this candle (stops below the low) could be an option, targeting 1.27 as the initial take-profit zone.
Today’s data points: US prelim UoM consumer sentiment.
AUD/USD:
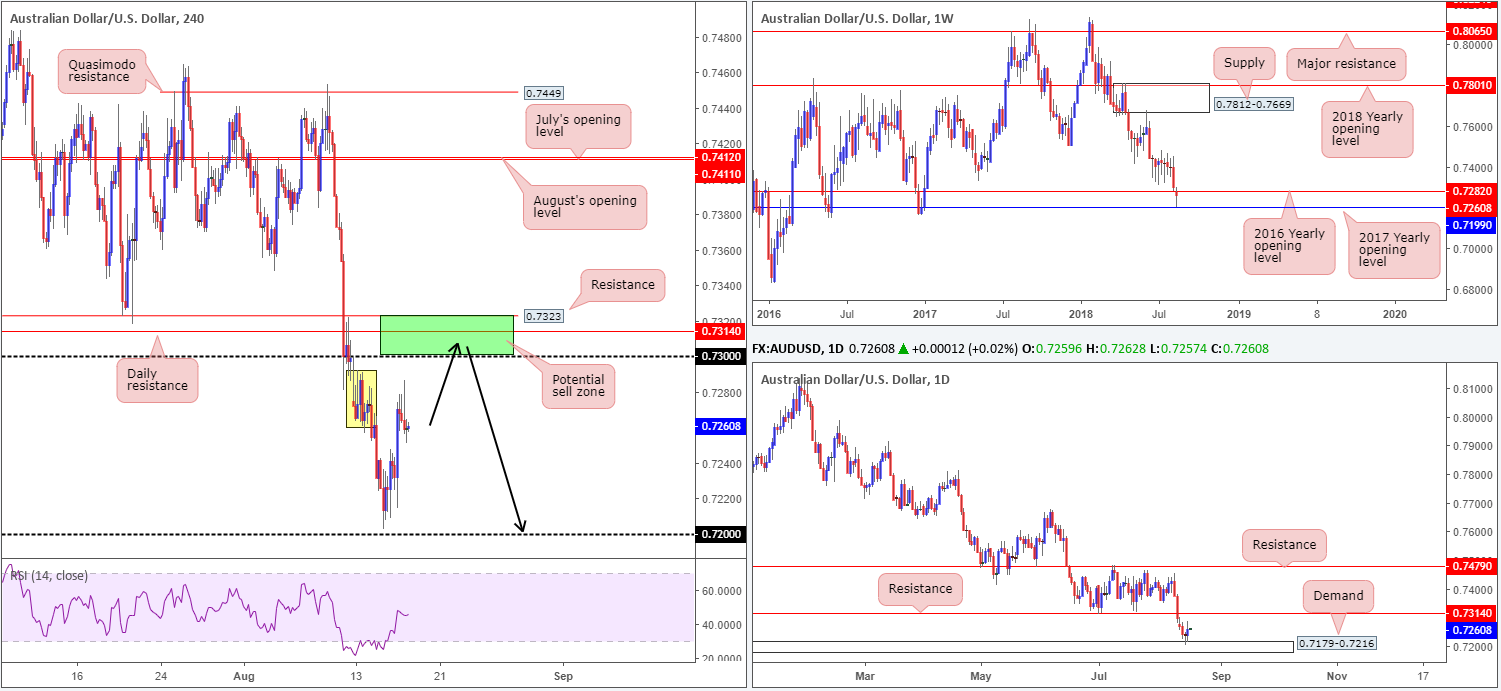
The AUD/USD caught a positive wind following Australia’s employment data in early Asia yesterday, but, as you can see, it wasn’t enough to challenge the 0.73 handle. As can be seen on the H4 timeframe, there is a reasonably solid base of supply marked in yellow around 0.7292-0.7265 currently holding price action lower. What’s also interesting from a technical perspective is this area converges with the 2016 yearly opening level on the weekly timeframe at 0.7282.
The story on the daily timeframe, nonetheless, shows demand at 0.7179-0.7216 continues to attract buyers. Continued upside from this point has the resistance level at 0.7314 to target. Note this is positioned just north of the 0.73 handle on the H4 timeframe and a few pips beneath resistance at 0.7323.
Areas of consideration:
While the market is seen responding from supply on the H4 timeframe right now, the team has noted to keep tabs on the green H4 zone plotted above it at 0.7323/0.73 (comprised of the noted H4 resistance, the daily resistance and the 0.73 handle). To our way of seeing things, this green barrier has ‘sell me’ written all over it. Be that as it may, traders are still urged to consider waiting for H4 candle confirmation before pulling the trigger, since round numbers tend to attract fakeouts! A H4 full or near-full-bodied bear candle printed from 0.7323/0.73 (one can then position stops above the candle’s rejection wick), is likely enough to warrant shorts in this market, targeting 0.72.
Today’s data points: RBA Assist Gov. Ellis speaks; US prelim UoM consumer sentiment.
USD/JPY:
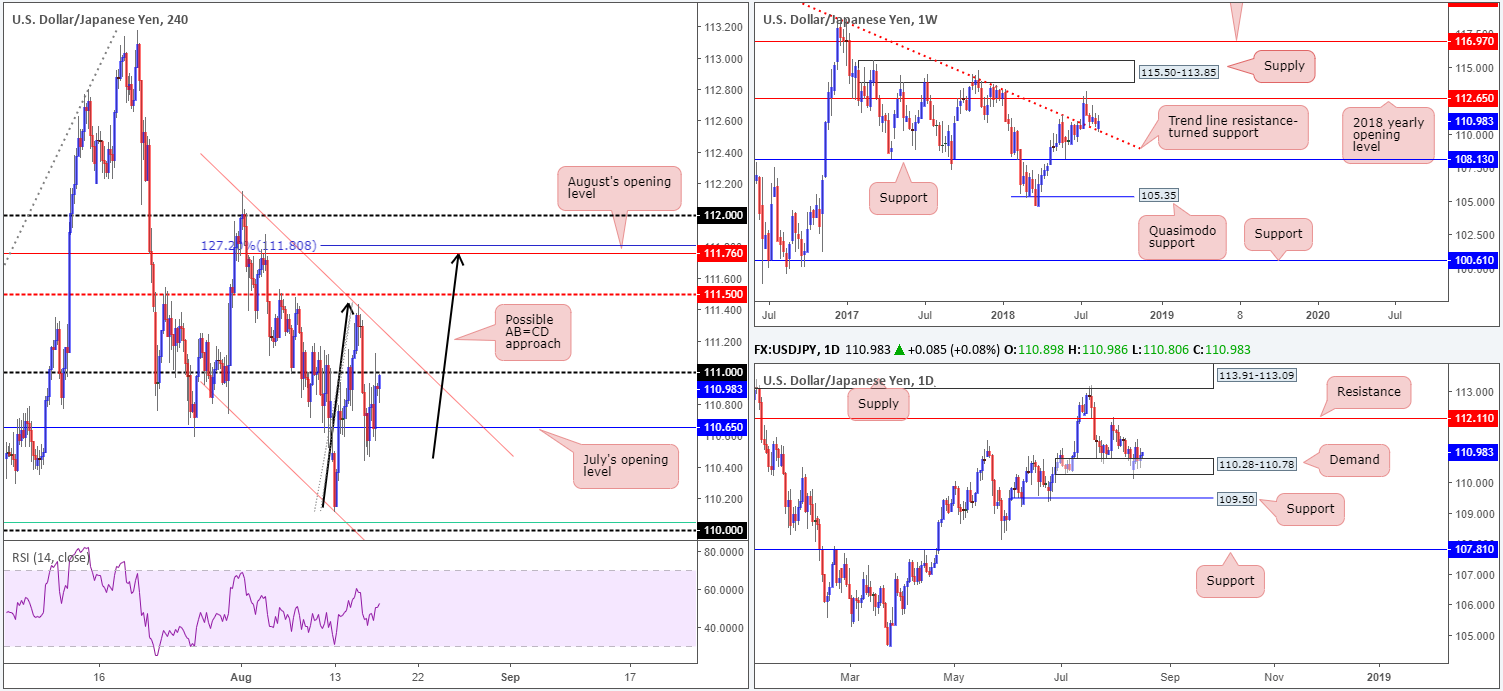
While a number of attempts to bring the H4 candles beneath July’s opening level at 110.65 were seen on Thursday, the line retained a somewhat defensive posture, permitting a test of the nearby 111 handle amid US hours. We could, assuming daily buyers continue to support its current demand at 110.28-110.78 and weekly action respects its trend line resistance-turned support (taken from the high 123.57), see 111 taken out and the H4 channel resistance (etched from the high 112.15) brought into the fight.
In addition to the above, H4 technicians may also want to pencil in a possible AB=CD bearish completion that terminates around August’s opening level at 111.76 (the 127.2% Fib ext. point at 111.80). Selling this area, however, is challenging, given the 112 handle and daily resistance level just above that at 112.11 may act as magnets to price. Therefore, tread carefully here, traders!
Areas of consideration:
Trading this market long, as the higher timeframes suggest, is awkward on the H4 scale at current price. Waiting for price action to clear the 111 handle and nearby channel resistance is required in order to target at least the mid-level resistance at 111.50. Should the market witness a close above the noted H4 channel resistance, that’s followed up with a retest to 111, this would be an area worthy of consideration for buying, targeting 111.50, followed by August’s opening level mentioned above at 111.76, and then with a little bit of luck the 112 handle and daily resistance at 112.11.
Today’s data points: US prelim UoM consumer sentiment.
USD/CAD:
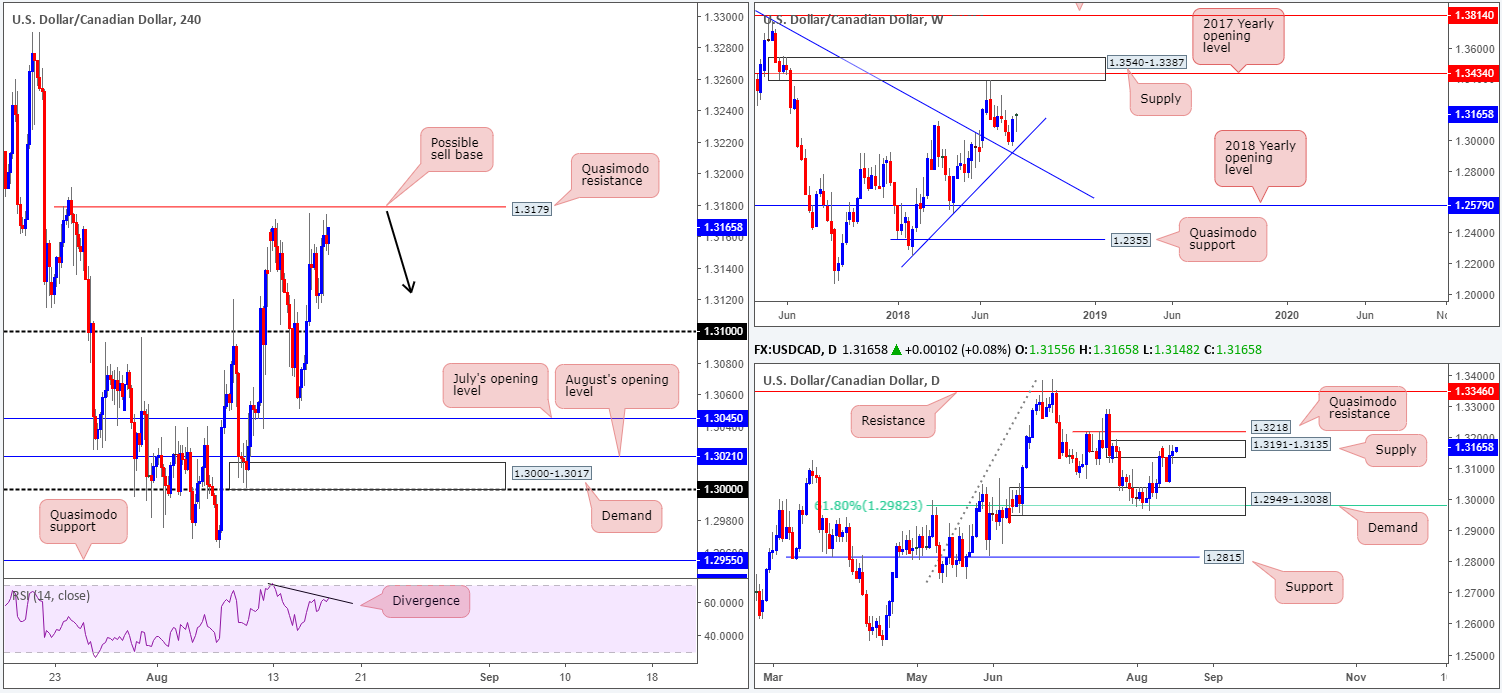
Macroeconomic data out of Canada on Thursday reported an increase in manufacturing sales in June, though investors effectively ignored the number. Technically speaking, the USD/CAD is seen trading within a stone’s throw away from a H4 Quasimodo resistance level at 1.3179 right now. It might also be worth noting the H4 RSI indicator is also displaying divergence.
The story on the daily timeframe shows supply at 1.3191-1.3135 remains in the fight. A break of this area, however, has the nearby Quasimodo resistance at 1.3218 to target. Higher up on the curve, nevertheless, weekly price appears somewhat confined between two trend line supports (1.2247/1.4689). To the upside on this scale, keep tabs on supply penciled in at 1.3540-1.3387, which happens to fuse with a 2017 yearly opening level at 1.3434.
Areas of consideration:
In view of the H4 Quasimodo resistance level at 1.3179 sited within the upper limits of the current daily supply zone, a sell from here could be something to watch today. Also notable is the option of positioning stops above the daily supply area around the 1.3193ish neighborhood. In terms of take-profit targets from 1.3179, yesterday’s low 1.3113 appears to be a logical barrier, followed closely by the 1.31 handle.
Today’s data points: US prelim UoM consumer sentiment; Canadian inflation figures.
USD/CHF:
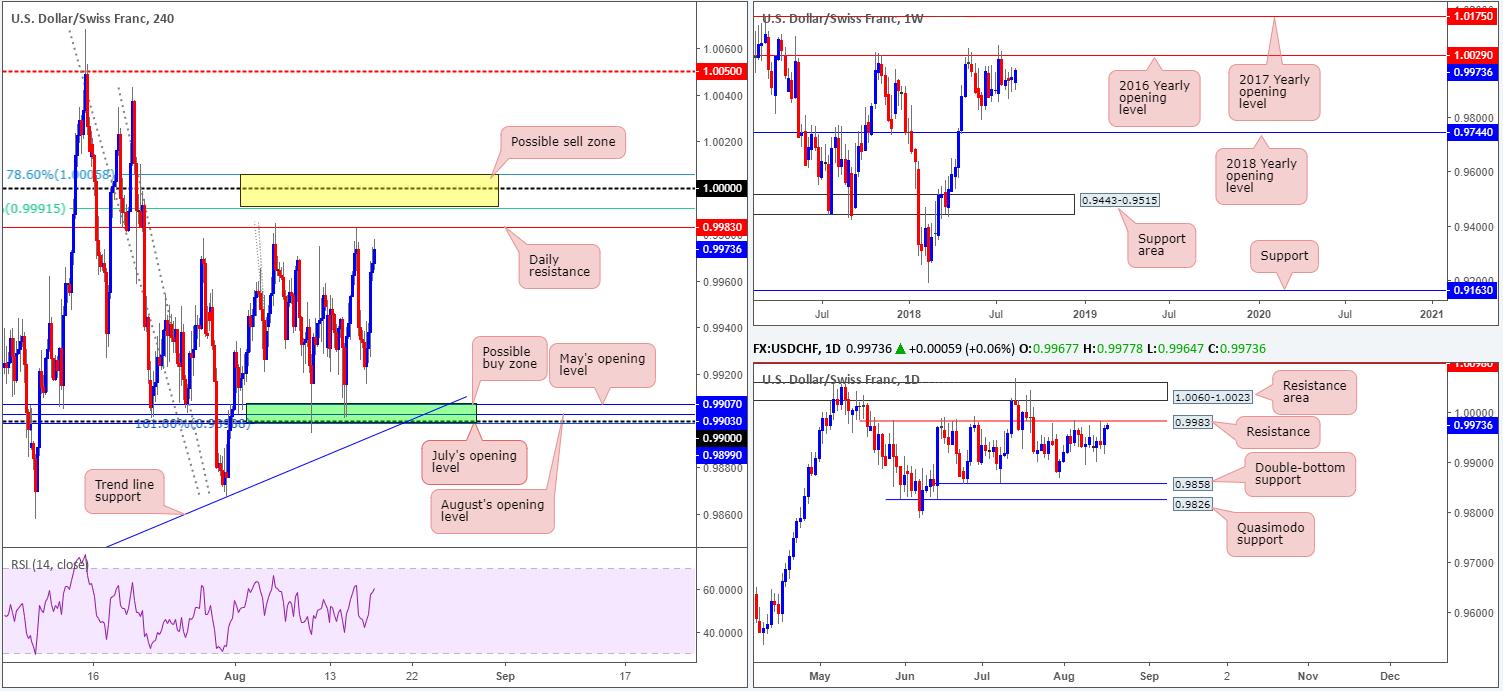
USD/CHF bulls were on fine form yesterday, placing the H4 candles within touching distance of daily resistance seen at 0.9983. As highlighted in Thursday’s briefing, H4 action has effectively traded range bound for nearly two weeks between the aforesaid daily resistance level and a H4 buy zone marked in green at 0.9899/0.9907 (comprised of July’s opening level at 0.9899, a 161.8% Fib ext. point at 0.9899 [taken from the high 0.9984], the 0.99 handle, August’s opening level at 0.9903 and May’s opening level at 0.9907).
The majority of traders are likely expecting price to fade the daily resistance again today. While it may well hold price lower again, traders are also urged to consider parity (1.0000) lurking just above. Although this number is seen outside of the current H4 range, surrounding this widely watched number are two Fibonacci resistances: 78.6% at 1.0005 and 61.8% at 0.9991 (yellow area), making it a reasonable sell zone.
As can be seen on the weekly timeframe, price action continues to consolidate just south of a key resistance at 1.0029: the 2016 yearly opening level. Holding price lower on two occasions in 2017, and twice already in 2018, this level commands attention! Downside supports to keep eyeballs on from here fall in at June’s low 0.9788, followed by the 2018 yearly opening level at 0.9744.
Daily resistance at 0.9983, as highlighted above, continues to cap upside at the moment. In the event of a break north, nonetheless, the daily resistance area planted at 1.0060-1.0023 (holds the 2016 yearly opening level at 1.0029 mentioned on the weekly timeframe) is likely the next base in the firing range. A move lower from current price, on the other hand, has 0.9858 in view: a daily double-bottom support, shadowed closely by a daily Quasimodo support at 0.9826.
Areas of consideration:
For folks looking to fade the nearby yellow H4 sell zone today at 1.0005/0.9991, waiting for additional H4 candle confirmation prior to pulling the trigger is advised (preferably in the shape of a full or near-full-bodied bear candle). The reason being is round numbers (1.0000) tend to attract ‘stop runs’ (fakeouts). There’s little worse than having your stop-loss order triggered by a hair only to watch price shortly after hit your take-profit area, which in this case would be the opposing H4 range extreme: the green H4 buy zone mentioned above at 0.9899/0.9907.
Today’s data points: US prelim UoM consumer sentiment.
Dow Jones Industrial Average:
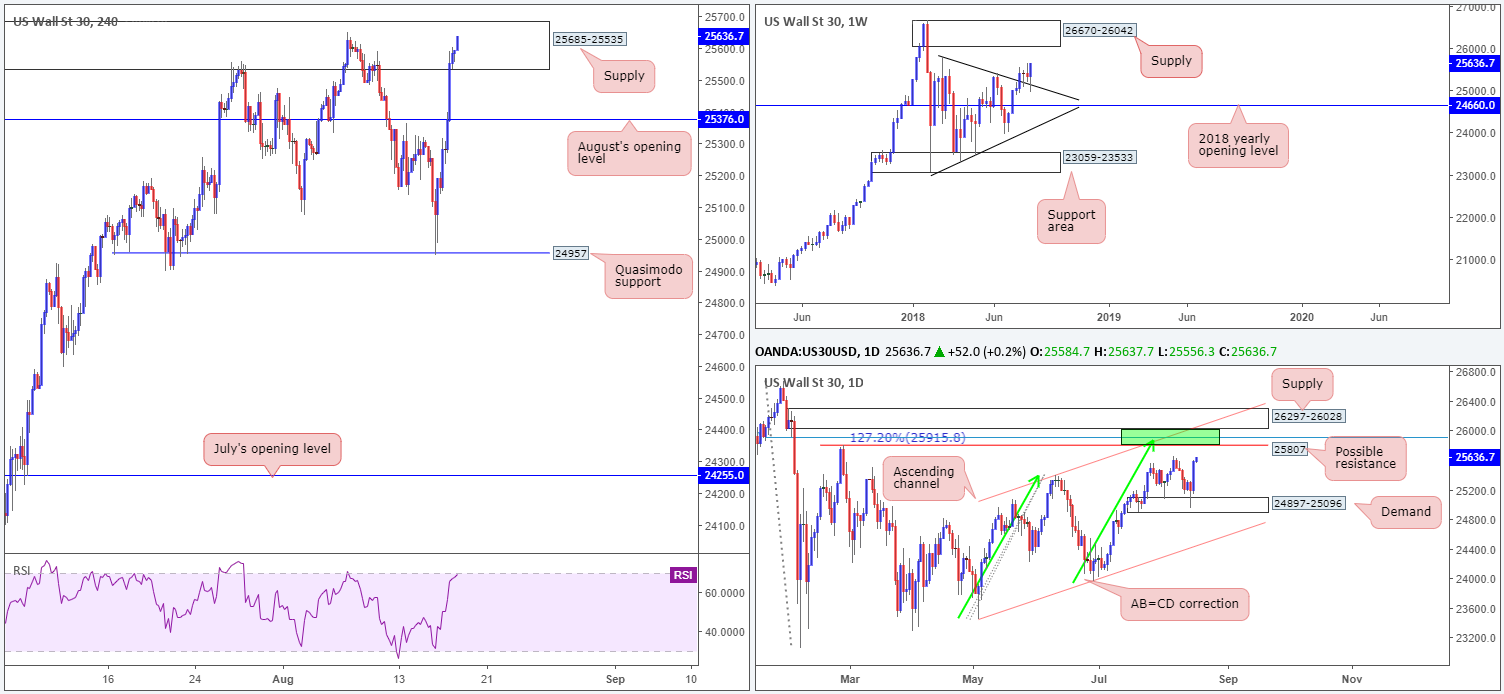
In recent trade, the market observed a retest of a weekly trend line resistance-turned support (etched from the high 25807). From this point, a run up to weekly supply coming in at 26670-26042 is certainly a possibility. In conjunction with weekly action, daily movement also shows room to gravitate higher. Supply at 26297-26028 is an interesting area. Not only does it boast strong downside momentum from its base, it converges closely with channel resistance (taken from the high 25399), a resistance level at 25807 (Feb 27 high), a 127.2% AB=CD (green arrows) correction point at 25915 and a 78.6% Fib resistance at 25904 (green zone).
News of China sending officials to Washington to talk about trade improved market sentiment, pulling the H4 candles above August’s opening level at 25376 towards supply at 25685-25535.
Areas of consideration:
With both weekly and daily timeframes indicating additional upside, selling from the current H4 supply is a challenge.
With the above in mind, the only area that REALLY stands out this morning is the daily supply zone underlined above at 26297-26028. Not only does it boast attractive confluence positioned just below it, the area is also glued to the underside of weekly supply at 26670-26042. With stop-loss orders positioned above the current daily supply, a move from here could be substantial, targeting as far south as daily channel support (taken from the low 23451).
Today’s data points: US prelim UoM consumer sentiment.
XAU/USD (Gold)
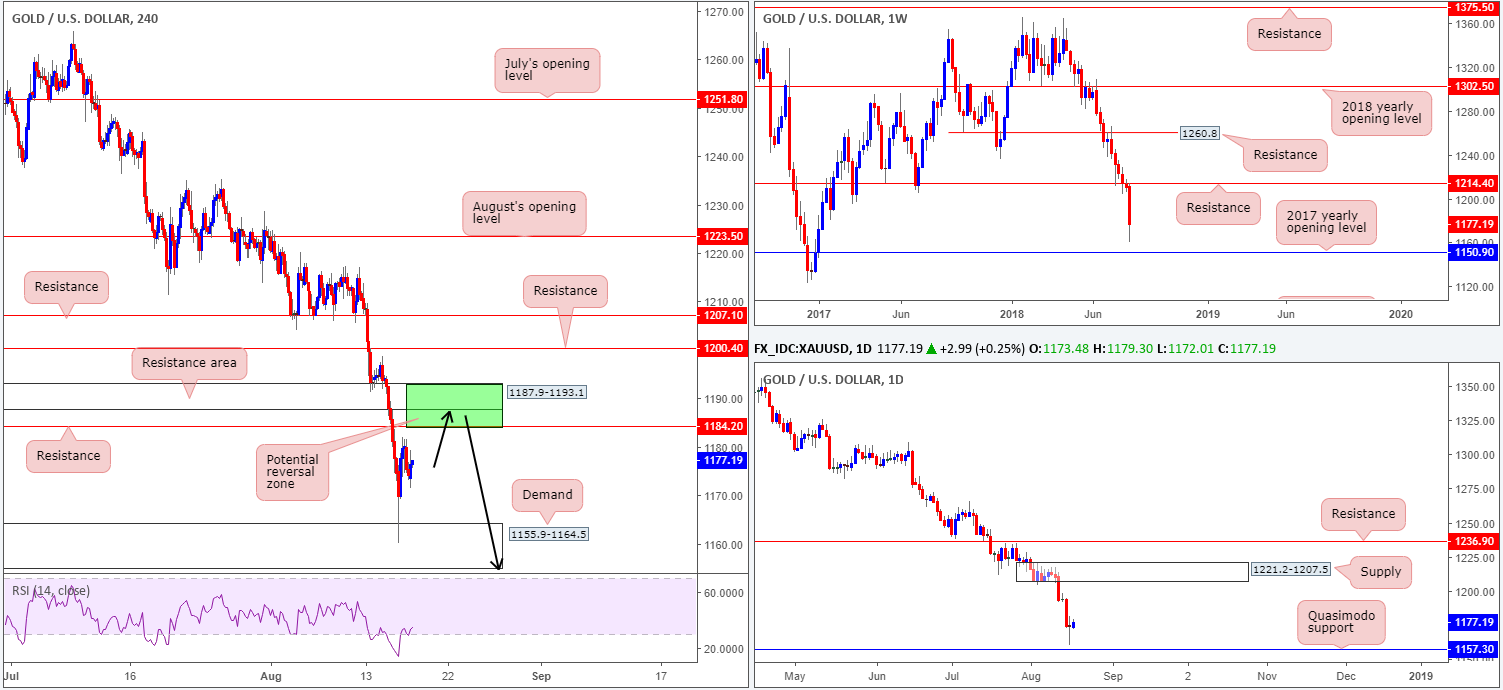
Largely governed by the ebb and flow of the US dollar, bullion remains defensive for the time being. H4 demand at 1155.9-1164.5, bolstered by the H4 RSI indicator treading water within oversold territory, managed to hold firm on Thursday, with traders’ crosshairs now likely fixed on H4 resistance at 1184.2 and nearby H4 resistance area above it at 1187.9-1193.
Within the lower limits of the current H4 demand, we can also see a daily Quasimodo support lurking at 1157.3. On the daily timeframe, however, resistance is not expected to enter the fold until we reach supply penciled in at 1221.2-1207.5. Weekly movement, on the other hand, continues to emphasize a strong bearish tone as the unit approaches the 2017 yearly opening level at 1150.9. Note this yearly level is seen BENEATH the current H4 demand base.
Areas of consideration:
Although buying interest is clearly present from the current H4 demand area at the moment, the threat of a push lower on the weekly timeframe is concerning. So much so, we feel the current H4 resistance level at 1184.2, along with nearby resistance area at 1187.9-1193.1, is a zone worthy of attention for sellers today, with an overall take-profit target set at 1150.9.
The use of the site is agreement that the site is for informational and educational purposes only and does not constitute advice in any form in the furtherance of any trade or trading decisions.
The accuracy, completeness and timeliness of the information contained on this site cannot be guaranteed. IC Markets does not warranty, guarantee or make any representations, or assume any liability with regard to financial results based on the use of the information in the site.
News, views, opinions, recommendations and other information obtained from sources outside of www.icmarkets.com.au, used in this site are believed to be reliable, but we cannot guarantee their accuracy or completeness. All such information is subject to change at any time without notice. IC Markets assumes no responsibility for the content of any linked site. The fact that such links may exist does not indicate approval or endorsement of any material contained on any linked site.
IC Markets is not liable for any harm caused by the transmission, through accessing the services or information on this site, of a computer virus, or other computer code or programming device that might be used to access, delete, damage, disable, disrupt or otherwise impede in any manner, the operation of the site or of any user’s software, hardware, data or property.


