
DXY:
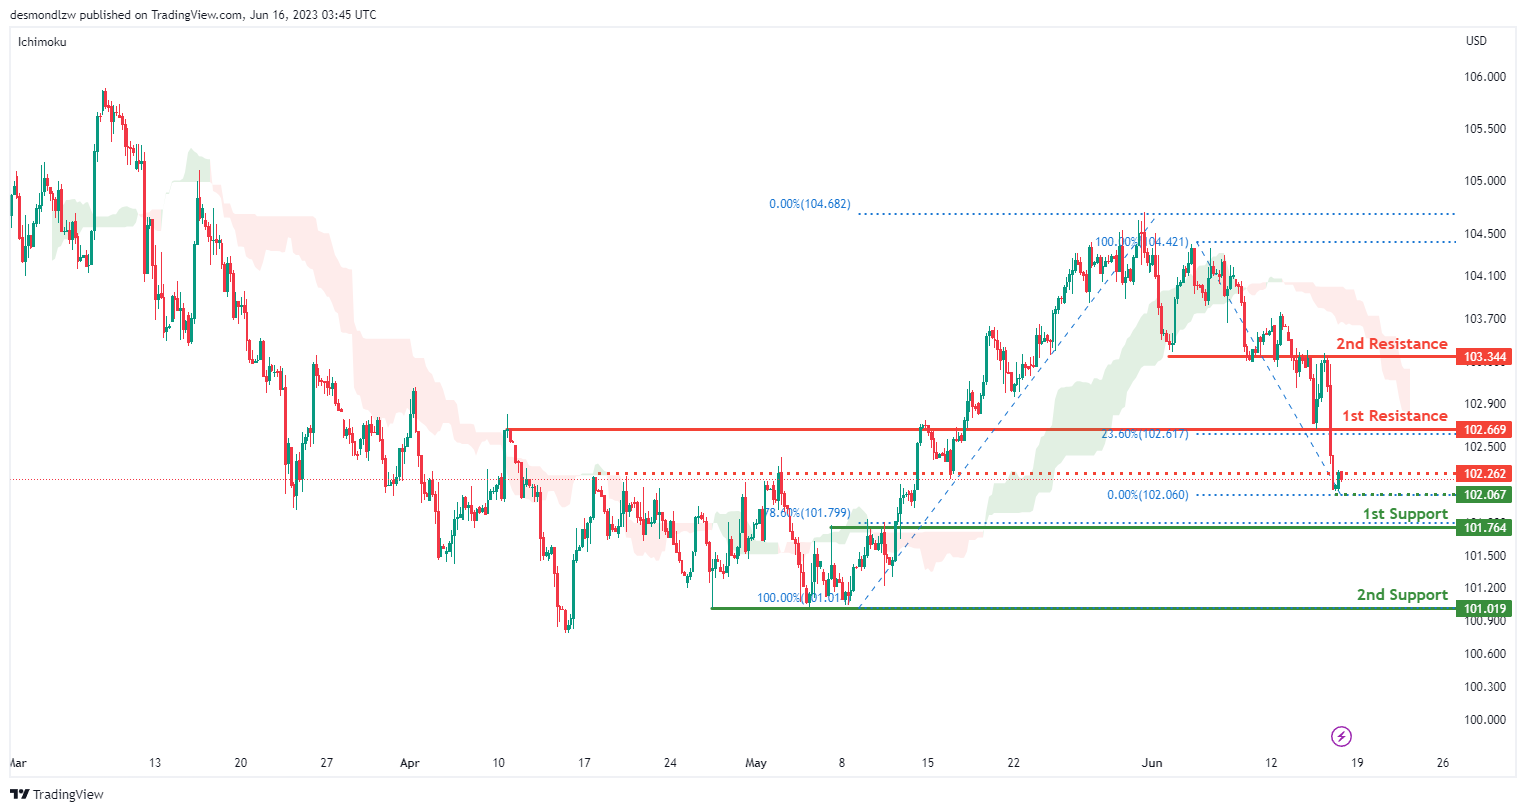
The DXY chart indicates a bearish momentum as the price is below the bearish Ichimoku cloud.
There is a potential for the price to rise towards the first resistance at 102.66 in the short term before reversing and dropping towards the first support at 102.06.
Key support levels include the first support at 102.06, identified as an overlap support and aligned with the 78.60% Fibonacci Retracement. The second support at 101.01 serves as a multi-swing low support and coincides with the 38.20% Fibonacci Retracement.
On the upside, the first resistance at 102.66 acts as a pullback resistance and aligns with the 23.60% Fibonacci Retracement. Additionally, the second resistance at 103.34 is an area of overlap resistance.
There is also an intermediate resistance at 192.26, which serves as a pullback resistance.
EUR/USD:
The EUR/USD chart exhibits a bullish momentum, indicating an upward trend in the market.
The momentum is supported by the price being above a major ascending trend line, suggesting the potential for further bullish movement.
There is a possibility of the price dropping further towards the first support level at 1.0905 in the short term before bouncing back and rising towards the first resistance level at 1.0949.
Key support levels include the first support at 1.0905, identified as a pullback support, and the second support at 1.0846, which serves as a pullback support and aligns with the 38.20% Fibonacci Retracement.
On the upside, the first resistance at 1.0949 is an overlap resistance, indicating a potential barrier to upward price movements. Additionally, the second resistance at 1.1002 represents a swing high resistance and coincides with the 78.60% Fibonacci Retracement.

GBP/USD:
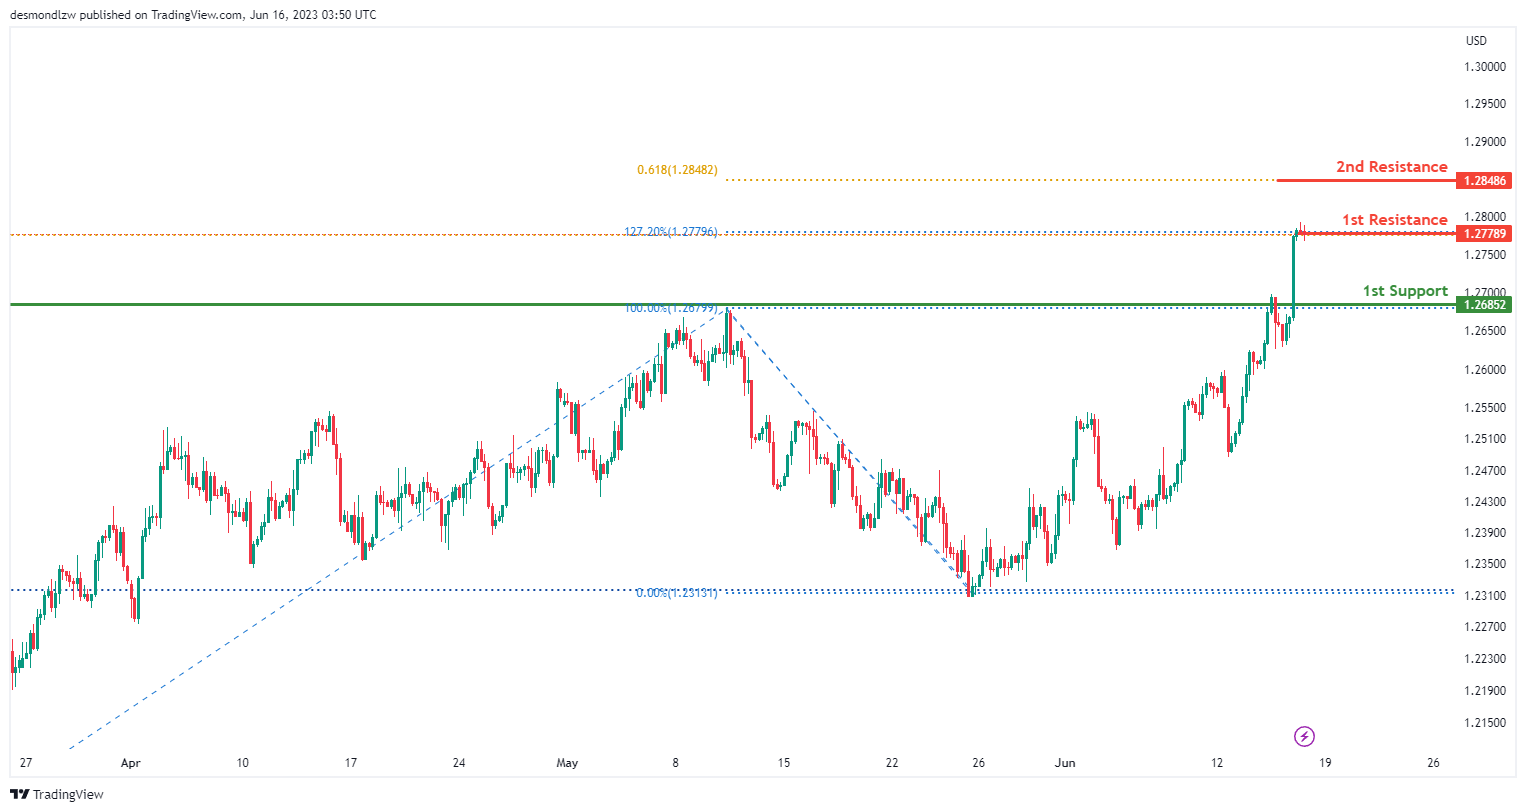
The GBP/USD chart currently exhibits a prevailing bearish momentum, indicating a downward trend in the market. Traders and investors should take note of the potential for a bearish reaction from the first resistance level at 1.3778, which could result in a subsequent decline towards the first support level at 1.2685.
The first support level at 1.2685 is of particular significance as it represents a pullback support, potentially attracting buyers and providing a level of price stabilization.
Conversely, on the upside, the first resistance level at 1.3778 holds notable importance as a swing high resistance, suggesting a potential barrier to upward price movements. Additionally, the second resistance level at 1.2848 is reinforced by the presence of the 61.80% Fibonacci Projection, further highlighting its significance as a potential resistance area.
USD/CHF:
The USD/CHF chart currently exhibits a bearish momentum, indicating a downward trend in the market. Traders and investors should consider the potential for a bearish continuation towards the first support level at 0.8861.
The first support level at 0.8861 is significant as it represents a pullback support, potentially attracting buyers and providing a level of price stabilization. Additionally, the second support level at 0.8823 serves as swing low support, further reinforcing its importance.
On the upside, the first resistance level at 0.8956 acts as a pullback resistance, potentially limiting upward price movements. Similarly, the second resistance level at 0.8987 also functions as a pullback resistance.
Furthermore, an intermediate support level at 0.8972 holds significance as it coincides with a swing high resistance and the 100% Fibonacci Projection, further validating its importance as a potential support area.

USD/JPY:
The USD/JPY chart currently demonstrates a bullish momentum, indicating an upward trend in the market. Traders and investors should consider the potential for a bullish continuation towards the first resistance level at 141.66.
The first support level at 140.22 is identified as an overlap support, suggesting its significance as a potential area where buyers may enter the market. Additionally, the second support level at 138.76 serves as a multi-swing low support, further reinforcing its importance.
On the upside, the first resistance level at 141.66 represents a swing high resistance, potentially acting as a barrier to further upward price movements.

USD/CAD:
The USD/CAD chart currently exhibits a bullish momentum, indicating an upward trend in the market. Traders and investors should consider the potential for a bullish bounce off the first support level at 1.3215, leading the price towards the first resistance level at 1.3273.
The first support level at 1.3215 is recognized as a swing low support and aligns with the 127.20% Fibonacci Extension, highlighting its significance as a potential level where buyers may enter the market. Additionally, the second support level at 1.3066 serves as an overlap support, further reinforcing its importance.
On the upside, the first resistance level at 1.3273 represents a pullback resistance, coinciding with the 23.60% Fibonacci Retracement, potentially acting as a barrier to further upward price movements. Furthermore, the second resistance level at 1.3323 also acts as a pullback resistance.

AUD/USD:
The AUD/USD chart currently shows a bearish momentum, indicating a downward trend in the market. Traders should consider the potential for a bearish reaction at the first resistance level of 0.6883, leading to a drop towards the first support level at 0.6795.
The first support level at 0.6795 is recognized as an overlap support, further reinforced by the presence of the 23.60% Fibonacci Retracement level. Additionally, the second support level at 0.6721 also serves as an overlap support, aligned with the 38.20% Fibonacci Retracement level.
On the upside, the first resistance level at 0.6883 represents a swing high resistance. Furthermore, the second resistance level at 0.6916 coincides with the 127.20% Fibonacci Extension.

NZD/USD
The NZD/USD chart currently demonstrates a bearish momentum, indicating a downward trend in the market. Traders should consider the potential for a bearish reaction at the first resistance level of 0.6235, leading to a drop towards the first support level at 0.6169.
The first support level at 0.6169 is recognized as an overlap support and is further supported by the presence of the 38.20% Fibonacci Retracement level. Additionally, the second support level at 0.6108 also serves as an overlap support, aligned with the 61.80% Fibonacci Retracement level.
On the upside, the first resistance level at 0.6235 represents a swing high resistance. Furthermore, the second resistance level at 0.6306 also acts as a swing high resistance.

DJ30:
The DJ30 chart currently demonstrates a bullish momentum, indicating an upward trend in the market. Traders should consider the potential for a bullish bounce at the first support level of 34357.44, leading to a potential upward movement towards the first resistance level at 34548.50.
The first support level at 34357.44 is recognized as a pullback support and coincides with the 61.80% Fibonacci Projection level. Additionally, the second support level at 34166.57 serves as a pullback support.
On the upside, the first resistance level at 34548.50 represents a swing high resistance. It is further supported by the presence of the 127.20% Fibonacci Extension and 78.60% Fibonacci Projection, indicating Fibonacci confluence. Furthermore, the second resistance level at 23740.41 acts as a 100% Fibonacci Projection.

GER30:
The GER30 chart currently exhibits a bullish momentum, indicating an upward trend in the market. Traders should consider the potential for a bullish breakout at the first resistance level of 16315.80, with the price potentially rising towards the second resistance level at 16461.71.
The first support level at 16072.72 is identified as an area of overlap support, aligning with the 61.80% Fibonacci Retracement level. Additionally, the second support level at 15902.63 serves as another area of overlap support.
On the upside, the first resistance level at 16315.80 represents a significant multi-swing high resistance.
To continue towards the second resistance and complete Elliott Wave 5, it is necessary for the price to break above the first resistance level.

US500
he US500 chart currently demonstrates a bullish momentum, suggesting an upward trend in the market. The price’s position above a major ascending trend line further supports the potential for continued bullish momentum.
There is a possibility of a bullish continuation towards the first resistance level at 4479.3.
Key support levels include the first support at 4386.6, which serves as a pullback support, and the second support at 4326.9, identified as an overlap support.
On the upside, the first resistance level at 4479.3 acts as a pullback resistance, while the second resistance at 4522.3 represents an area of overlap resistance.
Additionally, the intermediate resistance at 4439.8 is recognized as a swing high resistance, contributing to its significance.

BTC/USD:
The BTC/USD chart currently exhibits a bearish momentum, indicating a downward trend in the market. This is supported by the price being below a major descending trend line and also below the bearish Ichimoku cloud.
There is a potential for a bearish reaction at the first resistance level of 25607, with a possible drop towards the first support level at 25252.
Key support levels include the first support at 25252, identified as an overlap support, and the second support at 24871, recognized as a swing low support.
On the upside, the first resistance level at 25607 acts as an area of overlap resistance, while the second resistance at 26105 also represents an overlap resistance.

ETH/USD:
The ETH/USD chart currently demonstrates a bearish momentum, indicating a downward trend in the market. This is supported by the price being below the bearish Ichimoku cloud.
There is a potential for a bearish reaction at the first resistance level of 1690.76, with a possible drop towards the first support level at 1621.56.
Key support levels include the first support at 1621.56, recognized as a swing low support, and the second support at 1580.56, identified as an overlap support.
On the upside, the first resistance level at 1690.76 acts as a pullback resistance, and the second resistance at 1756.28 represents an area of overlap resistance coinciding with the 50% Fibonacci Retracement level.

WTI/USD:
The WTI chart currently exhibits a bearish momentum, indicating a downward trend in the market. Factors contributing to this momentum are not provided.
There is a potential for a bearish reaction at the first resistance level of 70.81, with a possible drop towards the first support level at 67.34. Additional support can be found at the second support level of 64.78, both of which are identified as multi-swing low supports.
On the upside, the first resistance level at 70.81 represents an area of overlap resistance, and the second resistance level at 74.23 also serves as an overlap resistance.

XAU/USD (GOLD):
The XAU/USD chart currently demonstrates a bearish momentum, characterized by its movement within a descending channel. This suggests a prevailing downward trend in the market.
There is a potential for a bearish reaction at the first resistance level of 1966.26, indicating a likelihood of price reversal and a subsequent decline towards the first support level at 1933.95. Further support can be observed at the second support level of 1914.16. These levels are considered significant as they coincide with previous price levels, indicating areas where buyers may enter the market.
Conversely, the first resistance level at 1966.26 serves as a notable hurdle for upward price movement. It represents a multi-swing high resistance, suggesting a strong selling pressure at that level. The second resistance level at 1980.08 also acts as an overlap resistance, reinforcing its significance.

The accuracy, completeness and timeliness of the information contained on this site cannot be guaranteed. IC Markets does not warranty, guarantee or make any representations, or assume any liability regarding financial results based on the use of the information in the site.
News, views, opinions, recommendations and other information obtained from sources outside of www.icmarkets.com, used in this site are believed to be reliable, but we cannot guarantee their accuracy or completeness. All such information is subject to change at any time without notice. IC Markets assumes no responsibility for the content of any linked site.
The fact that such links may exist does not indicate approval or endorsement of any material contained on any linked site. IC Markets is not liable for any harm caused by the transmission, through accessing the services or information on this site, of a computer virus, or other computer code or programming device that might be used to access, delete, damage, disable, disrupt or otherwise impede in any manner, the operation of the site or of any user’s software, hardware, data or property.


