
EUR/USD:
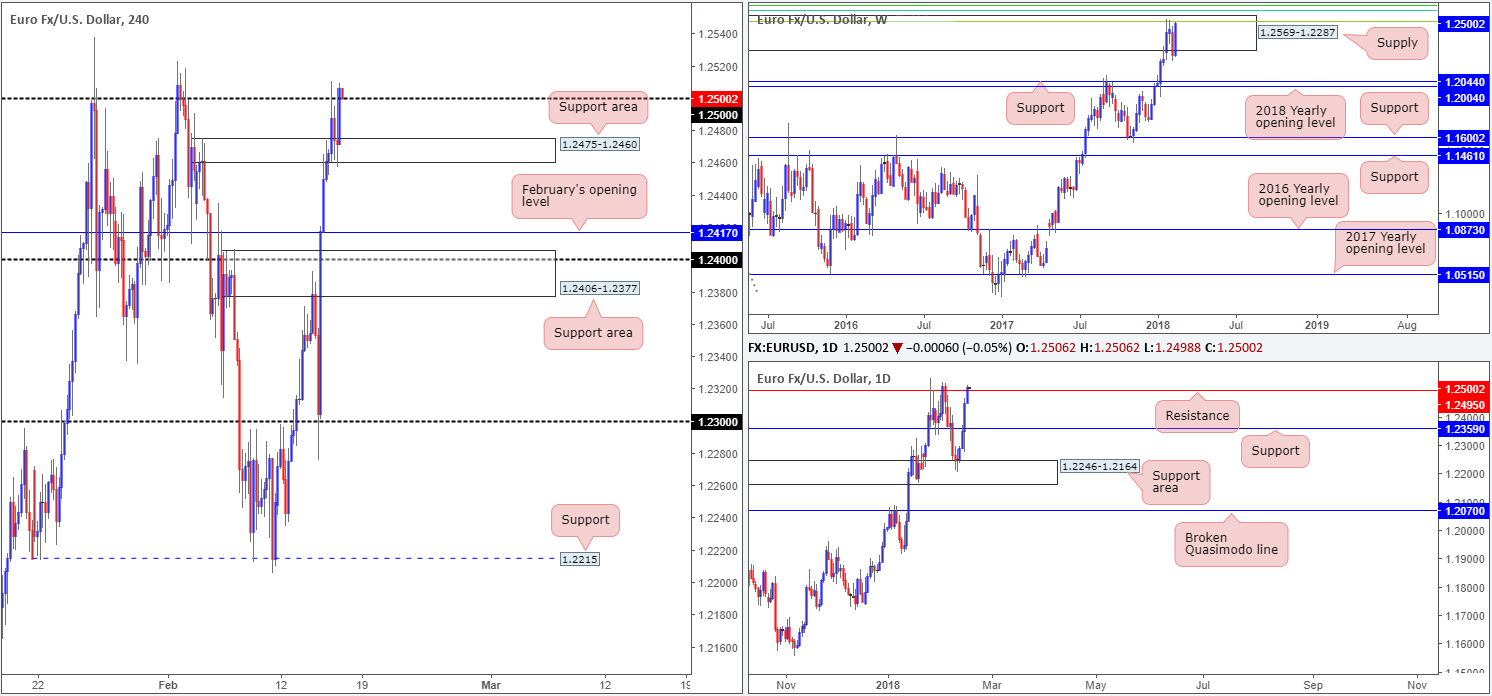
Despite registering its fifth consecutive daily gain, the single currency employed a more subtle approach on Thursday, spending the majority of the day confined between the 1.25 handle and a H4 support area at 1.2475-1.2460. Eventually, though, we did see H4 price end the day closing marginally above the 1.25 mark in the shape of a near-full-bodied candle.
Daily movement also recently peeked above a daily resistance level at 1.2495. Continued buying from this point may lead to an approach up to a daily resistance level seen at 1.2626 (not seen on the screen). Before this can be achieved, nonetheless, the weekly supply base coming in at 1.2569-1.2287 will need to be taken out. Also of interest here is the weekly Fibonacci cluster seen circling around the top edge of this weekly area:
- 61.8% Fib resistance at 1.2604 taken from the high 1.3993.
- 50.0% Fib resistance at 1.2644 taken from the high 1.4940.
- 38.2% Fib resistance at 1.2519 taken from the high 1.6038.
Potential trading zones:
Although H4 price is seen retesting the top edge of 1.25 as we write, along with daily flow recently crossing a daily resistance, this is still not a high-probability buy, in our view. This simply comes down to the weekly supply zone in play at 1.2569-1.2287.
At the same time, though, as you can probably gather, selling would also be a somewhat daredevil move, since you’d effectively be shorting into potential H4 and daily supports.
There just doesn’t seem to be an accessible path available at this time, so we feel the best course of action here is to remain on the sidelines and wait for further developments.
Data points to consider: US housing figures and import prices m/m at 1.30pm; US prelim UoM consumer sentiment at 3pm GMT.
Areas worthy of attention:
Supports: 1.25 handle; 1.2475-1.2460.
Resistances: 1.2569-1.2287; weekly Fib resistance cluster; 1.2495.
GBP/USD:
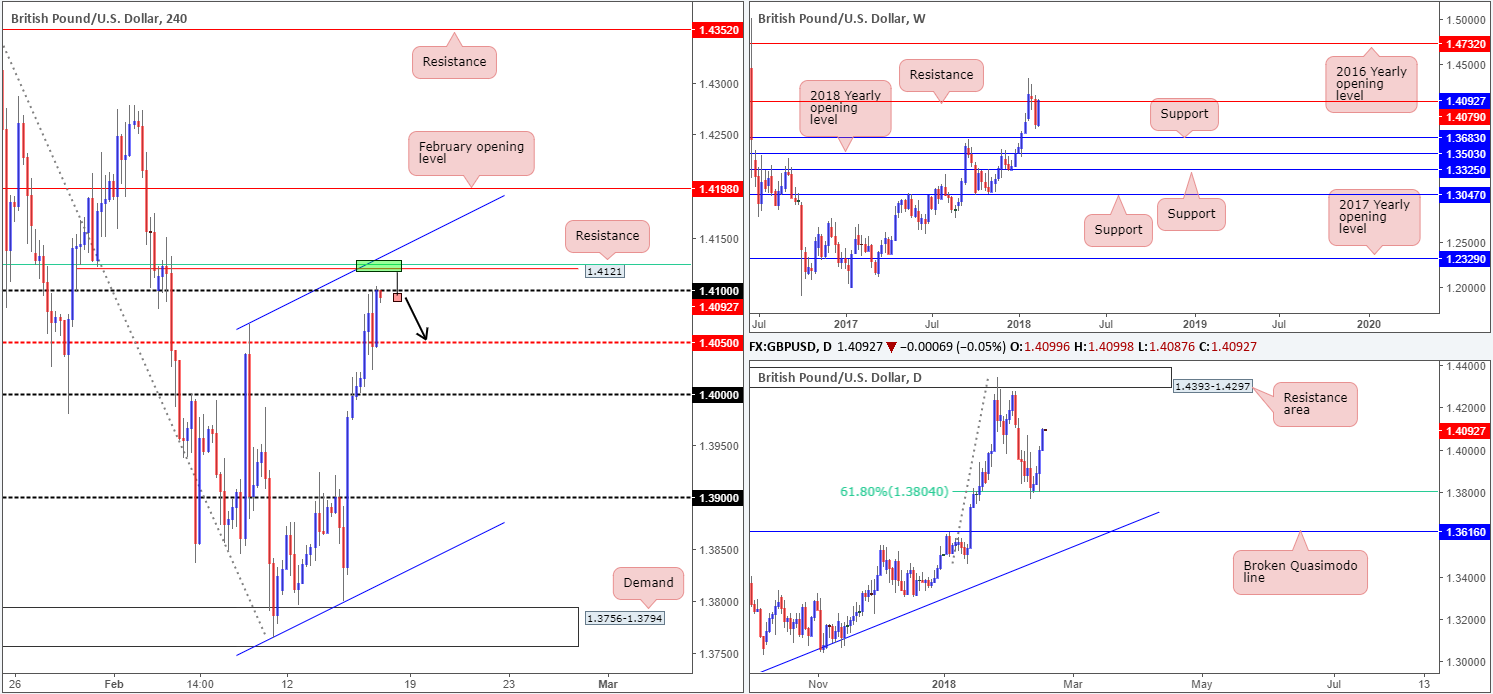
The GBP/USD, as you can see, built on its recent advance, consequently recording a fourth consecutive daily gain. This has placed the weekly resistance level at 1.4079 under attack, and also positioned H4 candles around the underside of the 1.41 handle. Daily movement, on the other hand, still shows room to push as far north as the daily resistance area located at 1.4393-1.4297.
Directly above 1.41, there’s an interesting area marked in green around 1.4121ish. Comprised of a H4 resistance at 1.4121, a H4 channel resistance taken from the high 1.4067 and a H4 61.8% Fib resistance drawn from 1.4125 (green line), this zone makes for a possible reversal point today should the stop-loss orders beyond 1.41 trigger (fakeout).
Potential trading zones:
Although we like the position of the 1.4121 H4 zone above 1.41, we would not deem this a zone worthy of a pending sell order, since buyers may attempt to defend 1.41 as a support once above it! In that case, we would only consider this to be a valid sell zone should we witness a H4 selling wick whipsaw through 1.41 and tap 1.4121 (see the chart). This, in our view, is a strong indication that we’re heading back down to the 1.4050s, or possibly lower.
Data points to consider: UK retail sales m/m at 9.30am; US housing figures and import prices m/m at 1.30pm; US prelim UoM consumer sentiment at 3pm GMT.
Areas worthy of attention:
Supports: 1.4050.
Resistances: 1.41 handle; 1.4121; 1.4079; 1.4393-1.4297.
AUD/USD:
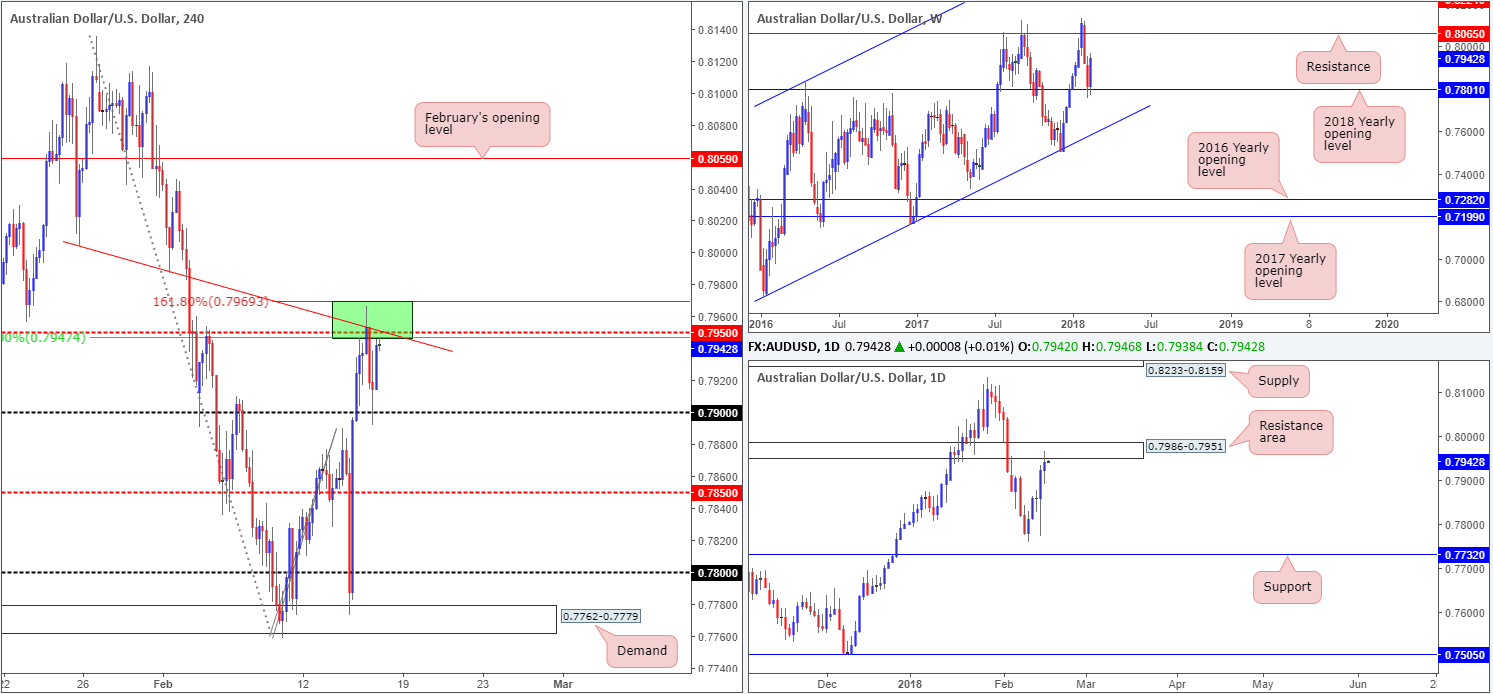
For those who follow our analysis on a regular basis you may recall that the team recently highlighted a potential sell zone between 0.7969/0.7947 (green zone marked on the H4 timeframe). Comprised of a H4 161.8% Fib ext. point at 0.7969, a H4 trendline resistance taken from the low 0.8004, a H4 50.0% resistance at 0.7947, a H4 mid-level resistance at 0.7950 and the underside of a daily resistance area at 0.7986-0.7951, this zone managed to cap upside on Thursday and pull the unit down to the 0.79 handle. Well done to any of our readers who took advantage of this area.
Potential trading zones:
As you can see, the H4 candles are seen retesting the underside of the noted green H4 zone, as we write. Should the market print a full or near-full-bodied H4 bearish candle, this could be good for an additional sell, targeting 0.79 and possibly beyond. The reason we require further confirmation this time is largely due to this area likely weakened from yesterday’s selloff, and secondly because of where weekly price is trading from: a 2018 yearly opening level at 0.7801.
Data points to consider: US housing figures and import prices m/m at 1.30pm; US prelim UoM consumer sentiment at 3pm GMT.
Areas worthy of attention:
Supports: 0.79 handle; 0.7801.
Resistances: 0.7969/0.7947; 0.7986-0.7951.
USD/JPY:
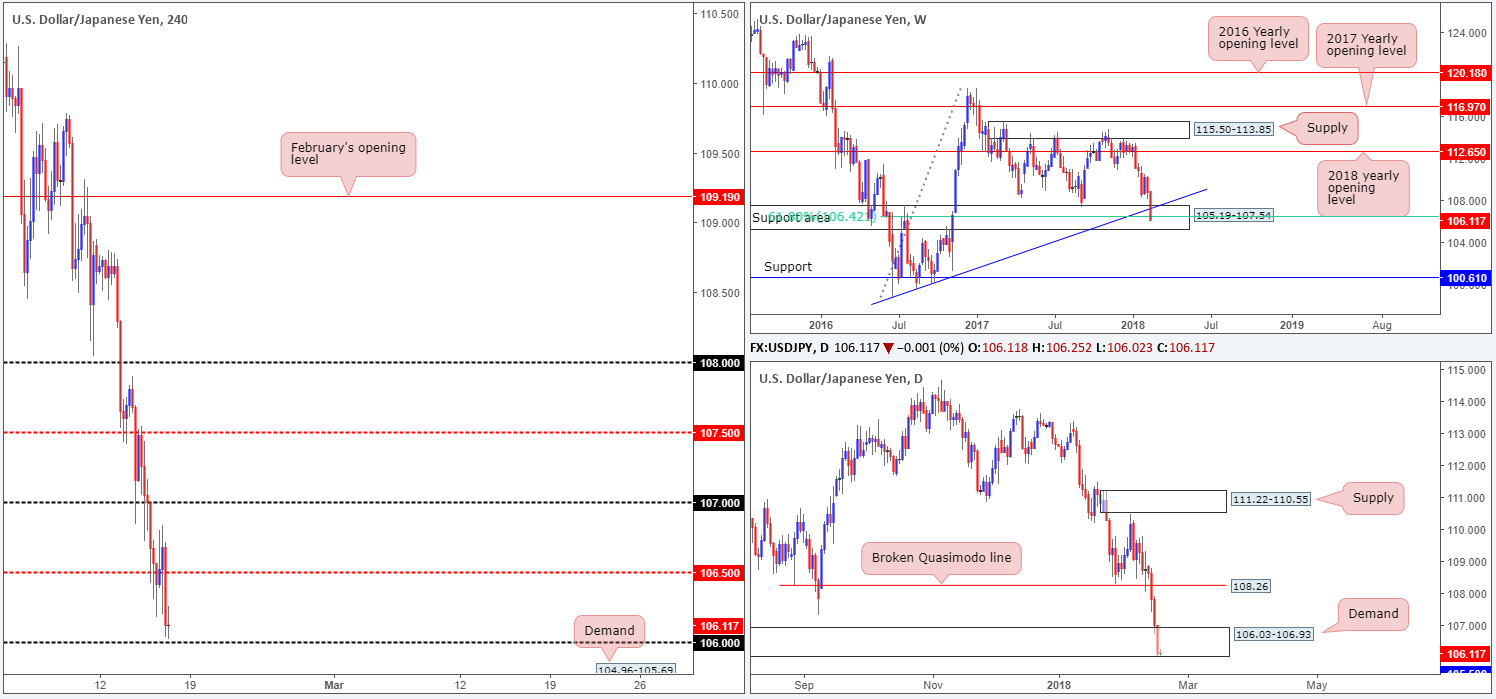
The USD/JPY market sustained additional losses during Thursday’s segment, pulling the unit to fresh lows of 106.03. The weekly support area at 105.19-107.54 (intersects beautifully with a weekly trendline support etched from the low 98.78 and a weekly 61.8% Fib support at 106.42) has provided little refuge thus far. In addition to this, the daily demand area plotted at 106.03-106.93 (seen within the walls of the aforementioned weekly zone), although still in the fray, appears incredibly fragile at this point. The next port of call beyond this area is 105.50: a daily support level.
Across on the H4 timeframe, we can see that price is lurking a few pips ahead of the 106 handle. 40 or so pips beyond this hurdle there’s a H4 demand present at 104.96-105.69, which happens to house the aforementioned daily support.
Potential trading zones:
While technical structure on the weekly timeframe suggests a rotation to the upside could be in store, traders likely remain cautious amid current selling. For us, we would want to see weekly price close back above the current weekly trendlne support, before airing bullish thoughts.
At the same time, though, as you can probably gather, selling would also be a somewhat bold move, since you’d effectively be shorting into a whole host of technical supports (see above in bold)!
In situations such as this, we tend to favor the bench over ambiguity.
Data points to consider: US housing figures and import prices m/m at 1.30pm; US prelim UoM consumer sentiment at 3pm GMT.
Areas worthy of attention:
Supports: 106 handle; 104.96-105.69; 106.03-106.93; 105.19-107.54; 106.42; weekly trendline support.
Resistances: 106.50.
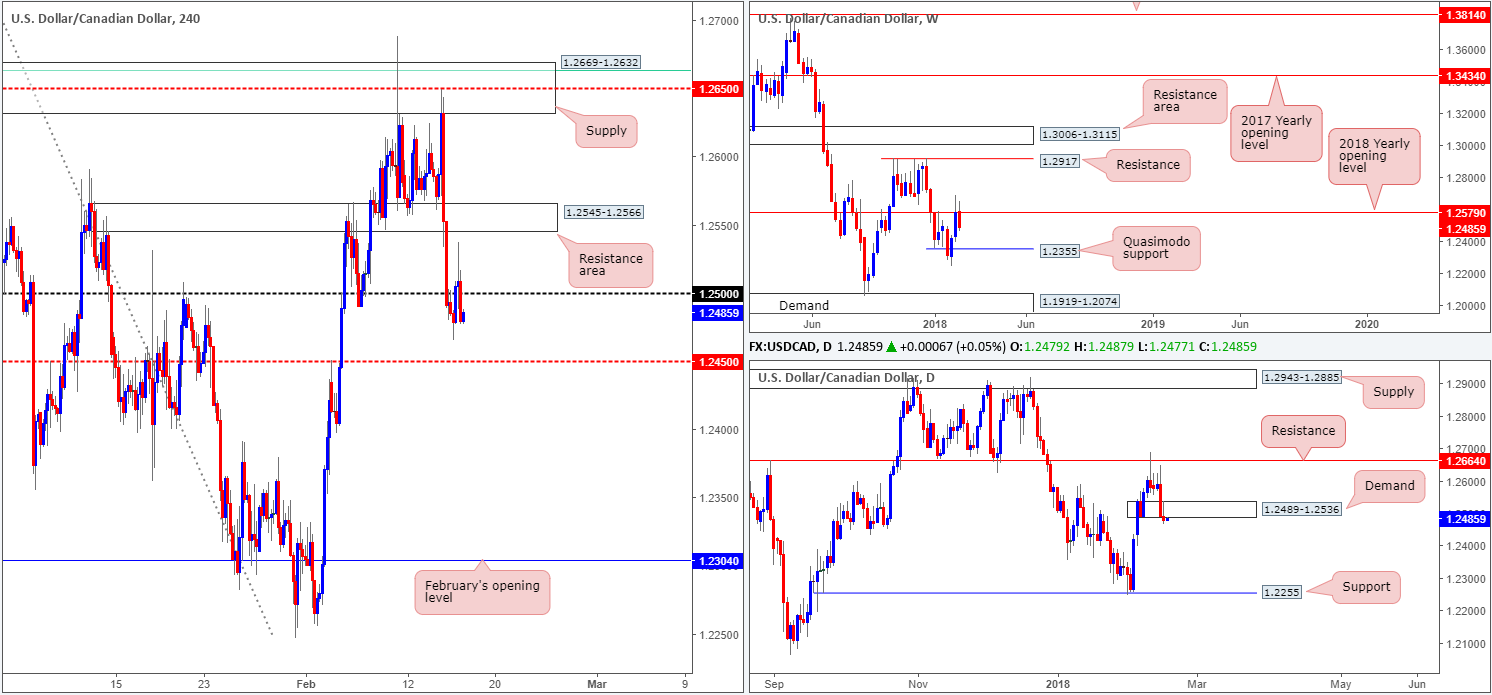
USD/CAD:
Coming in from the top this morning, we can clearly see weekly price is currently trading heavily in the red from the 2018 yearly opening level at 1.2579. Should the bears remain in the driving seat here, the next downside target can be seen in the form of a weekly Quasimodo support level at 1.2355. Down on the daily timeframe, demand at 1.2489-1.2536 looks exhausted, as daily price printed a reasonably strong close beyond its walls yesterday. From this angle, we see very little support on the radar until we reach the daily support band coming in at 1.2255.
H4 price, despite running to highs of 1.2537 yesterday, managed to end the day closing back below the 1.25 band. This leaves the H4 mid-level support at 1.2450 in the firing range today.
Potential trading zones:
Intraday shorts from the underside of 1.25 could be an option today, targeting 1.2450. Waiting for additional candle confirmation in the form of a H4 full or near-full-bodied bear candle is recommended, since psychological bands tend to overshoot price to run stops.
A trade from 1.25, however, should be treated as a ‘trade and see’, meaning that although intraday targets fall in at 1.2450, there’s potential for the market to drive as low as the weekly Quasimodo support noted above at 1.2355.
Data points to consider: US housing figures and import prices m/m at 1.30pm; US prelim UoM consumer sentiment at 3pm; CAD Foreign securities purchases and manufacturing sales m/m at 1.30pm GMT.
Areas worthy of attention:
Supports: 1.2450; 1.2355; 1.2255.
Resistances: 1.25 handle; 1.2579.
USD/CHF:
Registering its fourth consecutive daily loss yesterday, the USD/CHF ended the session breaking through a H4 support level at 0.9248 (now acting resistance), and marginally pinching below a daily Quasimodo support at 0.9233. This, in our technical book, has potentially cleared the pathway south down to the weekly support seen at 0.9163.
Given the strength of yesterday’s move, and the levels it breached, it’d be a surprise to see H4 price get back above 0.9248/0.9233 (green zone) today. In fact, this could be an area to consider shorting from, with target objectives set at the 0.92 handle, followed by the weekly support level mentioned above at 0.9163. Since there is not a defined position for stop-loss orders here, waiting for lower-timeframe confirming action might be the path to take. What this means is simply waiting for H4 price to strike the said zone, and then filtering down the action to, say the M15 chart, and watching for either bearish candlestick signals to form, a break/retest of a trendline support or even a break of demand. (Of course, the method one chooses to confirm a zone will be trader dependent).
Potential trading zones:
Apart from possible sells from 0.9248/0.9233, a bullish reversal is expected around the oncoming weekly support level, given its historical significance dating back to mid-2013.
Data points to consider: US housing figures and import prices m/m at 1.30pm; US prelim UoM consumer sentiment at 3pm GMT.

Areas worthy of attention:
Supports: 0.92 handle; 0.9163.
Resistances: 0.9248/0.9233.
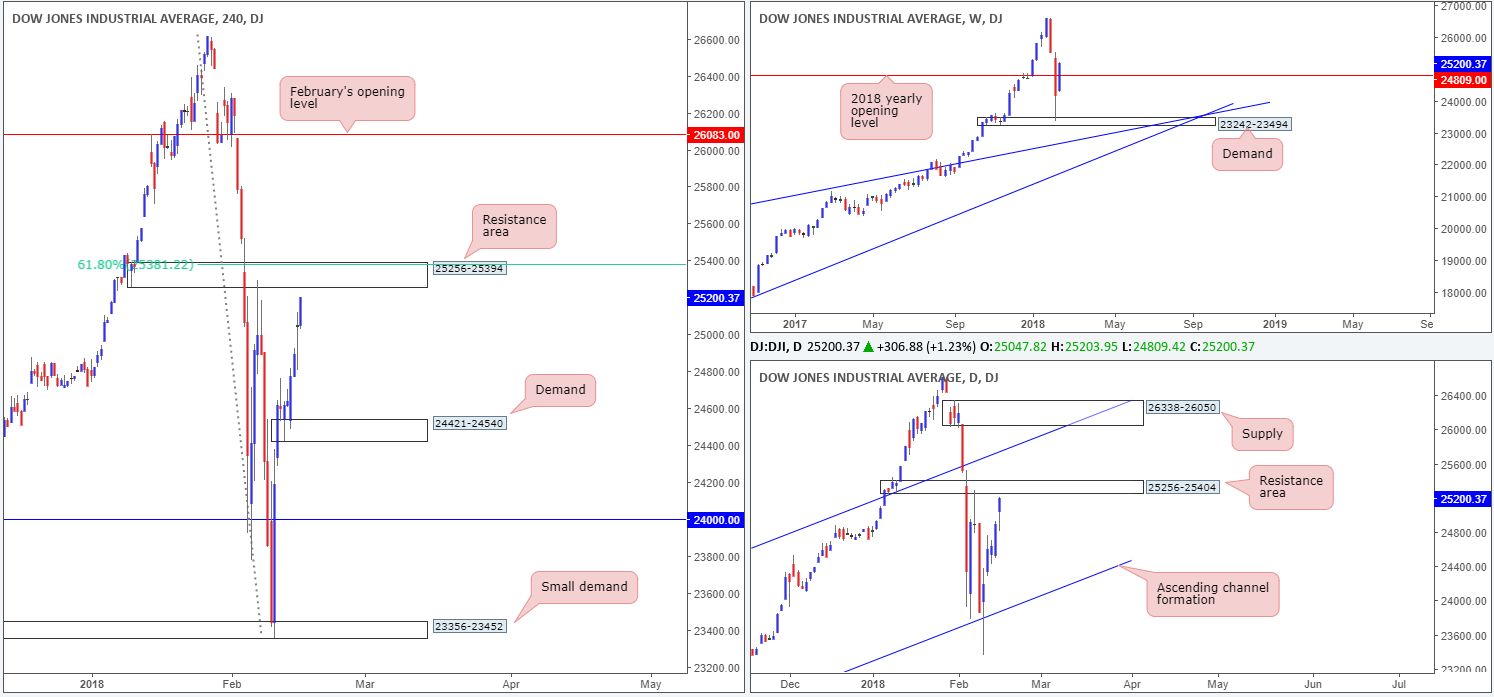
DOW 30:
US equities extended its gains on Thursday, reaching highs of 25203. Tech stocks, once again, were among the best performers.
This recent bout in buying, as you can see from the charts, has brought the Dow Jones Industrial Average up to within striking distance of 25256-25394: a H4 resistance area which happens to be housed within a daily resistance zone coming in at 25256-25404. Also worthy of note here is the H4 zone boasts a 61.8% H4 Fib resistance located at 25381.
Potential trading zones:
Buyers in this market may want to begin exercising some caution given the close proximity of H4/daily structures, as we feel a bounce to downside from these areas are likely on the cards.
Would the above warrant a short position? It could if one is willing to wait for additional candle confirmation in the form of a full or near-full-bodied H4 bear candle. The reason we believe this is required is simply due to weekly price recently crossing back above the 2018 yearly opening level on the weekly timeframe at 24809.
Data points to consider: US housing figures and import prices m/m at 1.30pm; US prelim UoM consumer sentiment at 3pm GMT.
Areas worthy of attention:
Supports: 24421-24540; 24809 (potentially).
Resistances: 25256-25394; 25256-25404; 25381.
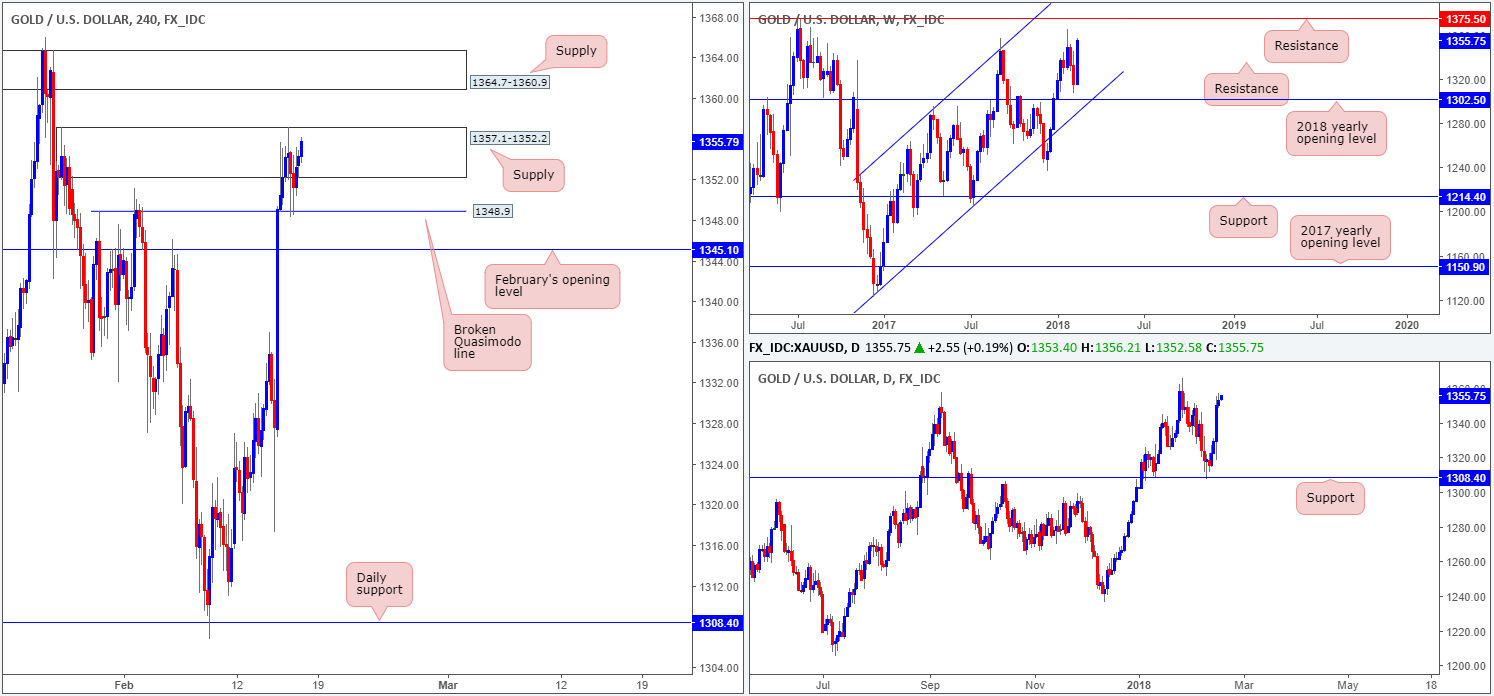
GOLD:
As can be seen on the charts the price of gold remains well-bid on the back of dollar weakness. However, do remain cognizant of the huge major-league monthly support seen on the US dollar index at 88.50!
Weekly price appears as though it’s eyeing a weekly resistance level coming in at 1375.5, while H4 supply at 1357.1-1352.2 continues to cap upside after bouncing from a H4 broken Quasimodo line at 1348.9. Even with a firm push above the current H4 supply, traders still have to contend with a nearby H4 supply seen at 1364.7-1360.9.
Potential trading zones:
Trading this market remains a challenge. Structure is firmly limited on the H4 timeframe. Irrespective of the direction one selects, you’ll be trading against opposing H4 structure. Therefore, unless we witness a notable move in this market today, there’s little on offer right now as far as high-probability setups go.
Areas worthy of attention:
Supports: 1345.1; 1348.9.
Resistances: 1357.1-1352.2; 1364.7-1360.9; 1375.5.
This site has been designed for informational and educational purposes only and does not constitute an offer to sell nor a solicitation of an offer to buy any products which may be referenced upon the site. The services and information provided through this site are for personal, non-commercial, educational use and display. IC Markets does not provide personal trading advice through this site and does not represent that the products or services discussed are suitable for any trader. Traders are advised not to rely on any information contained in the site in the process of making a fully informed decision.
This site may include market analysis. All ideas, opinions, and/or forecasts, expressed or implied herein, information, charts or examples contained in the lessons, are for informational and educational purposes only and should not be construed as a recommendation to invest, trade, and/or speculate in the markets. Any trades, and/or speculations made in light of the ideas, opinions, and/or forecasts, expressed or implied herein, are committed at your own risk, financial or otherwise.
The use of the site is agreement that the site is for informational and educational purposes only and does not constitute advice in any form in the furtherance of any trade or trading decisions.
The accuracy, completeness and timeliness of the information contained on this site cannot be guaranteed. IC Markets does not warranty, guarantee or make any representations, or assume any liability with regard to financial results based on the use of the information in the site.
News, views, opinions, recommendations and other information obtained from sources outside of www.icmarkets.com.au, used in this site are believed to be reliable, but we cannot guarantee their accuracy or completeness. All such information is subject to change at any time without notice. IC Markets assumes no responsibility for the content of any linked site. The fact that such links may exist does not indicate approval or endorsement of any material contained on any linked site.
IC Markets is not liable for any harm caused by the transmission, through accessing the services or information on this site, of a computer virus, or other computer code or programming device that might be used to access, delete, damage, disable, disrupt or otherwise impede in any manner, the operation of the site or of any user’s software, hardware, data or property.


