
DXY:
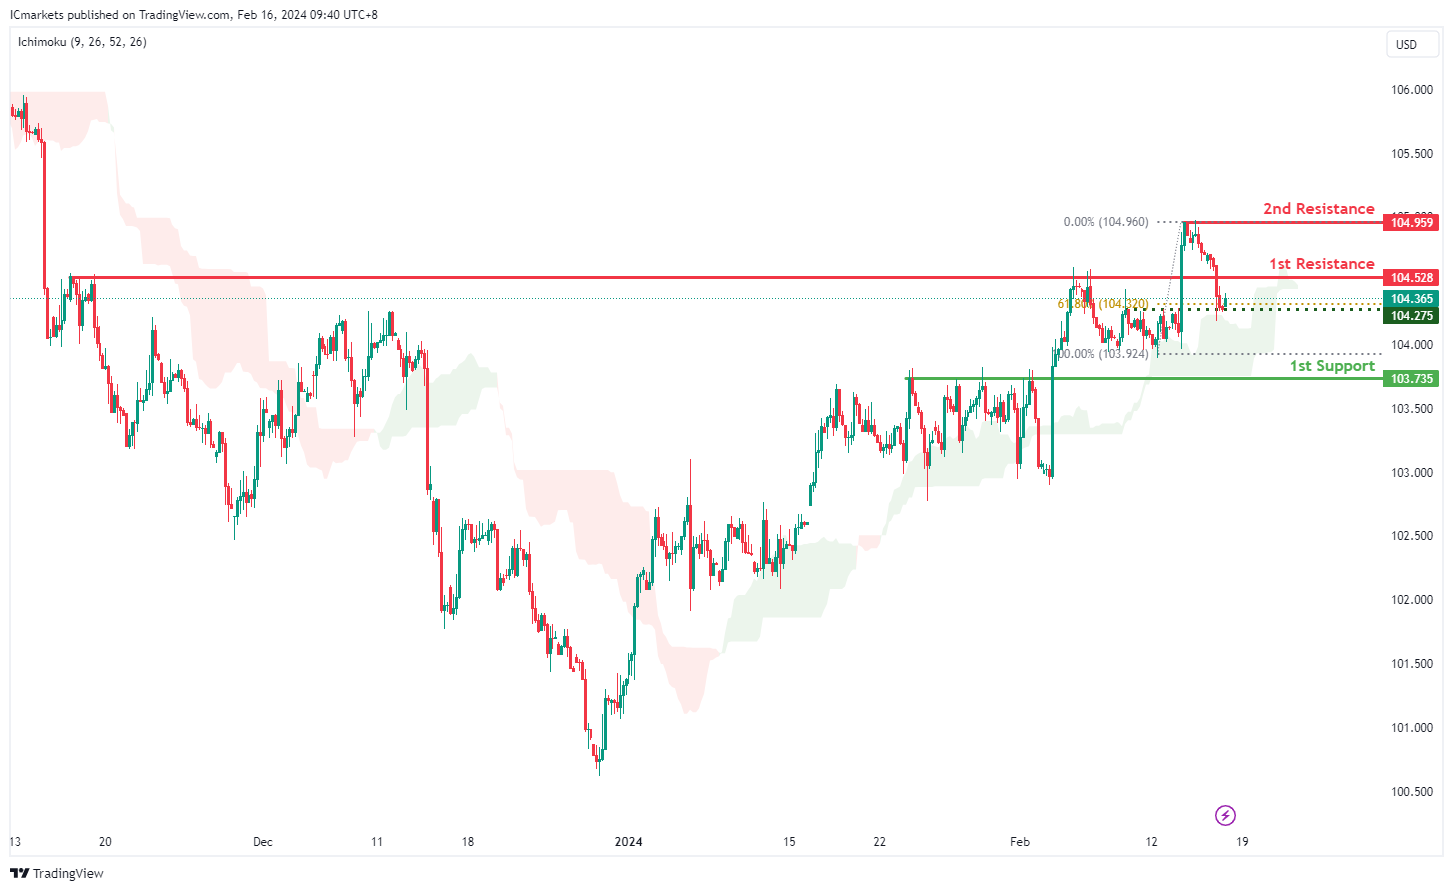
The DXY chart currently demonstrates a bullish overall momentum.
There’s a potential scenario where the price may drop further to the 1st support in the short term before bouncing from there and rising to the 1st resistance.
The 1st support level at 103.73 is identified as a pullback support, suggesting it may attract buying interest as it aligns with a historical pullback level.
On the resistance side, the 1st resistance level at 104.52 is noted as a swing high resistance, indicating its historical significance as a point where selling pressure has been observed in the past.
Additionally, there is a 2nd resistance level at 104.95, identified as a multi-swing high resistance, further reinforcing its importance as a potential barrier for further upward movement.
EUR/USD:
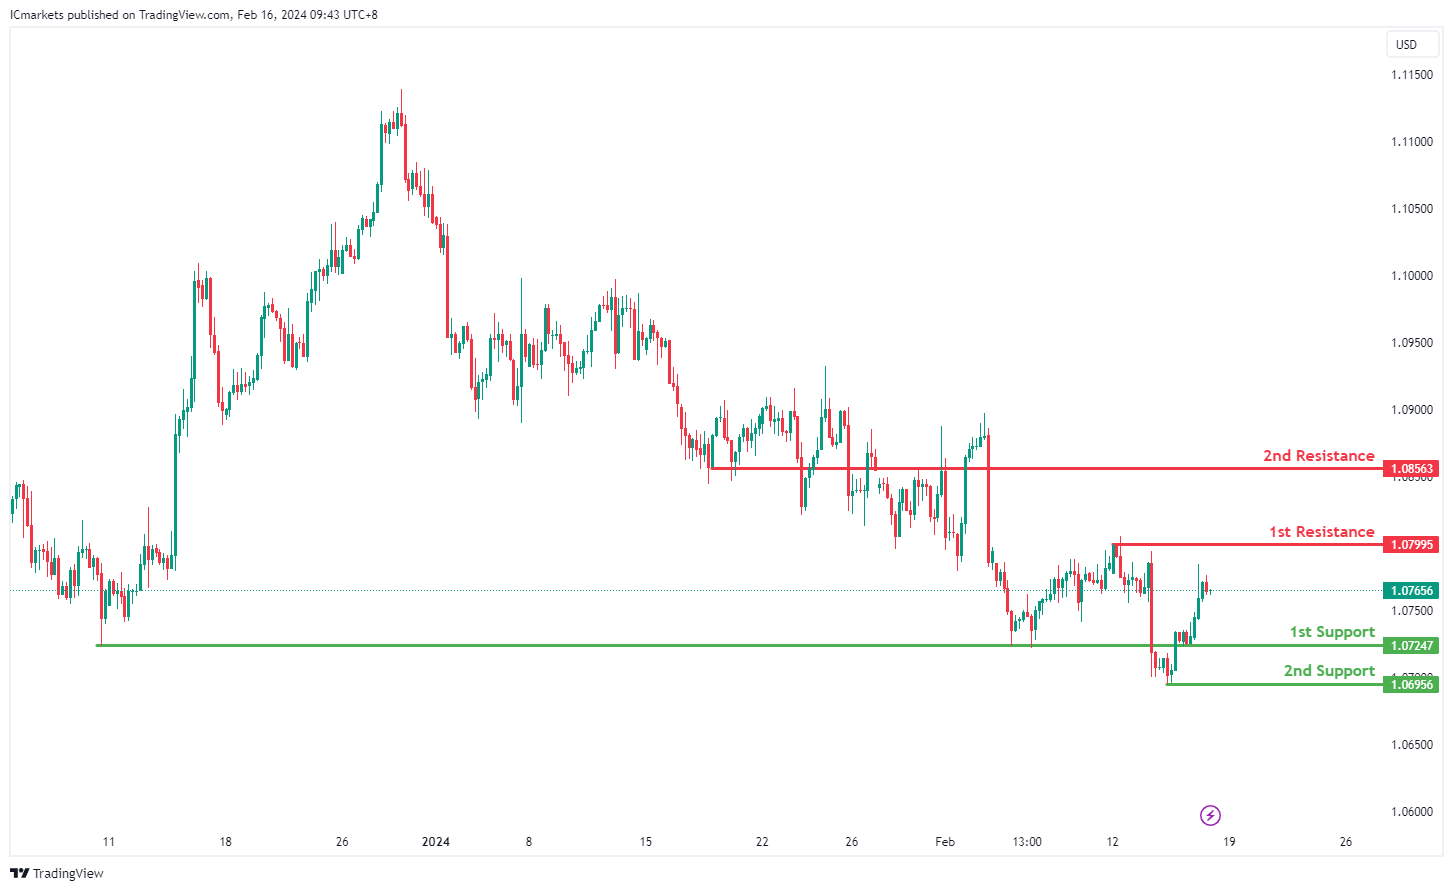
The EUR/USD chart currently exhibits a bearish overall momentum.
There’s a potential scenario where the price could continue its bearish movement towards the 1st support.
The 1st support level at 1.0724 is identified as an overlap support, indicating its historical significance as a level where buying interest may emerge.
Additionally, the 2nd support level at 1.0695 is characterized as a swing low support, further emphasizing its importance as a potential support zone.
On the resistance side, the 1st resistance level at 1.0799 is noted as a swing high resistance, suggesting its historical significance as a point where selling pressure has been observed in the past.
Furthermore, there is a 2nd resistance level at 1.0856, identified as a pullback resistance, which could act as a barrier for further upward movement.
EUR/JPY:
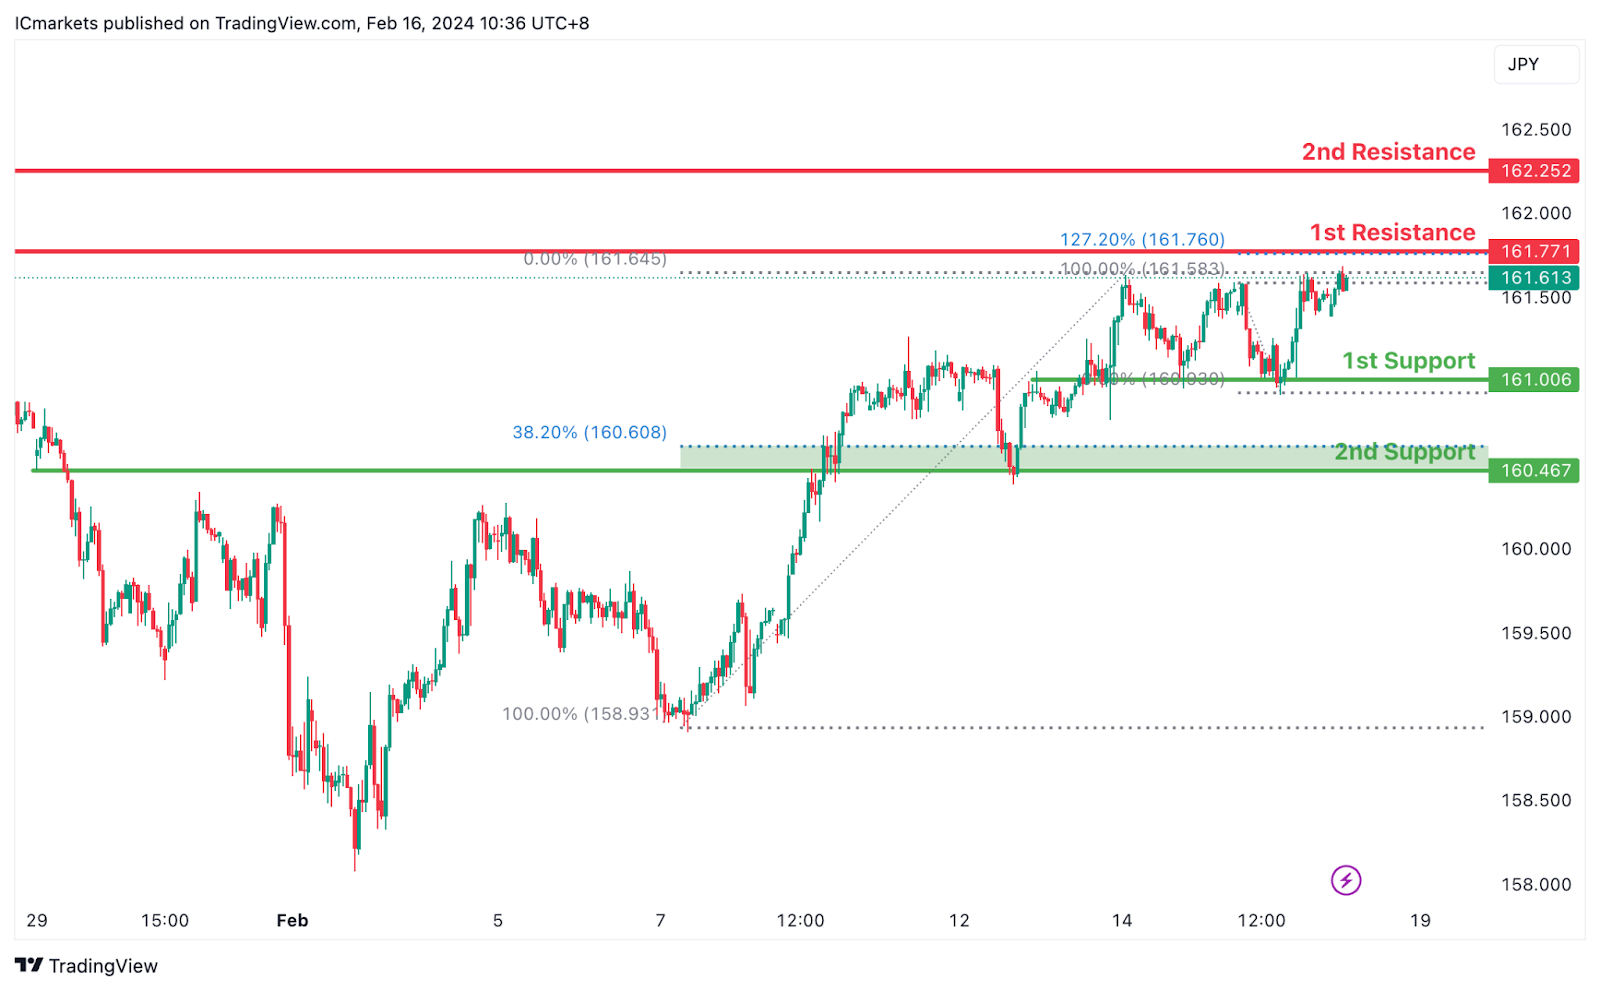
The EUR/JPY chart currently demonstrates a bullish overall momentum, indicating a prevailing upward trend. Several factors contribute to this bullish sentiment, supporting the potential for further upward movement in price.
The 1st support level at 160.006 is significant as it aligns with an overlap support, suggesting a historical level where buying interest has emerged, potentially providing a foundation for continued upward momentum. Additionally, the 2nd support level at 160.467 coincides with both an overlap support and the 38.20% Fibonacci Retracement, further reinforcing its importance as a potential support zone.
On the resistance side, the 1st resistance level at 161.771 corresponds to a swing high resistance and the 127.20% Fibonacci Extension. This convergence of resistance factors suggests a significant historical point where selling pressure has been strong, potentially acting as a barrier to further upward movement.
Further up, the 2nd resistance level at 161.525 aligns with a swing high resistance, adding to its significance as a potential barrier to upward movement.
EUR/GBP:
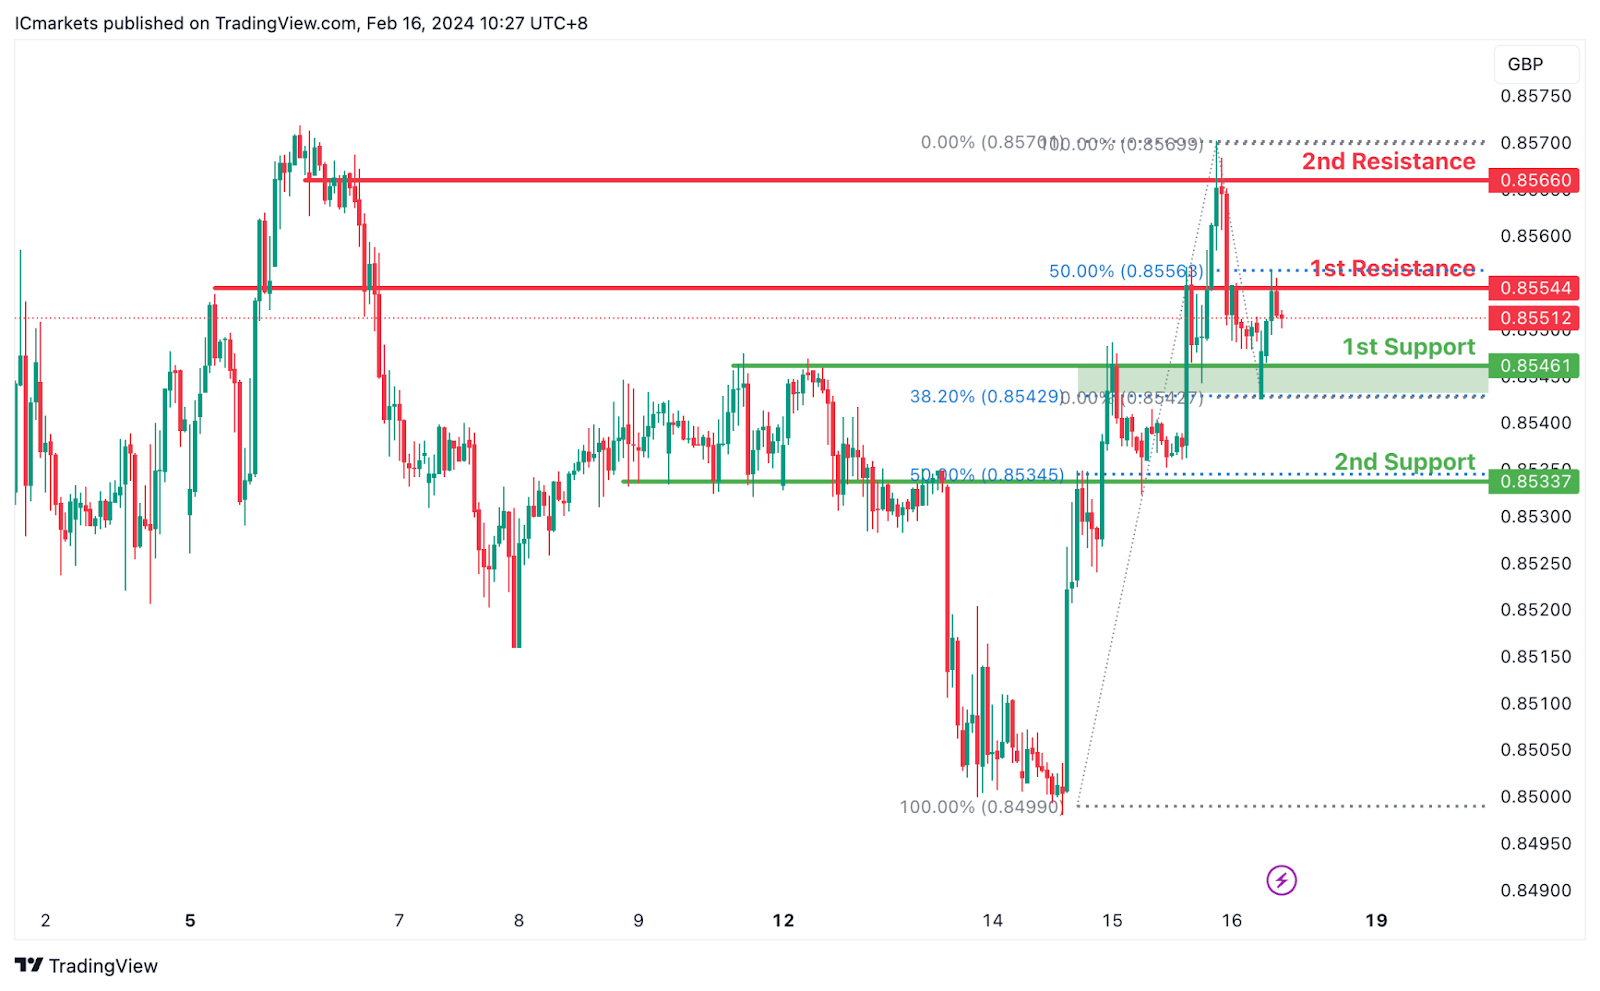
The EUR/GBP chart currently indicates a bearish overall momentum, suggesting a prevailing downward trend. Several factors contribute to this bearish sentiment, supporting the potential for a continued downward movement in price.
The 1st support level at 0.85461 is significant as it aligns with a pullback support and the 38.20% Fibonacci Retracement level. This convergence of support factors suggests a strong level where buying interest may emerge, potentially offering some support to the price.
Furthermore, the 2nd support level at 0.85337 corresponds to an overlap support and the 50% Fibonacci Retracement, reinforcing its significance as a potential support zone.
On the resistance side, the 1st resistance level at 0.85544 aligns with an overlap resistance and the 50% Fibonacci Retracement. This level indicates a historical point where selling pressure may increase, potentially acting as a barrier to further upward movement.
Additionally, the 2nd resistance level at 0.85660 corresponds to an overlap resistance, further solidifying its importance as a potential barrier to upward movement.
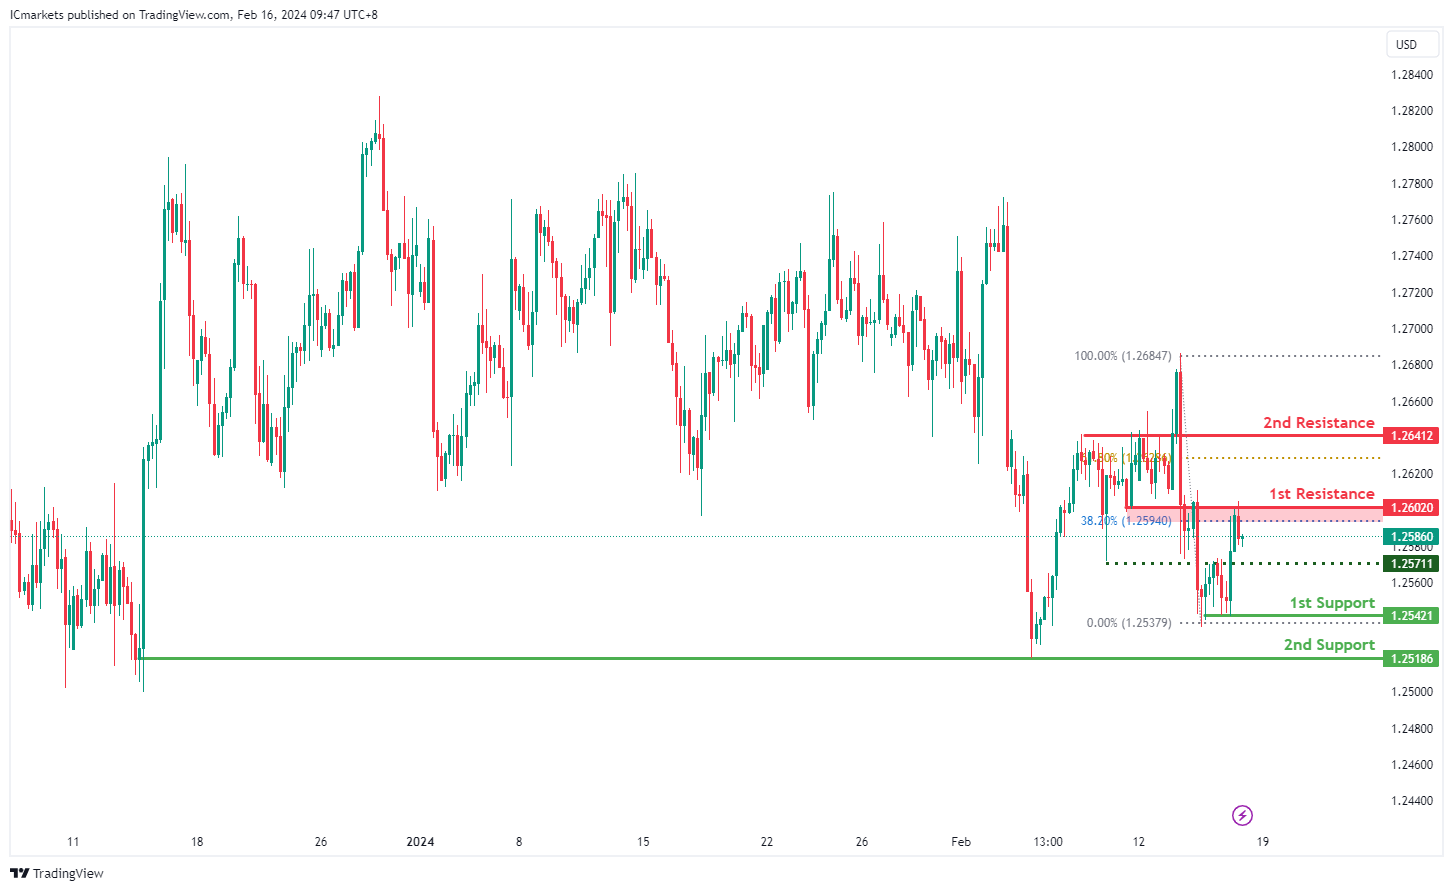
GBP/USD:
The GBP/USD chart currently demonstrates a bearish overall momentum.
There’s a potential scenario where the price reacts bearishly at the 1st resistance and declines towards the 1st support.
The 1st support level at 1.2542 is identified as a multi-swing low support, indicating its historical significance as a level where buying interest may emerge.
Similarly, the 2nd support level at 1.2518 is also noted as a multi-swing low support, reinforcing its importance as a potential support zone.
On the resistance side, the 1st resistance level at 1.2602 is recognized as an overlap resistance, with the presence of the 38.20% Fibonacci Retracement, indicating its historical significance as a potential resistance level.
Furthermore, there is a 2nd resistance level at 1.2641, characterized as a pullback resistance, suggesting its significance as a potential barrier for further upside movement.
Intermediate support at 1.2571 is considered a pullback support, providing additional reinforcement for potential buying interest.
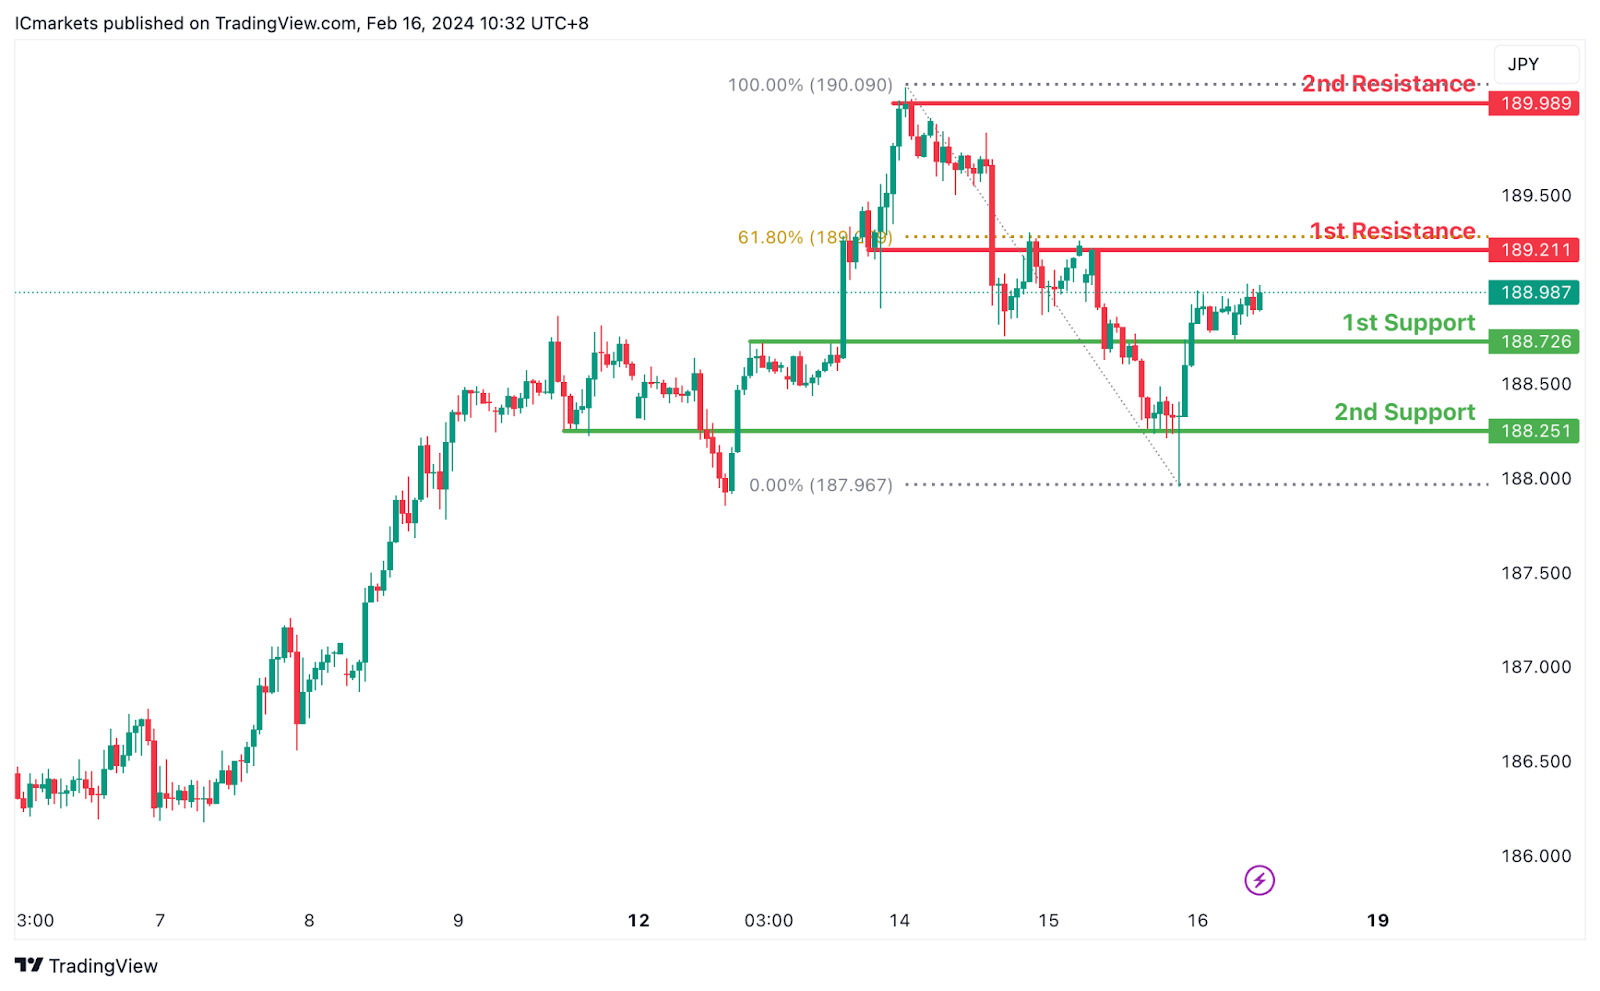
GBP/JPY:
The GBP/JPY chart currently indicates a bullish overall momentum, suggesting a prevailing upward trend. Several factors contribute to this bullish sentiment, supporting the potential for a continued upward movement in price.
The 1st support level at 188.726 aligns with an overlap support, indicating a significant historical level where buying interest has emerged. This level may act as a foundation for further upward movement.
Additionally, the 2nd support level at 188.251 also corresponds to an overlap support, further reinforcing its potential significance as a support zone.
On the resistance side, the 1st resistance level at 189.211 aligns with both an overlap resistance and the 61.80% Fibonacci Retracement. This convergence of resistance factors suggests a historical point where selling pressure may increase, potentially acting as a barrier to further upward movement.
Furthermore, the 2nd resistance level at 189.989 corresponds to a swing high resistance, adding to its significance as a potential barrier to upward movement.
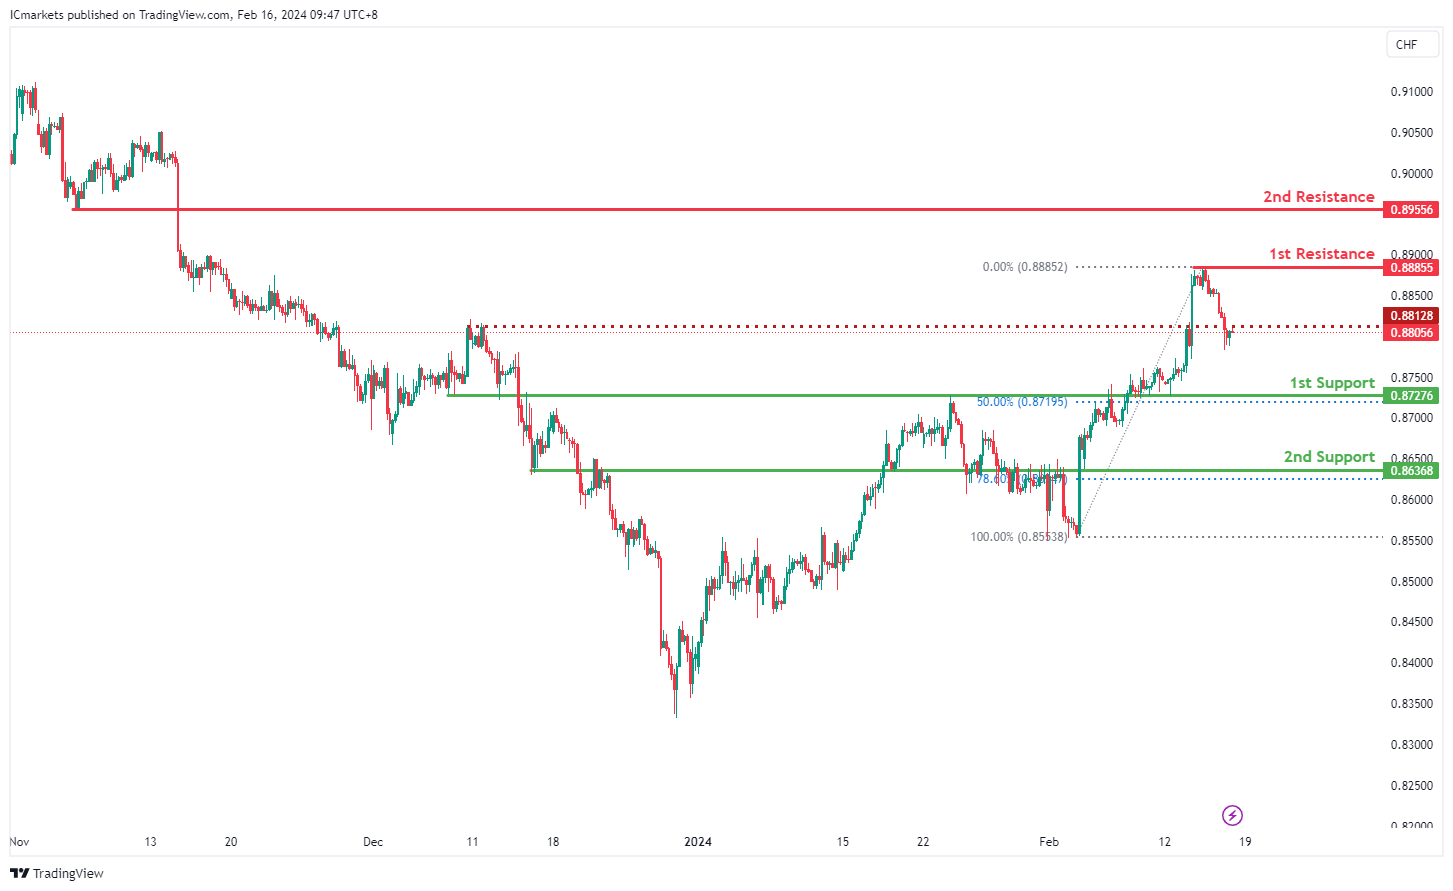
USD/CHF:
The USD/CHF chart currently exhibits a bearish overall momentum.
There’s a potential scenario where the price continues its bearish movement towards the 1st support level.
The 1st support level at 0.8727 is identified as an overlap support, coinciding with the 50% Fibonacci Retracement level, which adds further significance to this support zone.
Additionally, the 2nd support level at 0.8636 is noted as a pullback support, with the 78.60% Fibonacci Retracement level indicating a potential area where buyers might step in to push the price higher.
On the resistance side, the 1st resistance level at 0.8885 is recognized as a multi-swing high resistance, suggesting its historical significance as a level where selling pressure may increase.
Furthermore, there is a 2nd resistance level at 0.8955, characterized as a pullback resistance, indicating its potential role as a barrier for further upward movement in price.
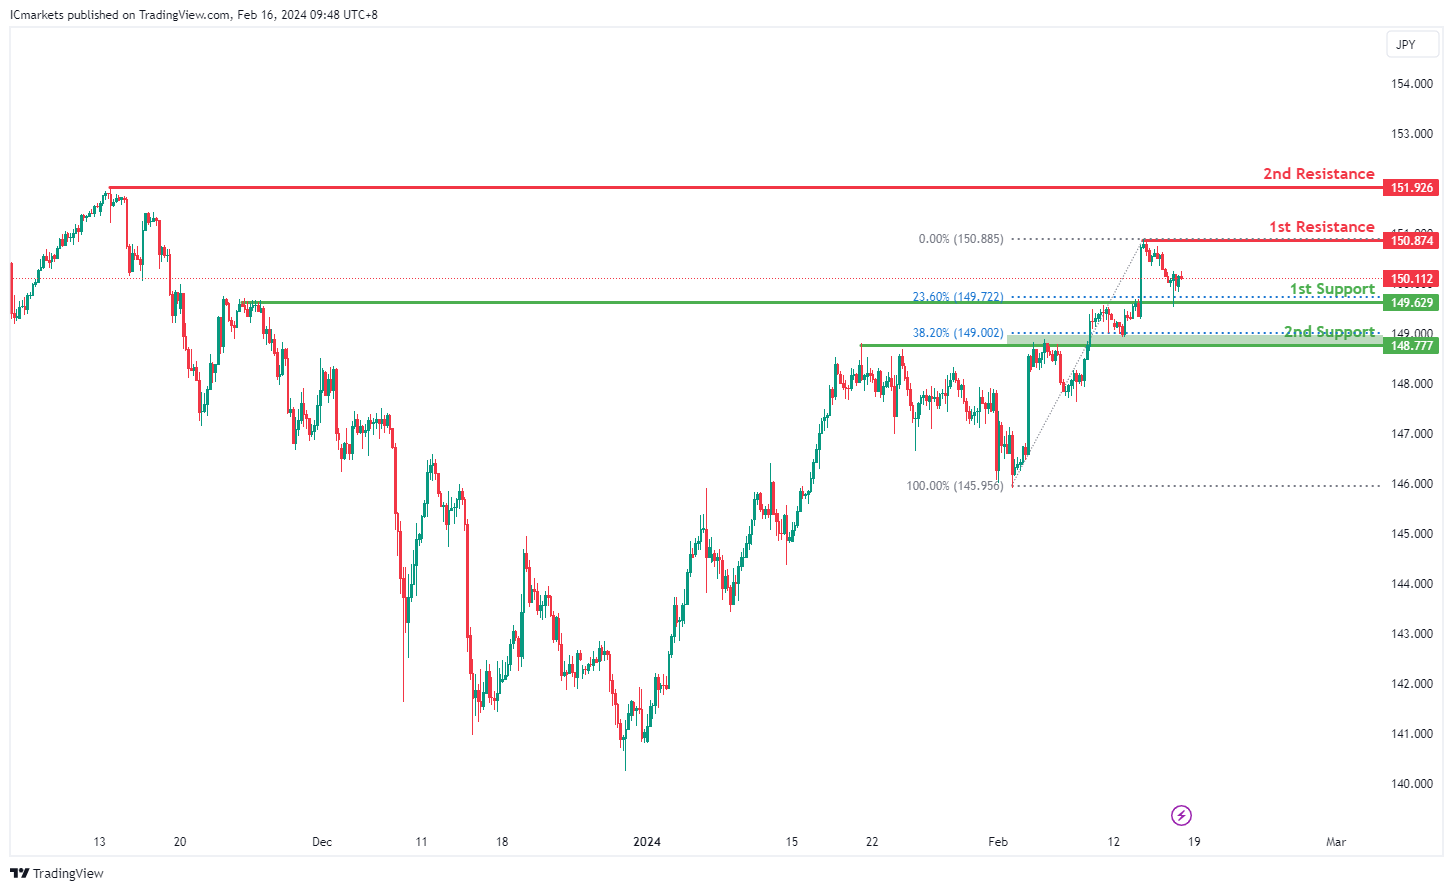
USD/JPY:
The USD/JPY chart currently demonstrates a bullish overall momentum.
There’s a potential scenario where the price continues its bullish movement towards the 1st resistance level.
The 1st support level at 149.62 is identified as an overlap support, coinciding with the 23.60% Fibonacci Retracement level, suggesting a significant level where buyers might enter the market.
Additionally, the 2nd support level at 148.77 is noted as a pullback support, with the 38.20% Fibonacci Retracement level indicating another area of potential buying interest.
On the resistance side, the 1st resistance level at 150.87 is recognized as a swing high resistance, historically acting as a barrier where selling pressure may increase.
Furthermore, there is a 2nd resistance level at 151.92, characterized as another swing high resistance, suggesting its potential role as a significant hurdle for further upward movement in price.
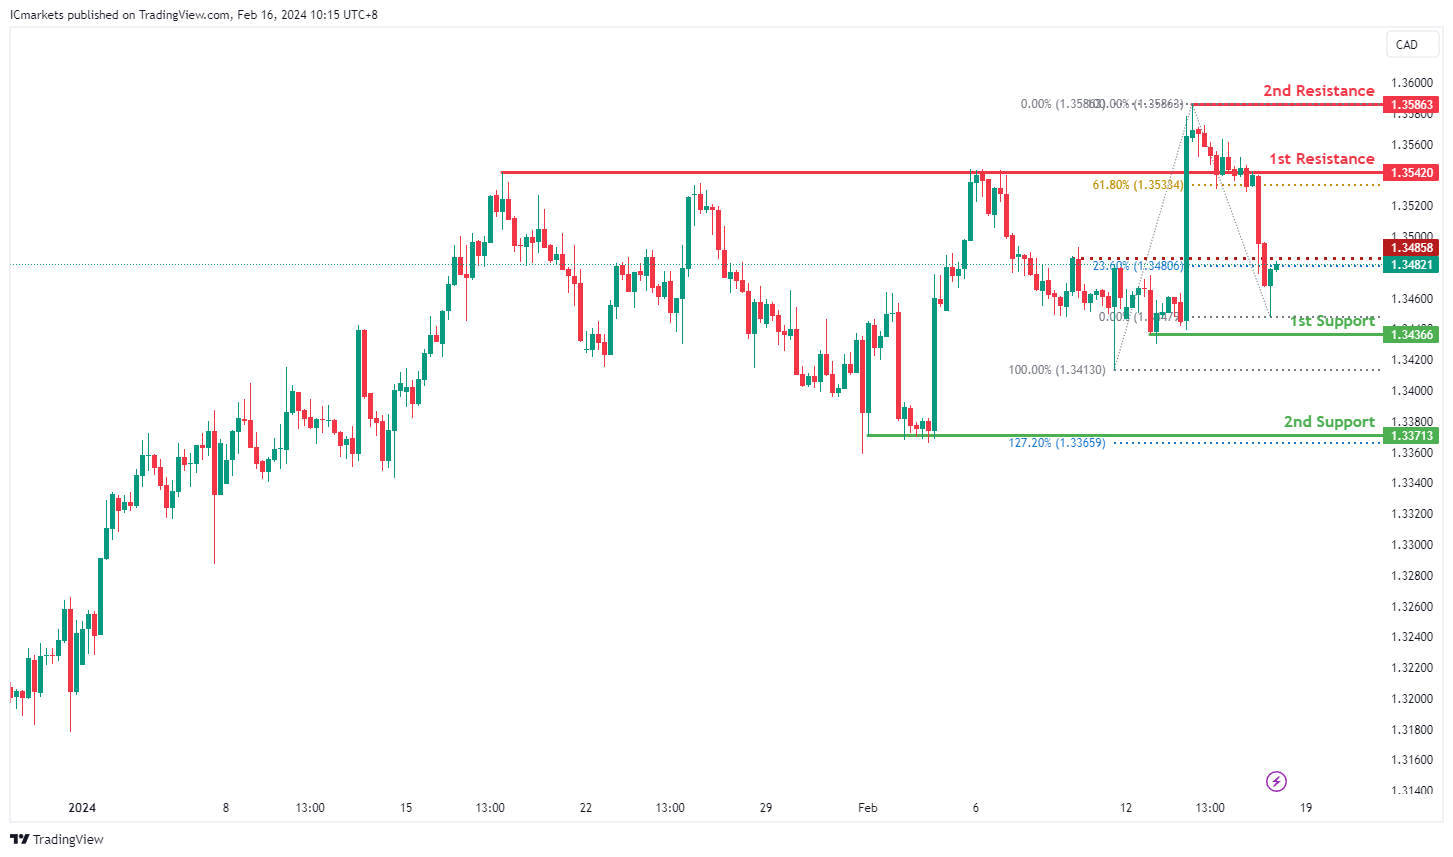
USD/CAD:
The USD/CAD chart currently exhibits an overall bearish momentum. In this context, there is a potential scenario for price to resume the bearish momentum and fall towards the 1st support.
The 1st support level at 1.3436 is identified as a pullback support. Further below, the 2nd support level at 1.3371 is also marked as a pullback support, further emphasizing its importance as a potential support zone.
To the upside, the intermediate resistance level at 1.3485 is identified as a pullback resistance that aligns close to the 23.60% Fibonacci Retracement level while the 1st resistance level at 1.3542 is also marked as a pullback resistance that aligns close to the 61.80% Fibonacci Retracement level. Higher up, the 2nd resistance level at 1.3586 is also noted as a pullback resistance, further highlighting its importance as a potential resistance point.
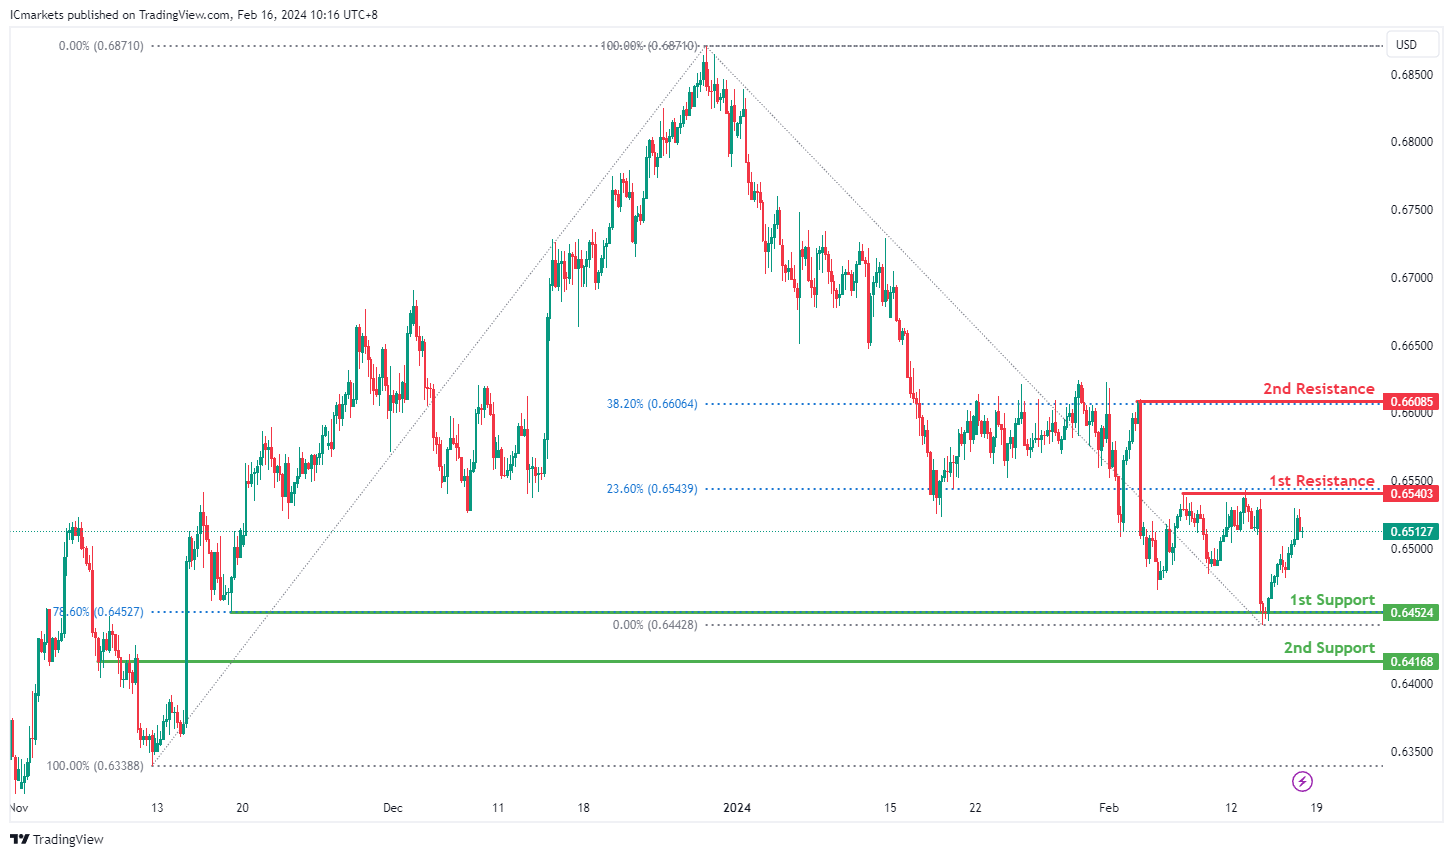
AUD/USD:
The AUD/USD chart currently exhibits a neutral bias. In this context, there is a potential scenario for price to fluctuate between the 1st resistance and the 1st support.
The 1st resistance level at 0.6540 is identified as a pullback resistance that aligns with the 23.60% Fibonacci Retracement level. Higher up, the 2nd resistance level at 0.6608 is also marked as a pullback resistance that aligns with the 38.20% Fibonacci Retracement level, further highlighting its importance as a potential resistance point.
To the downside, the 1st support level at 0.6452 is identified as pullback support that aligns with the 78.60% Fibonacci Retracement level. Further below, the 2nd support level at 0.6416 is noted as an overlap support, further emphasizing its importance as a potential support zone.
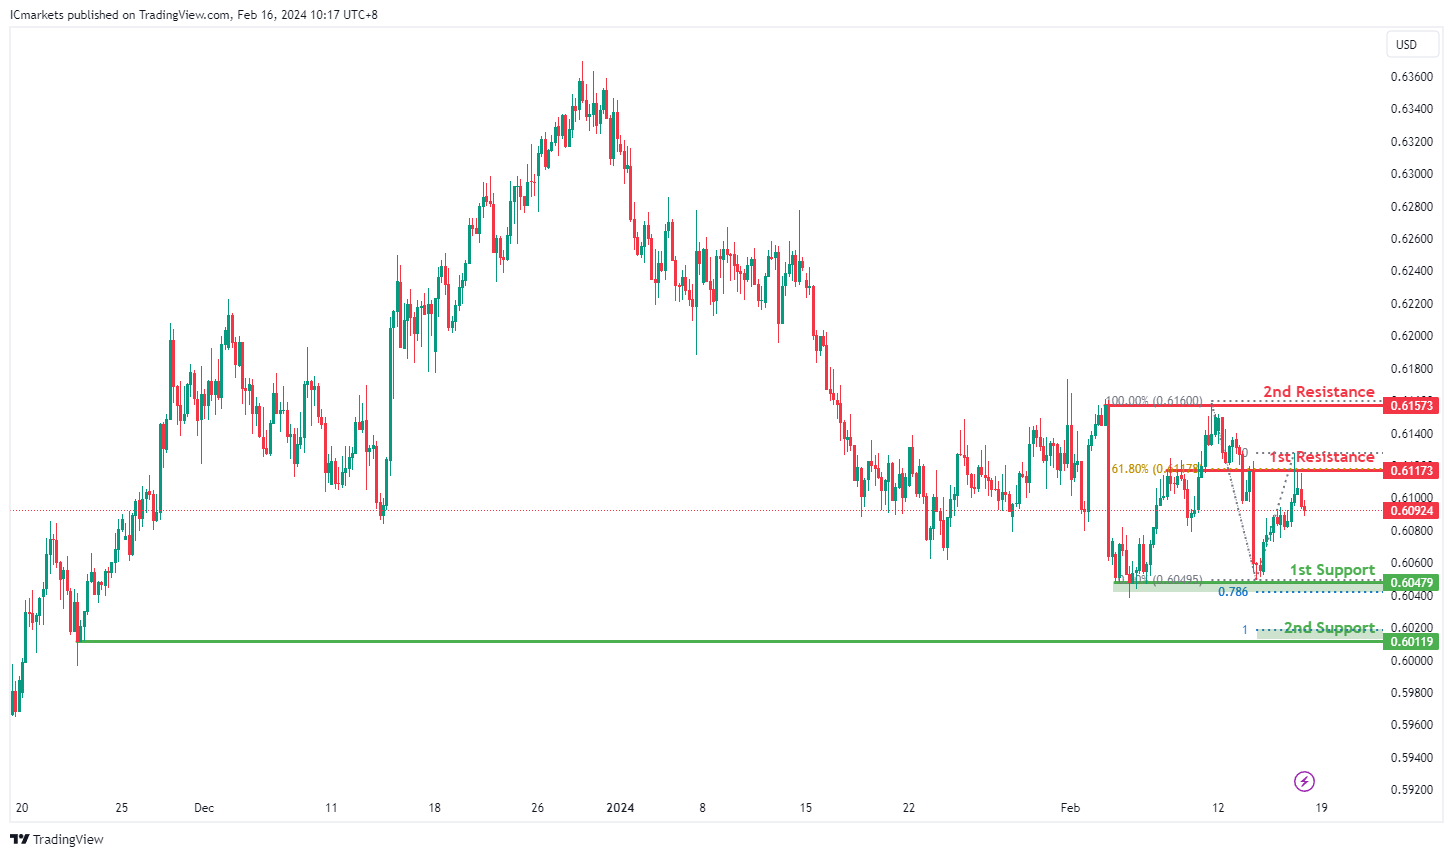
NZD/USD
The NZD/USD chart currently exhibits a neutral bias. In this context, there is a potential scenario for price to fluctuate between the 1st resistance and the 1st support.
The 1st resistance level at 0.6117 is identified as an overlap resistance that aligns with the 61.80% Fibonacci Retracement level. Higher up, the 2nd resistance level at 0.6157 is marked as a pullback resistance, further highlighting its importance as a potential resistance point.
To the downside, the 1st support level at 0.6047 is identified as a pullback support that aligns with the 78.60% Fibonacci Projection level. Further below, the 2nd support level at 0.6019 is also noted as a pullback support that aligns close to the 100.00% Fibonacci Projection level, further emphasizing its importance as a potential support zone.
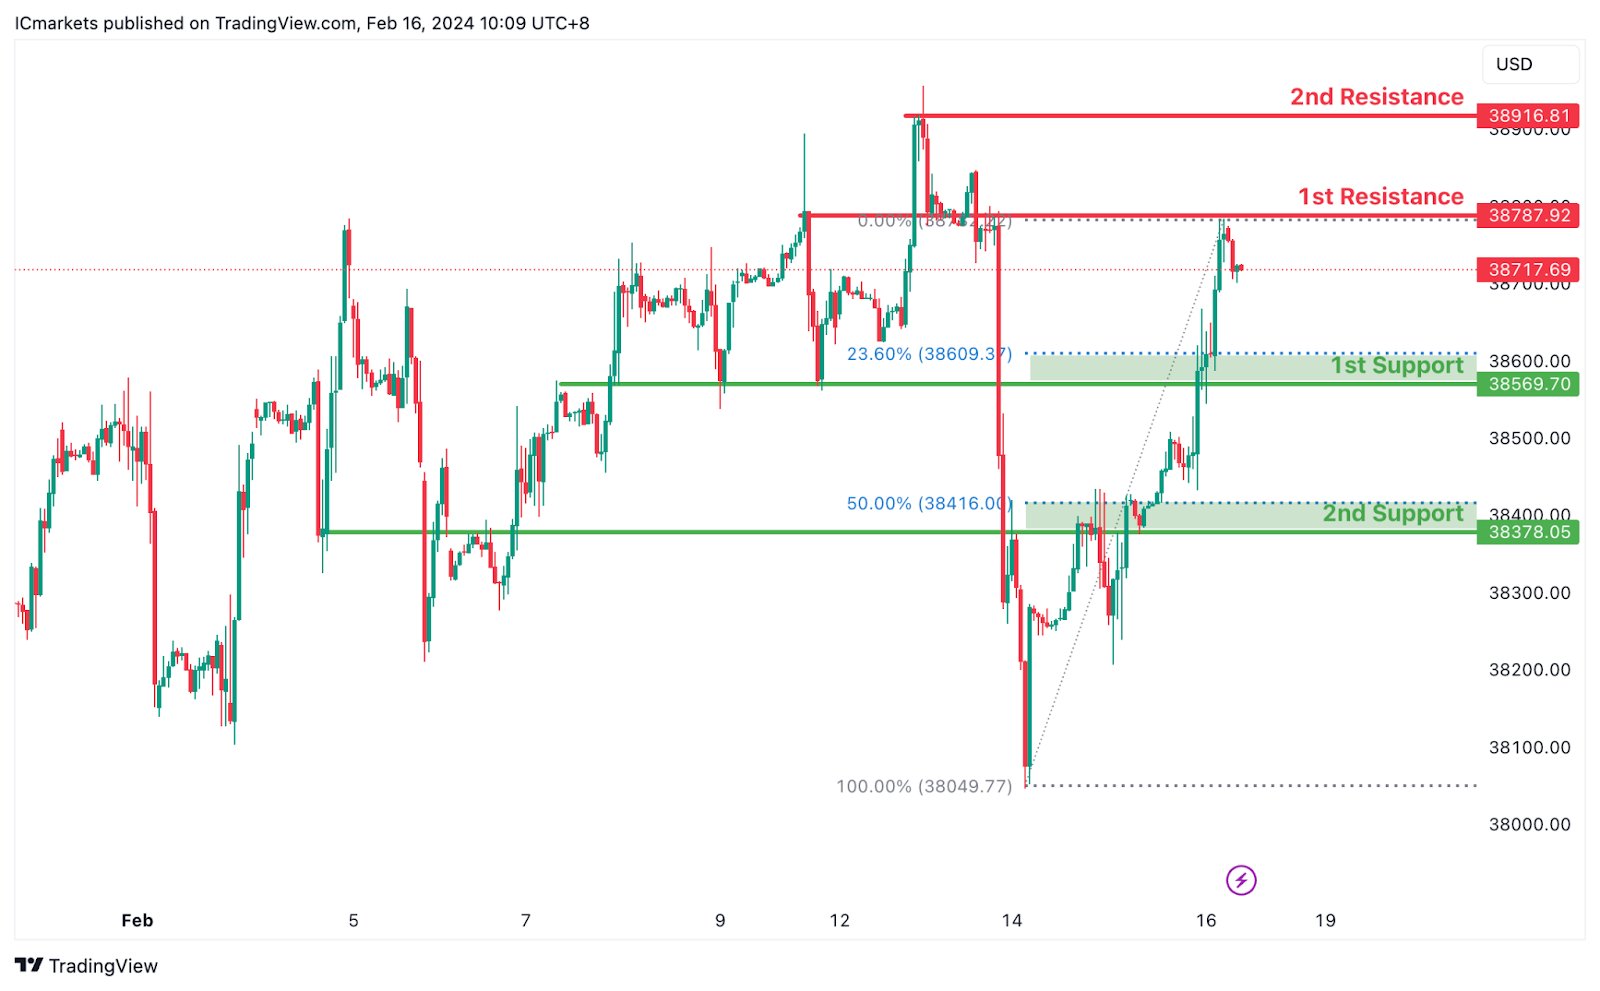
DJ30:
The DJ30 chart currently reflects a bearish overall momentum, indicating a prevailing downward trend. Several factors contribute to this bearish sentiment, supporting the potential for a continued downward movement in price.
The 1st support level at 38569.70 aligns with both an overlap support and the 23.60% Fibonacci Retracement, suggesting a significant historical level where buying interest has emerged. This convergence of support factors indicates a strong potential support zone.
Furthermore, the 2nd support level at 38378.05 corresponds to another overlap support and the 50% Fibonacci Retracement. This reinforces its importance as a potential support level where buyers may step in to support the price.
On the resistance side, the 1st resistance level at 38787.92 aligns with an overlap resistance, indicating a historical point where selling pressure may increase. This level could act as a barrier to further upward movement.
Moreover, the 2nd resistance level at 38916.81 corresponds to a swing high resistance, adding to its significance as a potential barrier to upward movement.
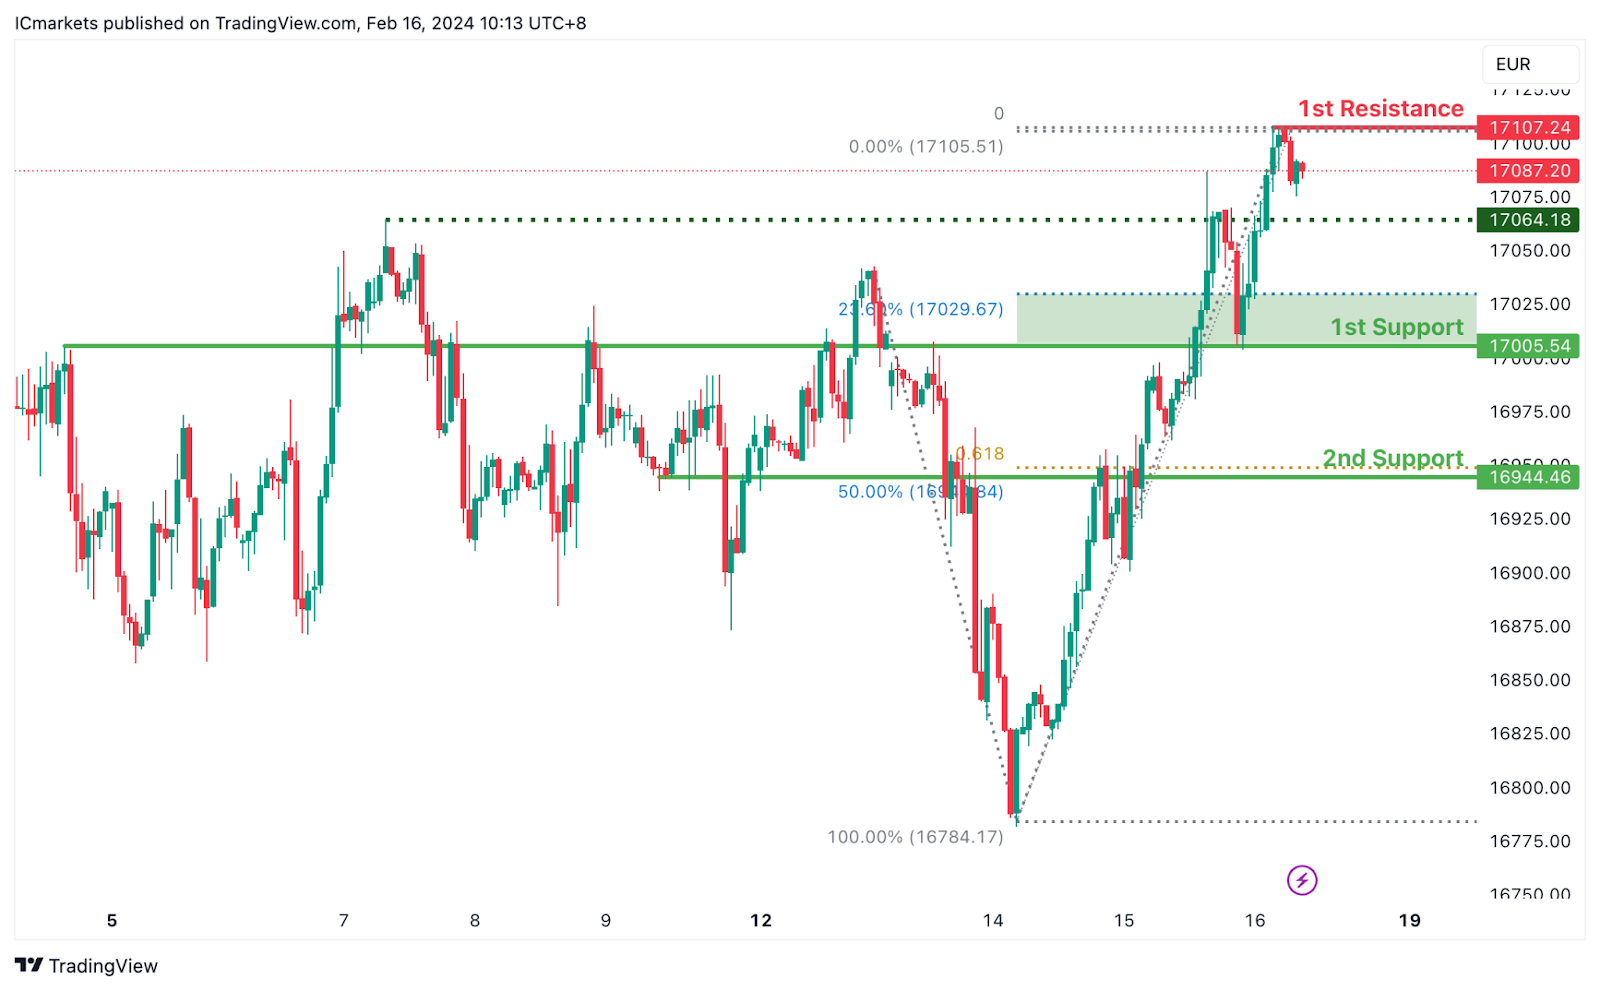
GER40:
The GER40 chart currently exhibits a bearish overall momentum, indicating a prevailing downward trend. Several factors contribute to this bearish sentiment, supporting the potential for a continued downward movement in price.
The 1st support level at 17005.5 aligns with both an overlap support and the 23.60% Fibonacci Retracement, indicating a significant historical level where buying interest has emerged. This convergence of support factors suggests a strong potential support zone.
Additionally, the 2nd support level at 16944.5 corresponds to another overlap support, the 50% Fibonacci Retracement, and the 61.80% Fibonacci Projection. This reinforces its importance as a potential support level where buyers may intervene to support the price. An intermediate support level at 17064.5 is also identified, which aligns with a pullback support, providing additional reinforcement to the support structure.
On the resistance side, the 1st resistance level at 17107.2 aligns with a swing high resistance, suggesting a historical point where selling pressure may increase. This level could act as a barrier to further upward movement.
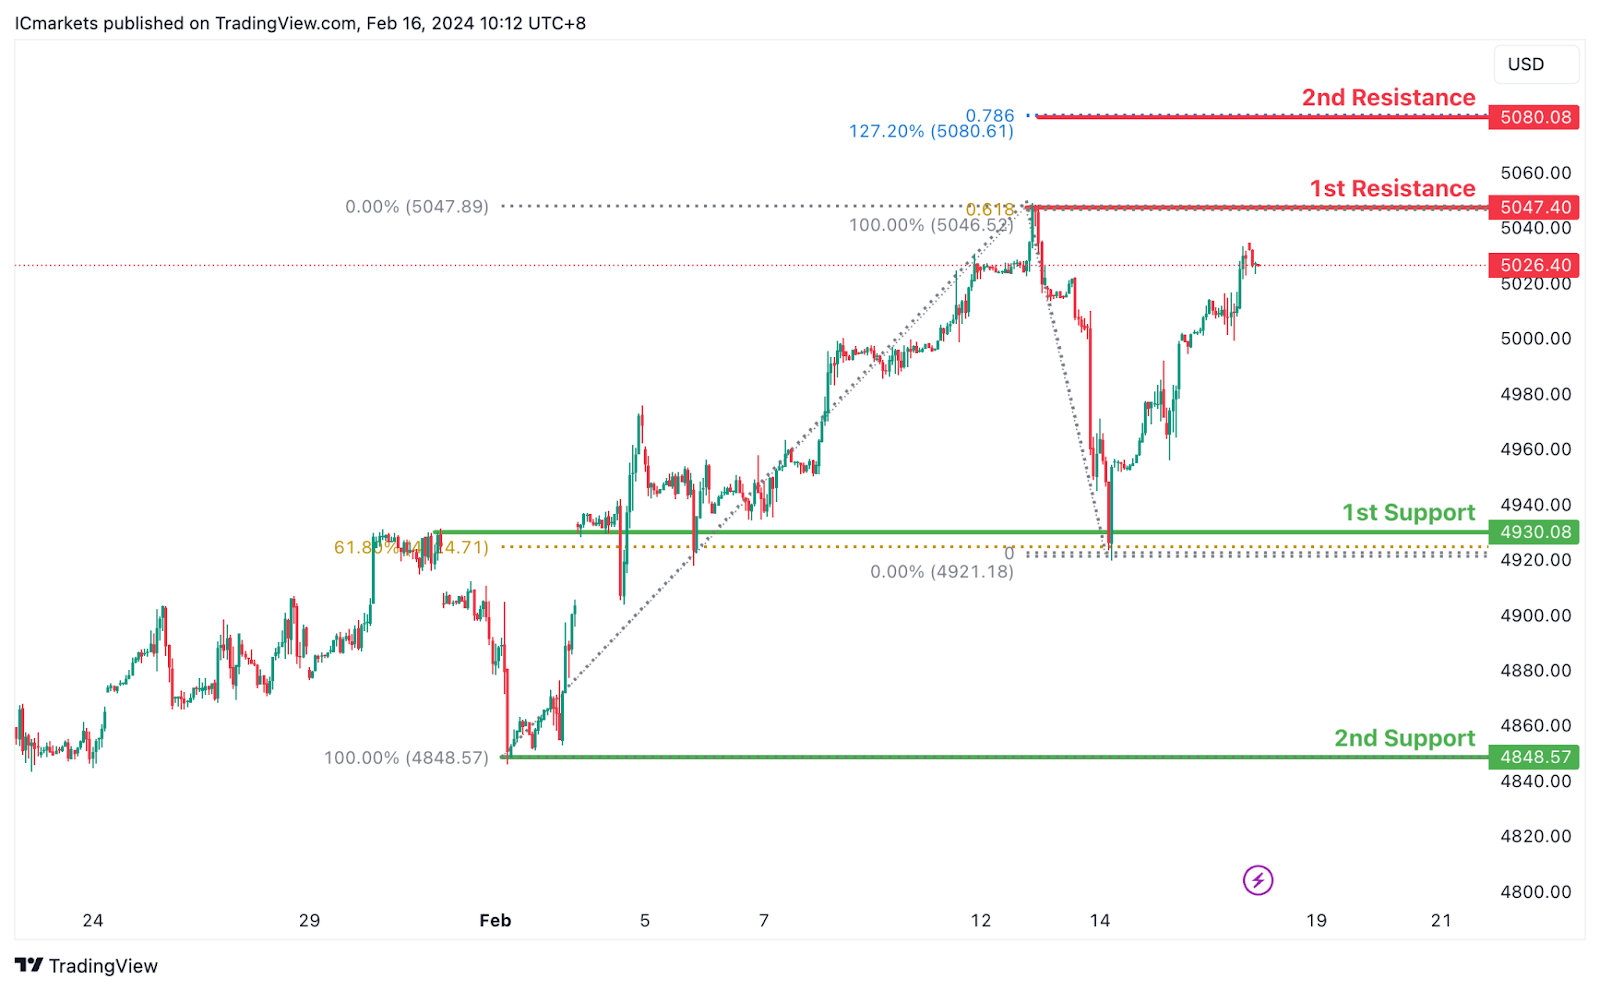
US500:
The US500 chart currently demonstrates a bullish overall momentum, indicating a prevalent upward trend. Several factors contribute to this bullish sentiment, suggesting the potential for a continued upward movement in price.
The 1st support level at 4930.1 is deemed significant as it aligns with both an overlap support and the 61.80% Fibonacci Retracement level. This convergence of support factors suggests a robust level where buying interest has historically emerged, potentially providing a solid foundation for further upward movement.
Additionally, the 2nd support level at 4848.6 corresponds to a swing low support, further reinforcing its importance as a potential support zone. This level indicates a significant historical level where buyers have previously intervened to support the price.
On the resistance side, the 1st resistance level at 5047.4 is identified as a point where selling pressure may increase, as it represents a swing high resistance and aligns with the 61.80% Fibonacci Projection. This suggests a historical point where selling interest has been strong and could act as a barrier to further upward movement.
Further up, the 2nd resistance level at 5080.1 aligns with both the 127.20% and 78.60% Fibonacci Extensions, adding to its significance as a potential barrier to upward movement.
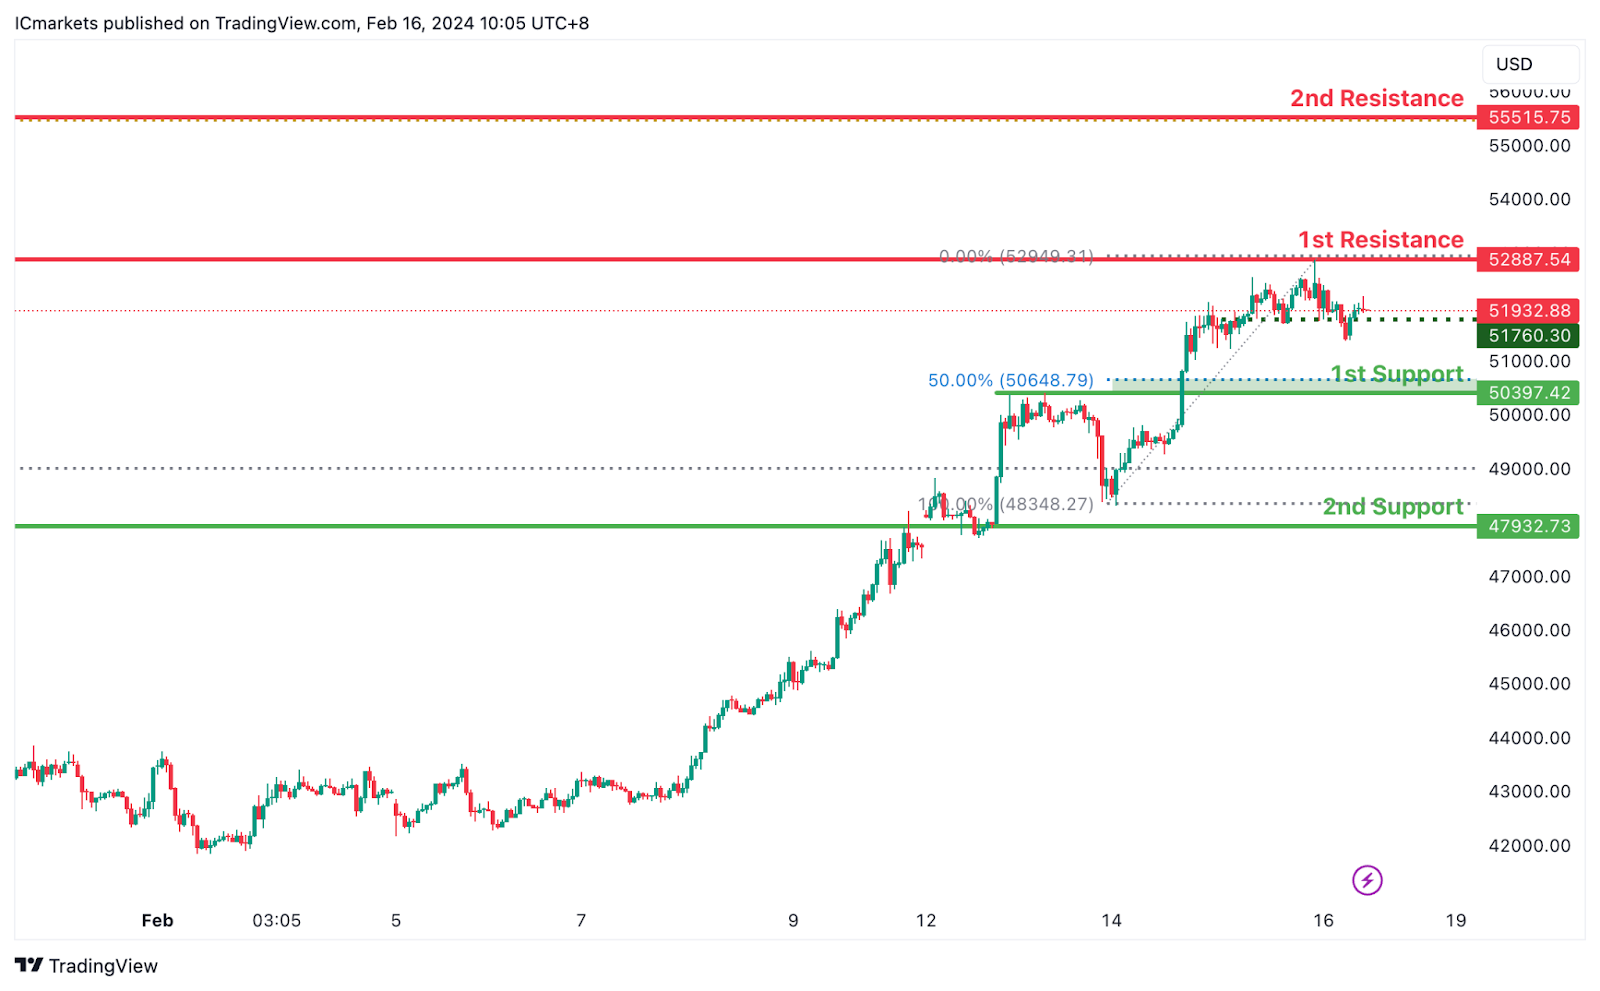
BTC/USD:
The BTC/USD chart currently demonstrates a bullish overall momentum, indicating a prevailing upward trend. Several factors support the potential for a continued upward movement in price.
The 1st support level at 50397.42 is significant as it aligns with both a pullback support and the 50% Fibonacci Retracement level. This confluence suggests a strong historical level where buying interest has emerged, potentially providing support for further upward movement.
Additionally, the 2nd support level at 47923.73 corresponds to an overlap support, reinforcing its importance as a potential support zone. This level indicates a significant historical level where buyers have previously stepped in to support the price.
On the resistance side, the 1st resistance level at 52887.54 is identified as a point where selling pressure may increase, as it represents a multi-swing high resistance. This level suggests a historical point where selling interest has been strong and could act as a barrier to further upward movement.
Further up, the 2nd resistance level at 55515.75 aligns with a swing high resistance, adding to its significance as a potential barrier to upward movement.
An intermediate support level at 51760.30 is also identified, aligning with a pullback support, providing additional reinforcement to the support structure.
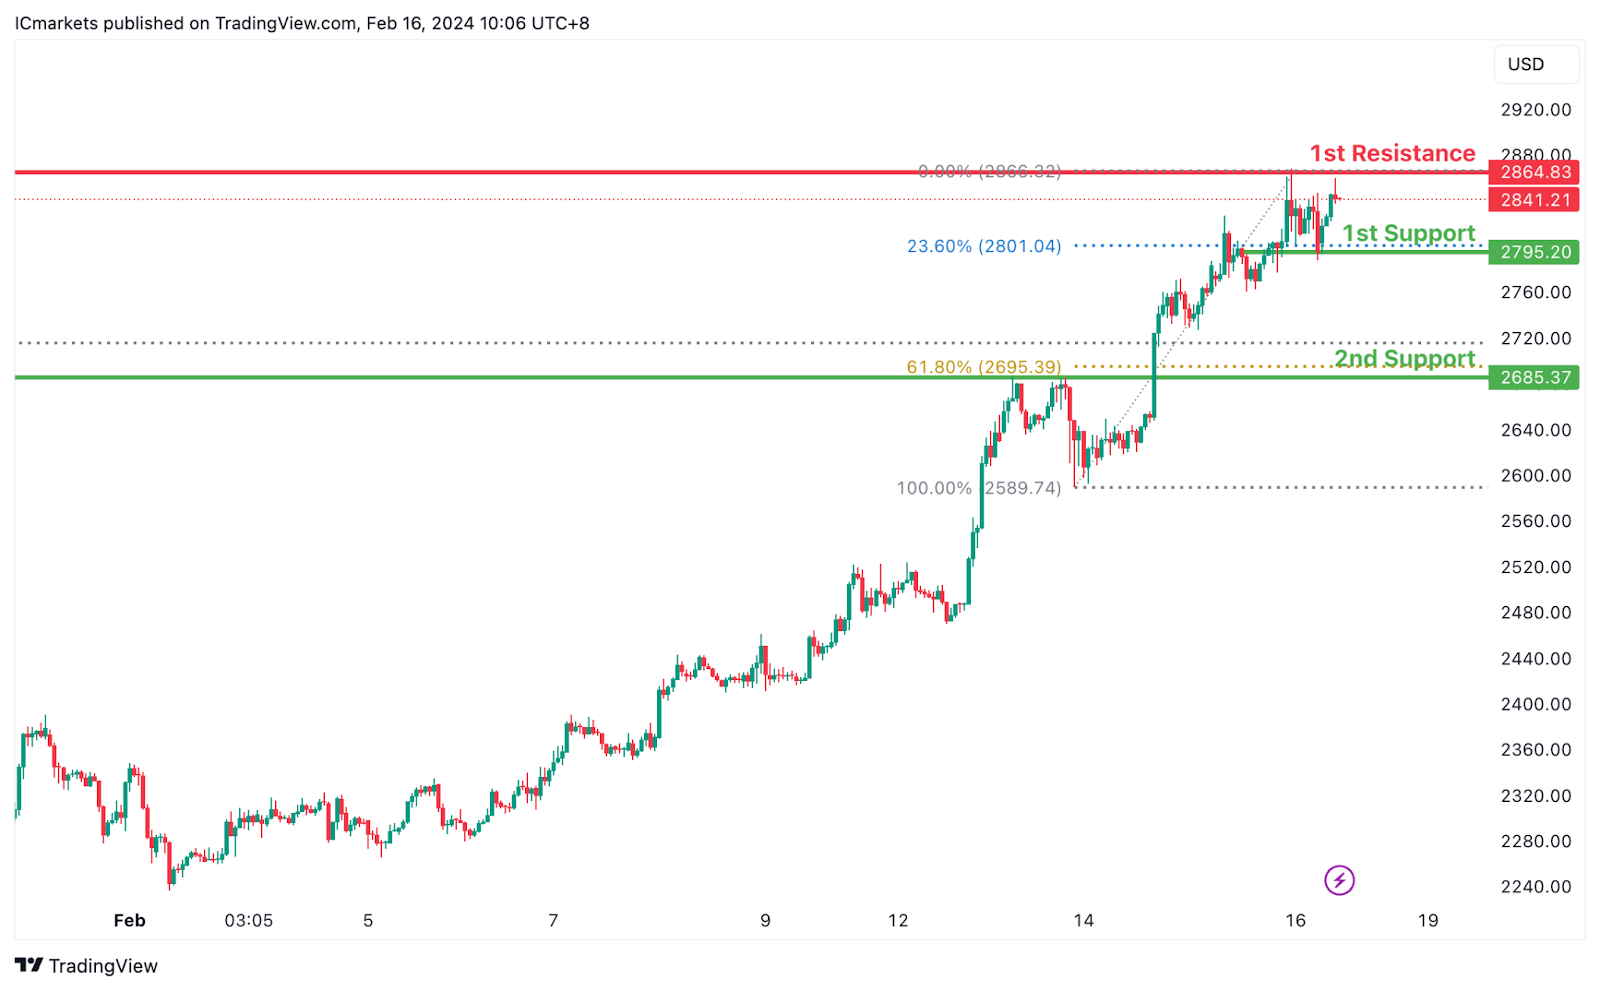
ETH/USD:
The ETH/USD chart currently shows a bullish overall momentum, indicating a prevailing upward trend. Several factors contribute to this bullish sentiment, supporting the potential for a continued upward movement in price.
The 1st support level at 2795.20 is significant as it aligns with both an overlap support and the 23.60% Fibonacci Retracement level. This convergence suggests a strong historical level where buying interest has emerged, potentially providing a solid foundation for further upward movement.
Additionally, the 2nd support level at 2685.37 corresponds to another overlap support and the 61.80% Fibonacci Retracement level, reinforcing its importance as a potential support zone. This level indicates a significant historical level where buyers have previously stepped in to support the price.
On the resistance side, the 1st resistance level at 2864.83 is identified as a point where selling pressure may increase, as it represents a swing high resistance. This level suggests a historical point where selling interest has been strong and could act as a barrier to further upward movement.
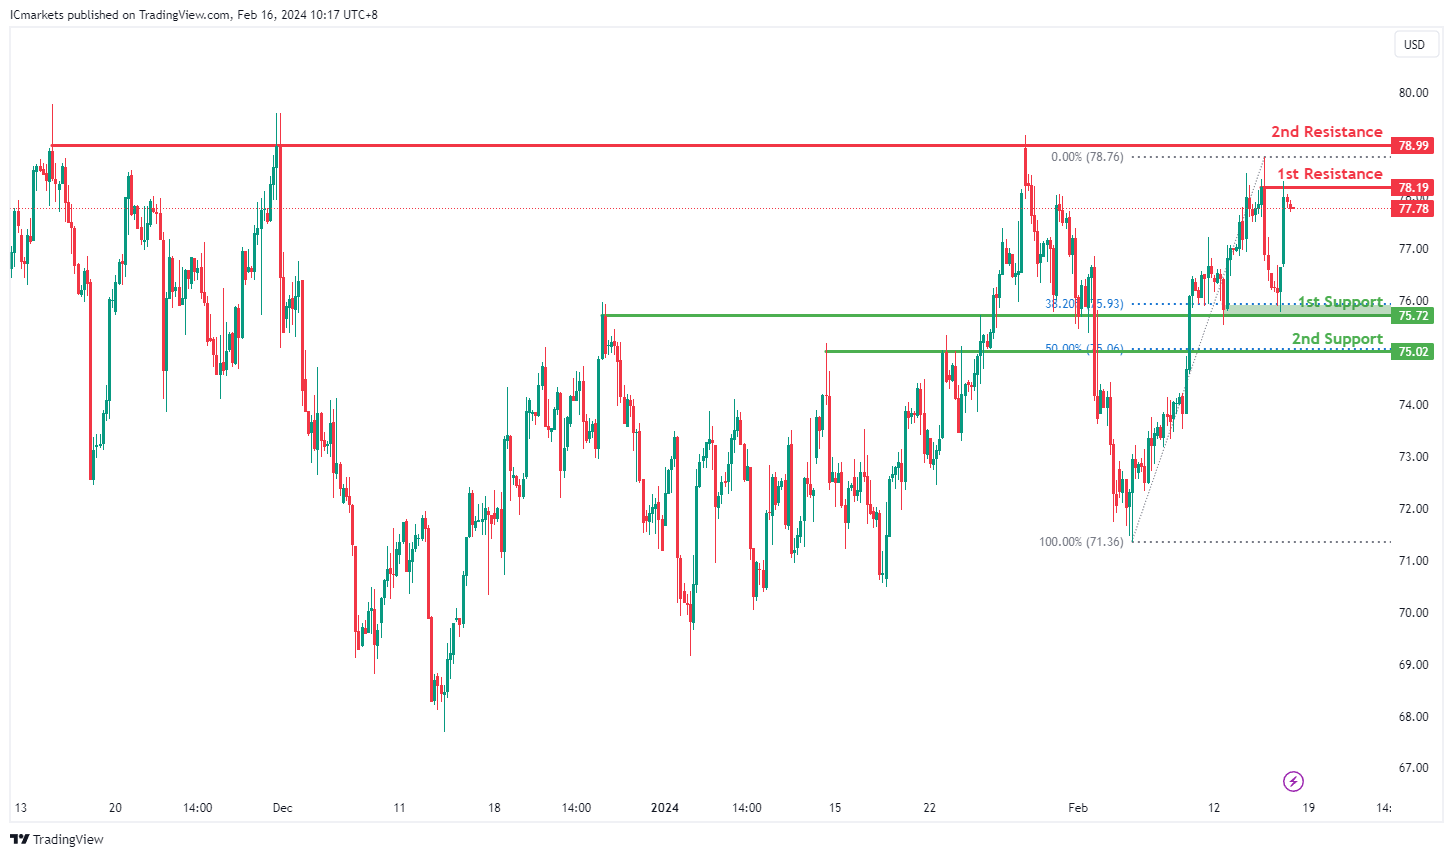
WTI/USD:
The WTI (West Texas Intermediate) chart currently exhibits an overall bullish momentum. In this context, there is a potential scenario for price to rise towards the 1st resistance.
The 1st resistance level at 78.19 is identified as a pullback resistance. Higher up, the 2nd resistance level at 78.99 is marked as a multi-swing-high resistance, further highlighting its importance as a potential resistance zone.
To the downside, the 1st support level at 75.72 is identified as an overlap support that aligns close to the 38.20% Fibonacci Retracement level. Further below, the 2nd support level at 75.02 is also noted as an overlap support that aligns with the 50.00% Fibonacci Retracement level, reinforcing its significance as a key support level.
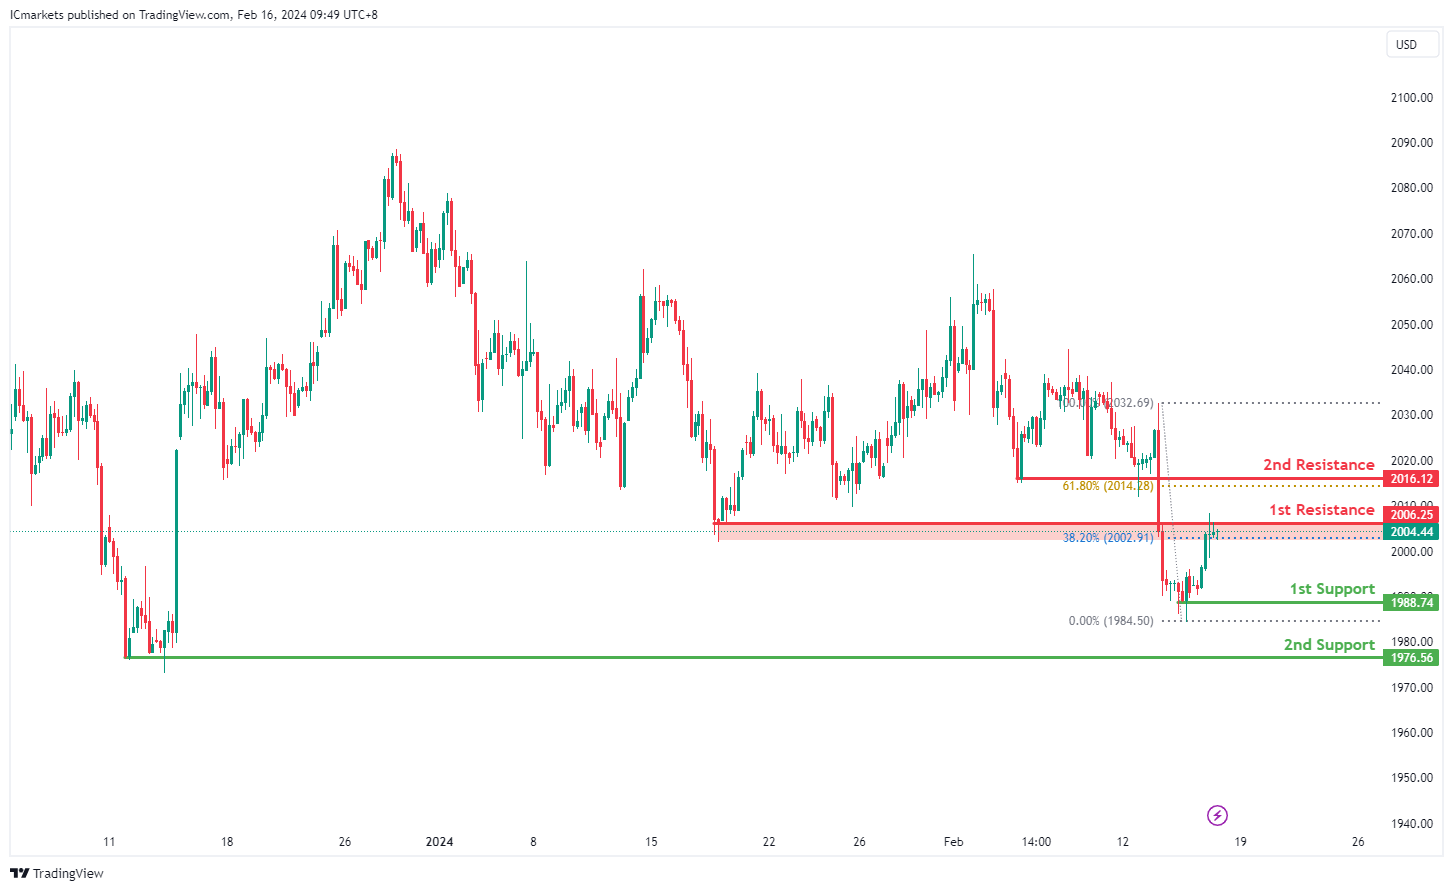
XAU/USD (GOLD):
The current momentum of XAUUSD is bearish, suggesting a potential downward movement in price.
There’s a possibility of a bearish reaction off the 1st resistance level, leading to a drop towards the 1st support level.
The 1st support level is identified at 1988.74, supported by its historical significance as a swing low, indicating potential buying interest in this area.
Additionally, the 2nd support level lies at 1976.56, which is considered a multi-swing low support, further strengthening its significance as a potential level where buyers may enter the market.
On the resistance side, the 1st resistance level stands at 2006.25, characterized as a pullback resistance, coinciding with the 38.20% Fibonacci Retracement level. This suggests a potential barrier where selling pressure may increase.
Furthermore, there is a 2nd resistance level at 2016.12, also identified as a pullback resistance, with the 61.80% Fibonacci Retracement level indicating another area where selling pressure may intensify, potentially leading to a bearish reaction.
The accuracy, completeness and timeliness of the information contained on this site cannot be guaranteed. IC Markets does not warranty, guarantee or make any representations, or assume any liability regarding financial results based on the use of the information in the site.
News, views, opinions, recommendations and other information obtained from sources outside of www.icmarkets.com, used in this site are believed to be reliable, but we cannot guarantee their accuracy or completeness. All such information is subject to change at any time without notice. IC Markets assumes no responsibility for the content of any linked site.
The fact that such links may exist does not indicate approval or endorsement of any material contained on any linked site. IC Markets is not liable for any harm caused by the transmission, through accessing the services or information on this site, of a computer virus, or other computer code or programming device that might be used to access, delete, damage, disable, disrupt or otherwise impede in any manner, the operation of the site or of any user’s software, hardware, data or property.


