
DXY:
The DXY (US Dollar Index) chart currently exhibits a bearish overall momentum, despite recently crossing above the Ichimoku cloud, which suggests a degree of uncertainty. There’s a possibility of a short-term drop in the price, targeting the 1st support level at 104.44, which is marked as an overlap support. This level could act as a significant area of price support. Additionally, there’s an intermediate support at 105.13, characterized as a pullback support.
On the resistance side, the 1st resistance level at 105.35 is identified as a point of potential reversal, primarily due to being a pullback resistance and coinciding with the 127.20% Fibonacci Extension. Beyond that, the 2nd resistance at 105.85 is noted as a swing high resistance, signifying its importance as a potential barrier to upward movements.
.

EUR/USD:
The EUR/USD chart currently maintains a bearish overall momentum characterized by several contributing factors. These factors include the presence of a bearish descending channel, the price trading below the bearish Ichimoku cloud, and being within a broader bearish channel. Collectively, these conditions suggest that the price is likely to continue its downward trajectory.
However, in the short term, there’s a potential scenario where the price could experience a temporary rise towards the 1st resistance level at 1.0689. This level is identified as a pullback resistance, potentially acting as a short-term barrier to upward movements.
On the support side, the 1st support at 1.0643 is considered a significant multi-swing low support, and the 2nd support at 1.0532 is another multi-swing low support level, both indicating strong potential support zones. The 1st resistance level at 1.0773 is marked as an overlap resistance, potentially acting as a point of reversal due to its significance.

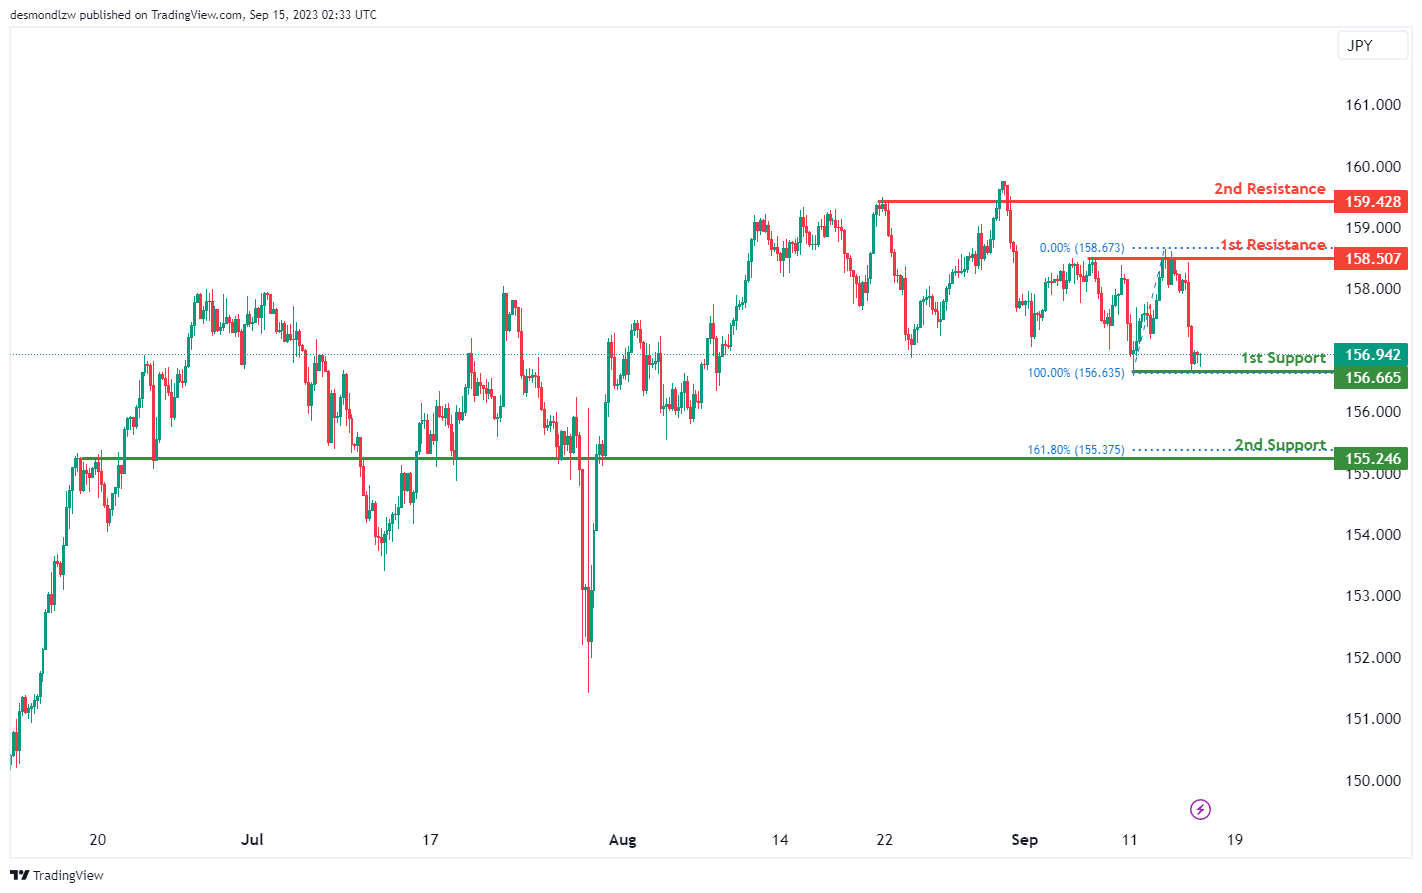
EUR/JPY:
The EUR/JPY chart currently exhibits an overall neutral momentum. This suggests that the price may fluctuate between the 1st support and the 1st resistance levels.
The 1st support level at 156.67 is identified as a pullback support while the 2nd support level at 155.25 is marked as an overlap support that aligns with the 161.8% Fibonacci extension level.
To the upside, the 1st resistance level at 158.51 is identified as a multi-swing-high resistance while the 2nd resistance level at 159.43 is also marked by multi-swing-high resistance, signifying its significance as a potential barrier to price appreciation.
EUR/GBP:
The overall momentum of the EUR/GBP chart is currently categorized as neutral. This suggests that the price may fluctuate between the 1st support and the 1st resistance levels.
The is an intermediate support level at 0.8573 that is identified as an overlap support that aligns with the 78.60% Fibonacci retracement level. The 1st support level at 0.8555 is also marked as an overlap support. Furthermore, the 2nd support level at 0.8524 is identified as a pullback support, reinforcing its potential as a support zone.
To the upside, the 1st resistance level at 0.8595 level is identified as an overlap resistance while the end resistance level at 0.8613 is marked as a swing-high resistance.

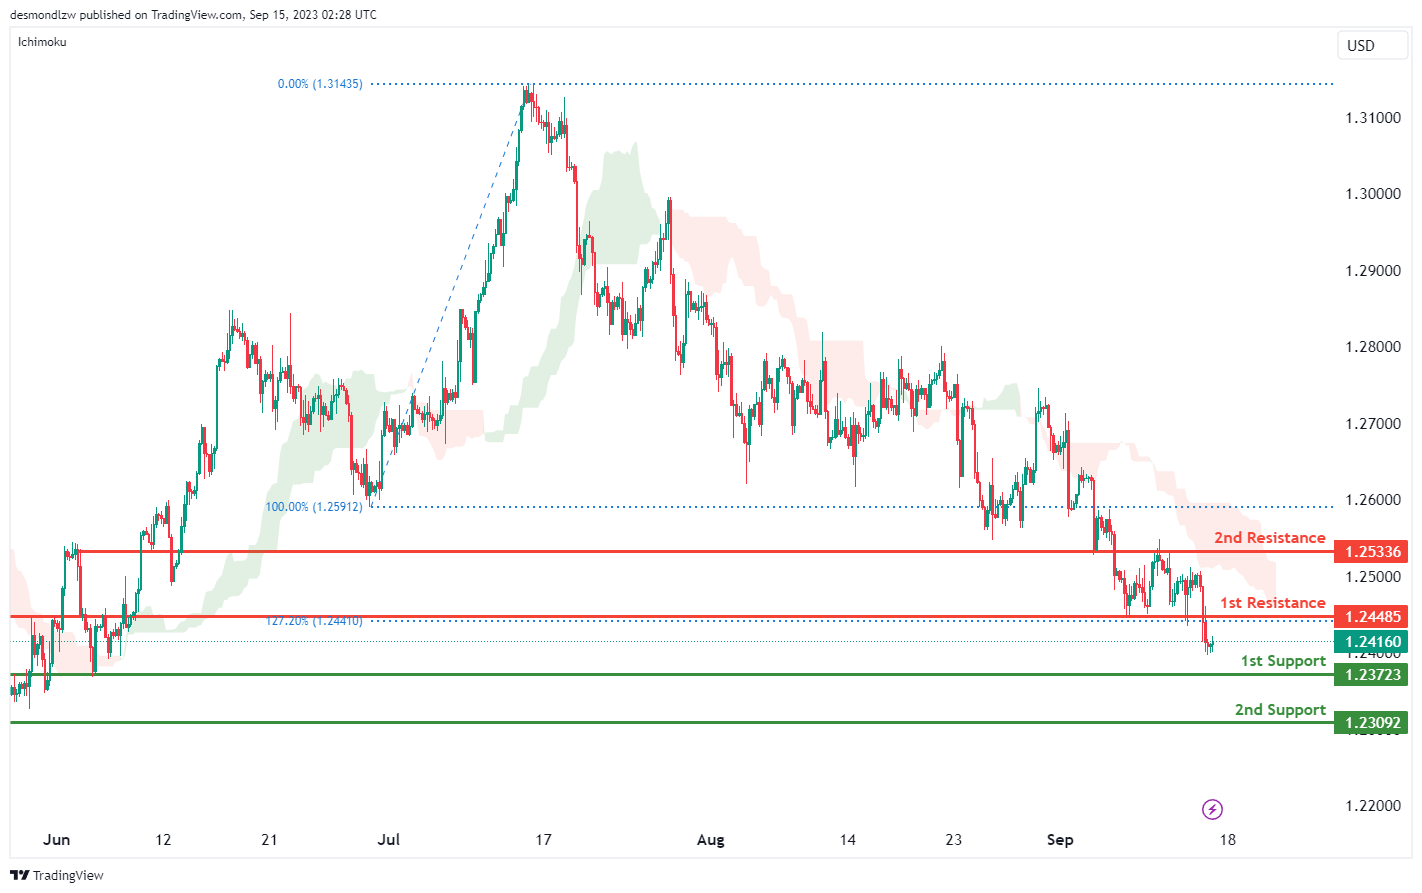
GBP/USD:
The GBP/USD chart currently exhibits a bearish overall momentum, and this bearish sentiment is attributed to the price trading below the bearish Ichimoku cloud. In this context, there’s a potential scenario where the price could continue its bearish movement towards the 1st support level at 1.2372.
The 1st support at 1.2372 is considered a significant support level, marked as an overlap support, which signifies its importance as a potential support zone. If the bearish momentum continues, this level may act as a point of interest for traders.
The 2nd support at 1.2309 is identified as a swing low support, further indicating its potential significance as a support zone.
On the resistance side, the 1st resistance level at 1.2448 is marked as a pullback resistance, potentially acting as a barrier to any potential upward movements. The 2nd resistance at 1.2533 is characterized as an overlap resistance, signifying its potential significance as a point of reversal or resistance due to its importance.
GBP/JPY:
The GBP/JPY chart is currently exhibiting an overall bullish momentum, suggesting that the price may experience upward movements.
The 1st support level at 182.66 is identified as a pullback support while the 2nd support level at 181.69 is marked as an overlap support that coincides with the 161.80% Fibonacci extension level, providing additional confluence for its significance.
To the upside, the 1st resistance level at 184.28 is marked as an overlap resistance while the 2nd resistance level at 185.69 is identified as a swing-high resistance, potentially limiting further upward movements.

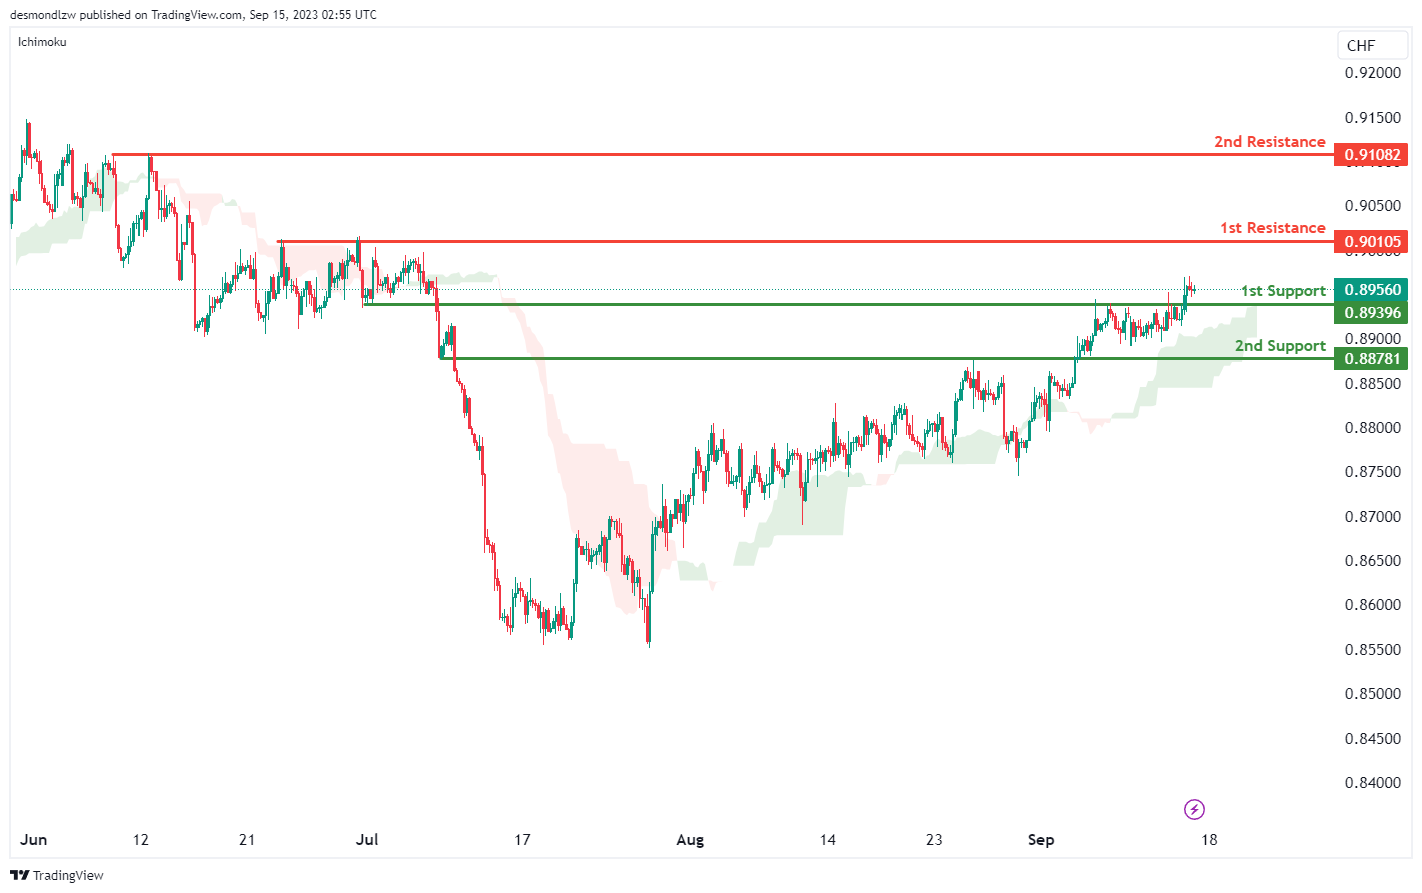
USD/CHF:
The USD/CHF chart currently shows a bullish overall momentum, and this bullish sentiment is attributed to the price trading within the bullish Ichimoku cloud. In this context, there’s a potential scenario where the price could continue its bullish movement towards the 1st resistance level at 0.9010.
The 1st support at 0.8955 is considered a strong support level, marked as an overlap support, signifying its significance as a potential support zone. If the bullish momentum persists, this level may serve as a point of interest for traders.
The 2nd support at 0.8878 is also identified as an overlap support, further indicating its potential importance as a support zone.
On the resistance side, the 1st resistance level at 0.9010 is characterized as a multi-swing high resistance, potentially acting as a barrier to any potential downward movements. The 2nd resistance at 0.9108 is marked as a swing high resistance, signifying its potential significance as a point of reversal or resistance due to its importance.
.
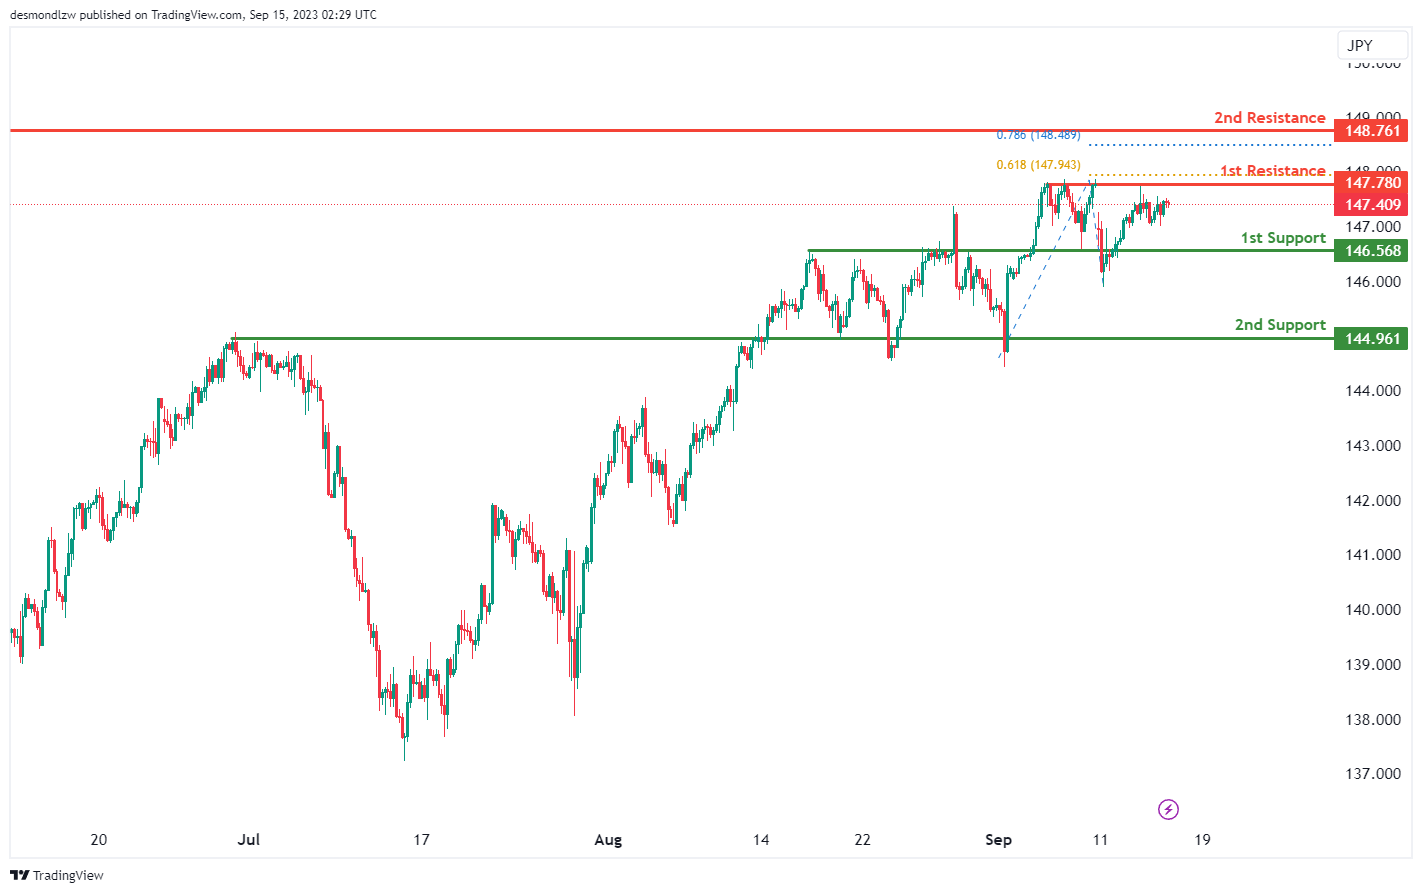
USD/JPY:
The USD/JPY chart currently exhibits a neutral overall momentum, suggesting a lack of a clear directional bias. In this scenario, there’s a potential for price to oscillate between the 1st support and 1st resistance levels.
The 1st support level at 146.56 is identified as a key support, marked as an overlap support, which indicates its potential importance as a level where buying interest might emerge.
The 2nd support at 144.96 is also considered an overlap support, further emphasizing its significance as a potential support zone.
On the resistance side, the 1st resistance level at 147.78 is characterized as a multi-swing high resistance, potentially acting as a barrier to any potential upward movements.
The 2nd resistance at 148.76 is marked as a swing high resistance, signifying its potential significance as a point of reversal or resistance due to its importance. Given the overall neutral momentum
USD/CAD:
The USD/CAD chart currently exhibits an overall bearish momentum, indicating a potential downward trend in price movement.
The 1st support level at 1.3485 is identified as an overlap support while the 2nd support level at 1.3434 is marked as a pullback support that aligns with the 127.20% Fibonacci extension level, reinforcing its potential as a support zone.
To the upside, the 1st resistance level at 1.3573 is marked as an overlap resistance while the 2nd resistance level at 1.3636 is also identified as an overlap resistance, suggesting potential resistance in this area.

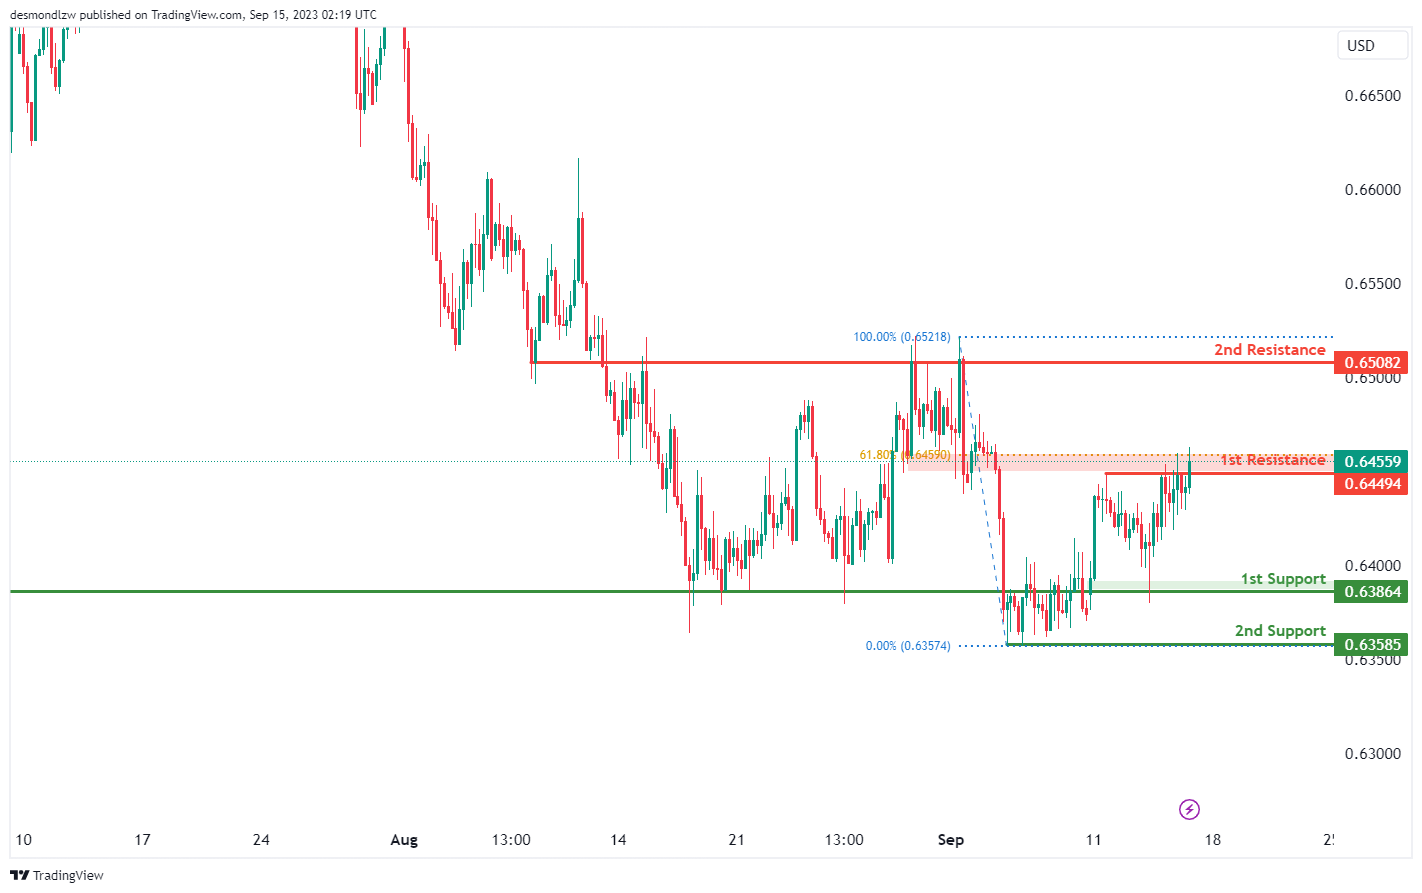
AUD/USD:
The AUD/USD chart currently exhibits an overall bullish momentum, indicating a potential breakout above the 1st resistance level and a continuation towards the 2nd resistance level.
The 1st resistance level at 0.6449 is marked as a pullback resistance that coincides with the 61.80% Fibonacci retracement level. Furthermore, the 2nd resistance level at 0.6508 is identified as an overlap resistance.
To the downside, the 1st support level at 0.6386 is identified as an overlap support while the 2nd support level at 0.6359 is noted as a pullback support, further reinforcing its potential role as a support level.
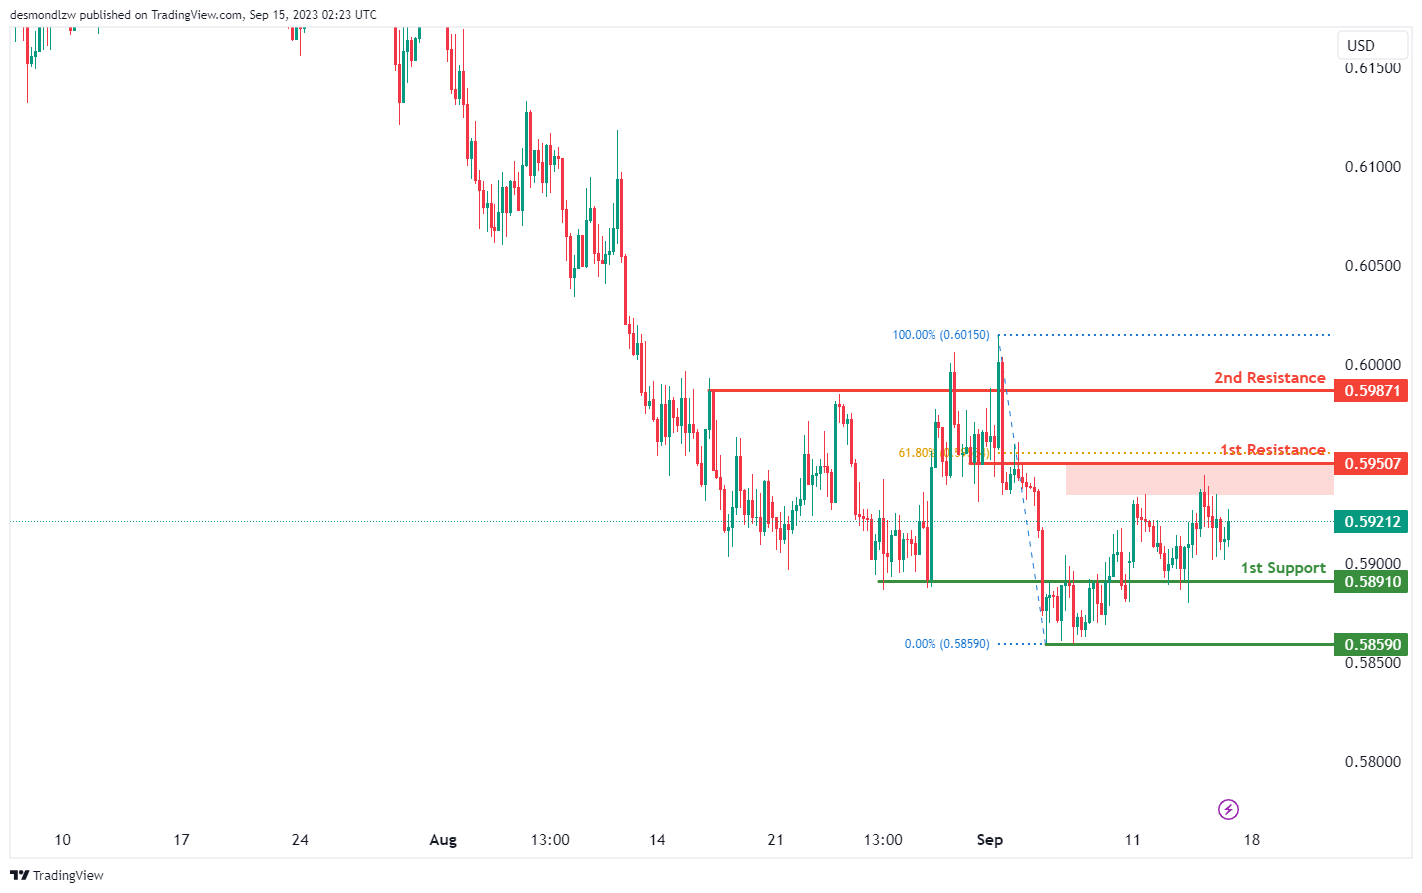
NZD/USD
The NZD/USD chart currently indicates an overall bullish momentum, indicating a potential upward trend in price movement.
The 1st support level at 0.5891 is identified as an overlap support while the 2nd support level at 0.5862 is marked as a pullback support, further reinforcing its potential role as a support level.
To the upside, the 1st resistance level at 0.5951 is identified as an overlap resistance that aligns with the 61.80% Fibonacci retracement level. Furthermore, the 2nd resistance level at 0.5987 is marked as a pullback resistance, indicating potential resistance in this area.
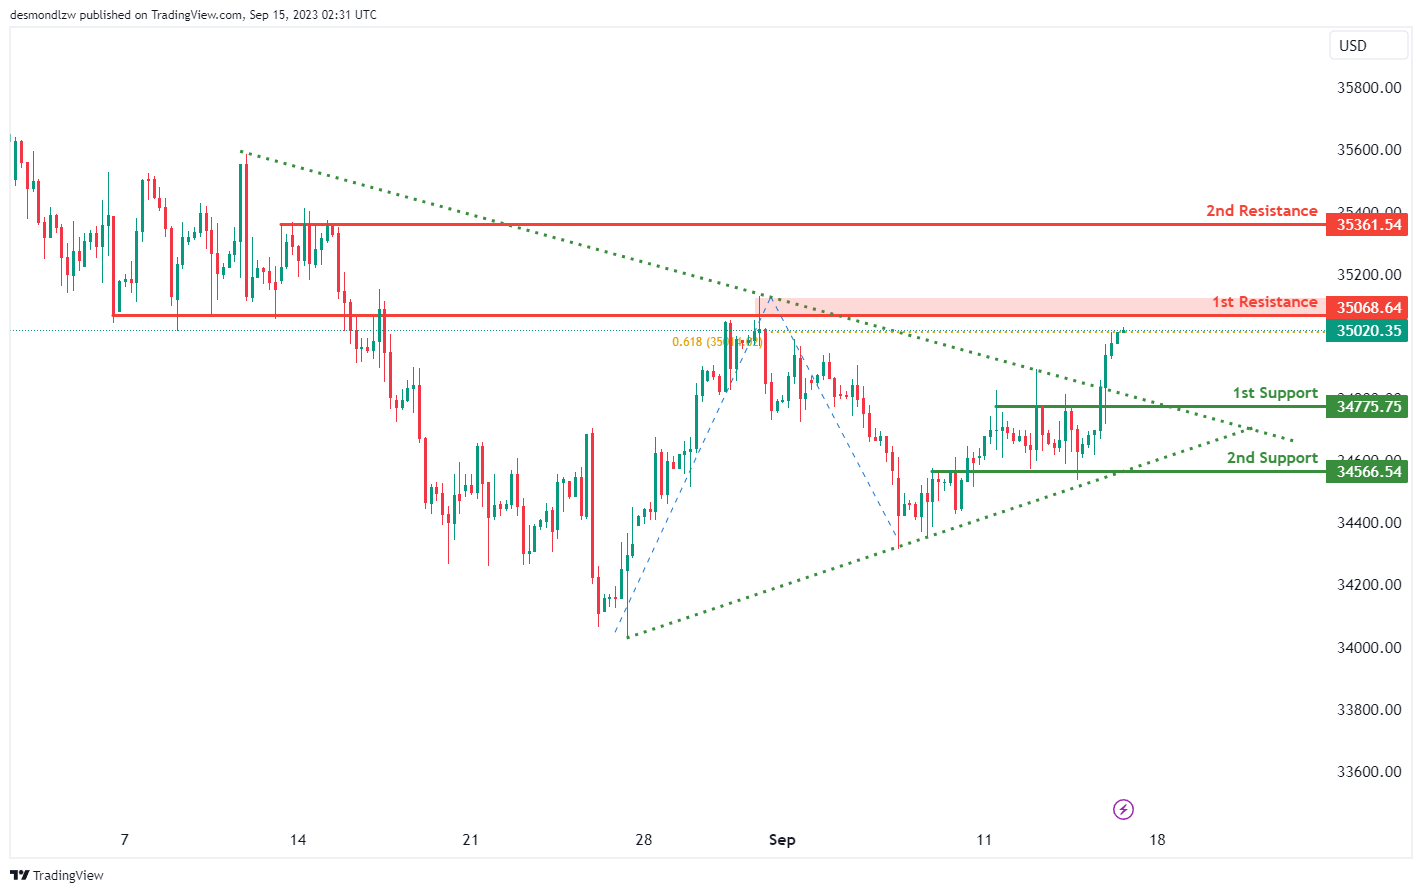
DJ30:
The DJ30 (Dow Jones Industrial Average) chart currently exhibits an overall bullish momentum which can be attributed to price breaking above the symmetrical triangle pattern. This breakout suggests the potential for a sustained bullish move in the market.
The 1st support level at 34,775.75 is identified as a pullback support while the 2nd support at 34,566.54 is marked as an overlap support.
To the upside, the 1st resistance level at 35,068.64 is marked as an overlap resistance that aligns with the 61.8% Fibonacci projection level. Furthermore, the 2nd resistance level at 35,361.54 is identified as a pullback resistance, potentially limiting further upward movements.
GER30:
The GER30 (Germany 30) chart currently indicates a bullish overall momentum, suggesting favorable conditions for potential upward movement in prices.
In this context, there’s a possibility that the price may continue its bullish trajectory towards the 1st resistance level at 16020.58.
The 1st support level at 15848.61 is described as a pullback support, signifying its importance as a level where buyers might enter to support the price during any pullback phases.
Additionally, the 2nd support level at 15710.58 is also identified as a pullback support, further emphasizing its significance as a potential zone where buyers could step in to provide support.
On the resistance side, the 1st resistance level at 16020.58 is characterized as a swing high resistance, indicating its potential to act as a significant barrier to further upward movements. This level is further supported by the presence of the 161.80% Fibonacci Retracement, which adds to its importance.
Furthermore, the 2nd resistance level at 16245.00 is marked as a pullback resistance, suggesting that this level could potentially attract selling pressure and act as a point of reversal.

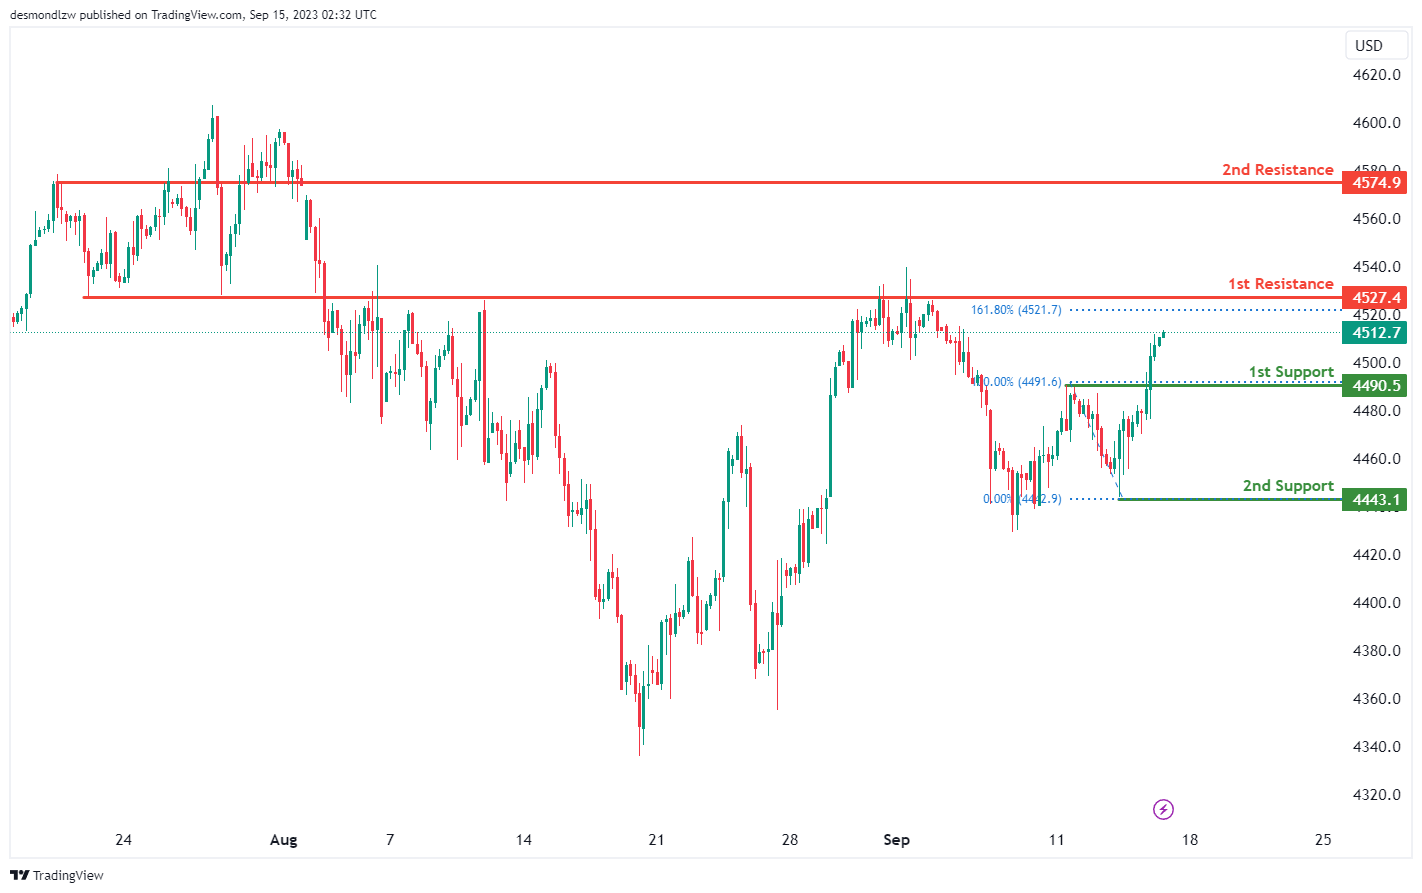
`US500
The US500 (US S&P 500) chart currently exhibits a bullish overall momentum, influenced by various factors. This bullish sentiment is supported by the price’s position above certain key levels and suggests favorable conditions for further upward movement.
In this context, there’s a potential scenario where the price could continue its bullish journey towards the 1st resistance level at 4527.4.
The 1st support level at 4490.5 is identified as a strong support zone, characterized as a pullback support. This suggests that it may serve as a critical level where buyers could potentially step in to support the price during any pullbacks.
Additionally, the 2nd support level at 4443.1 is marked as a swing low support, further emphasizing its significance as a potential support zone during price declines.
On the resistance side, the 1st resistance level at 4527.4 is described as an overlap resistance, indicating its potential to act as a significant barrier to further upward movements.
Furthermore, the 2nd resistance level at 4574.9 is identified as a pullback resistance, signifying its potential role as a level where selling pressure could intensify.
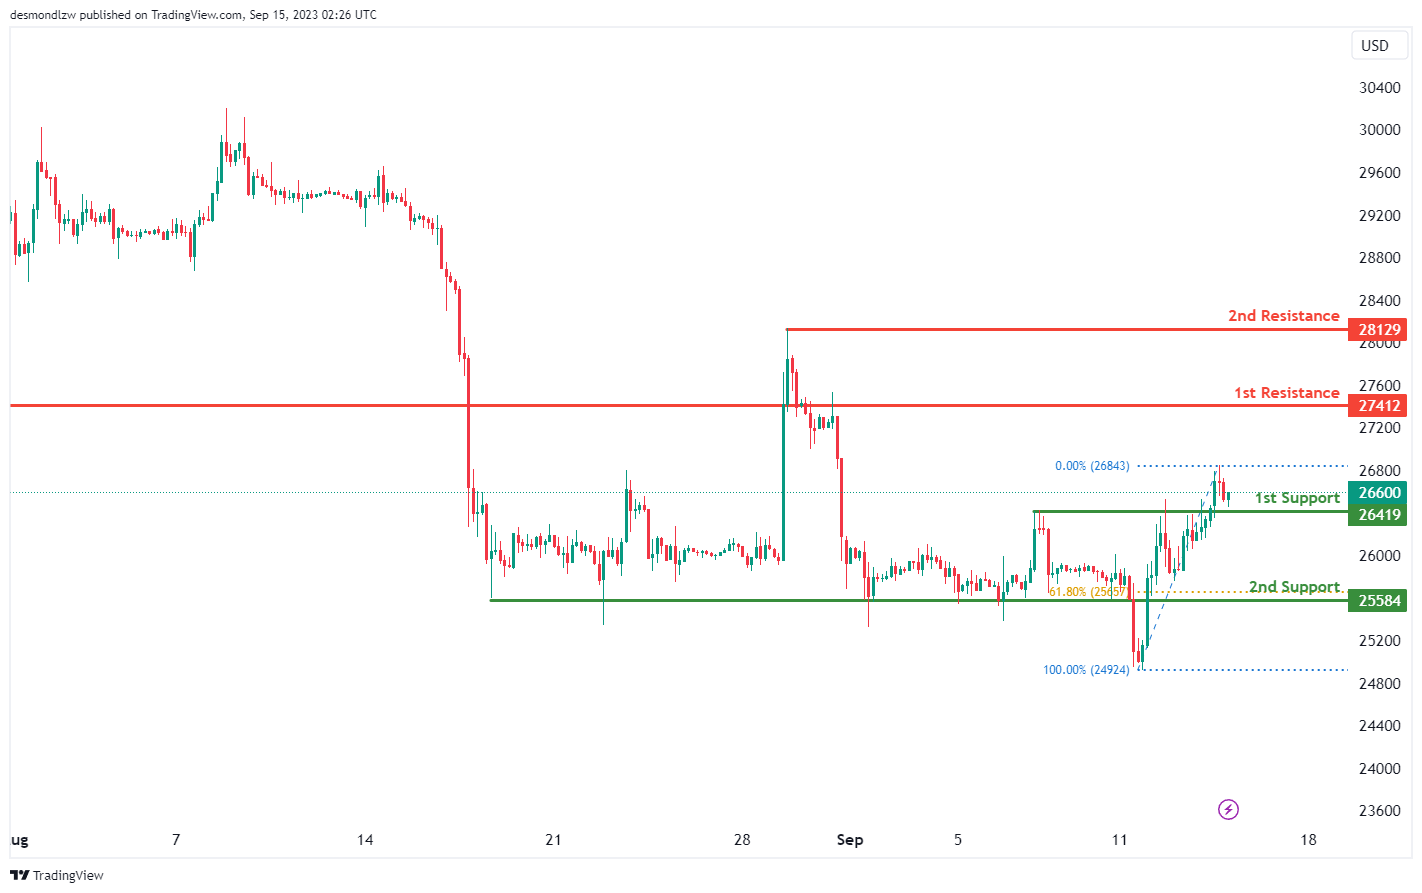
BTC/USD:
The BTC/USD (Bitcoin/US Dollar) chart currently exhibits a bullish overall momentum, driven by several factors. One of the key contributing factors is the price’s position within the bullish Ichimoku cloud, indicating favorable conditions for further upward movement.
Given this bullish momentum, there’s a potential scenario where the price could continue its upward trajectory towards the 1st resistance level at 27412.
The 1st support level at 26419 is considered a robust support zone, marked as an overlap support. This suggests its significance as a potential area where buyers might step in, potentially acting as a floor for any price declines.
Furthermore, the 2nd support level at 25584 is identified as a pullback support, reinforced by the presence of the 61.80% Fibonacci Retracement. This adds to its importance as a potential support zone and may attract buying interest.
On the resistance side, the 1st resistance level at 27412 is characterized as an overlap resistance, indicating its potential role as a level where selling pressure could intensify.
Additionally, the 2nd resistance at 28129 is marked as a swing high resistance, signifying its potential significance as a point where the price could encounter increased selling pressure or reversal.
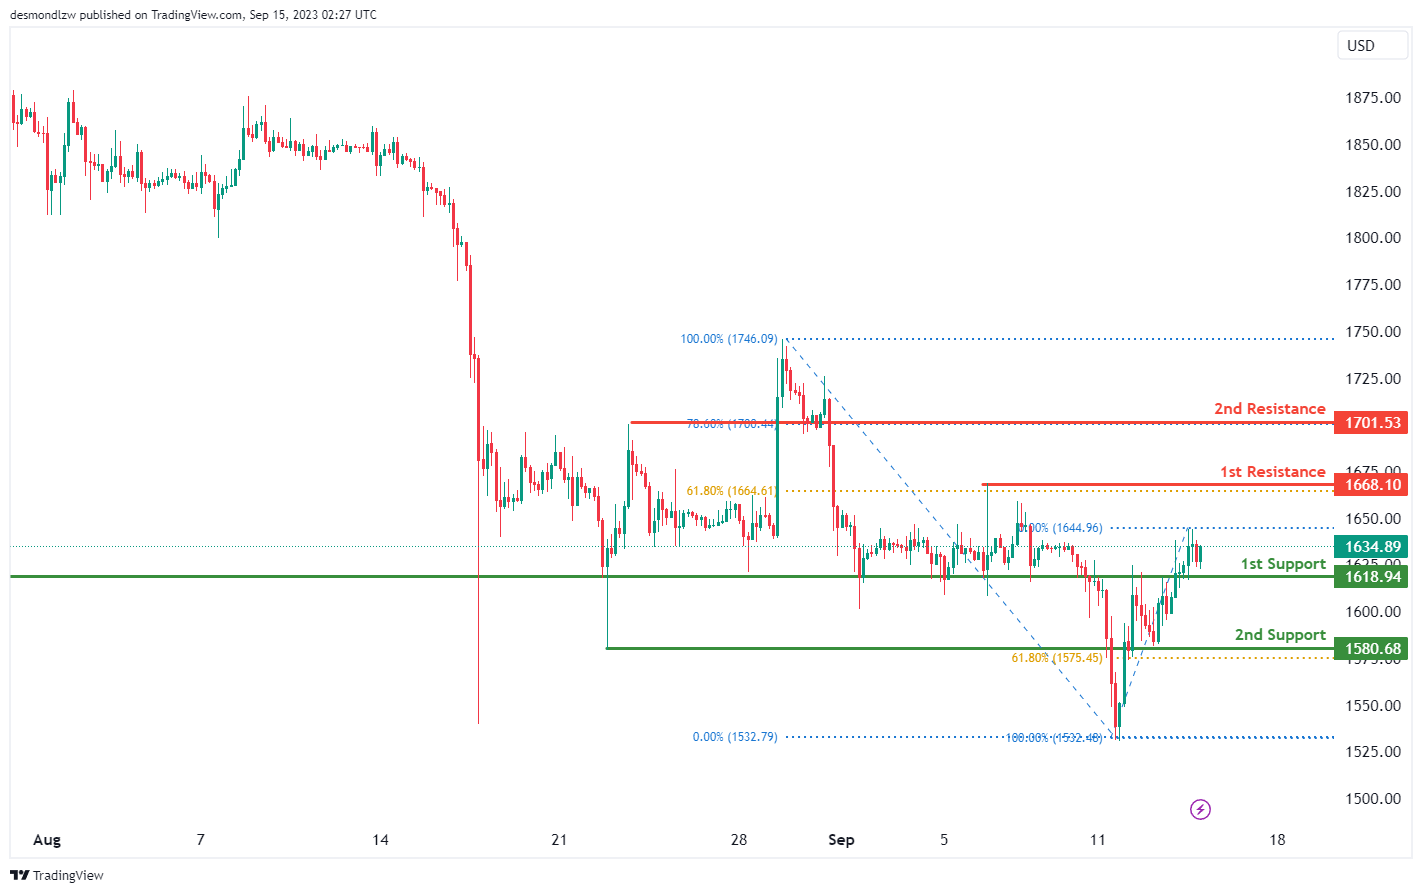
ETH/USD:
The ETH/USD (Ethereum/US Dollar) chart currently demonstrates a bullish overall momentum, influenced by several factors. This bullish sentiment is driven by the price’s position within the bullish Ichimoku cloud and suggests favorable conditions for further upward movement.
In this context, there’s a potential scenario where the price could continue its bullish trajectory towards the 1st resistance level at 1668.10.
The 1st support level at 1618.94 is considered a robust support zone, marked as an overlap support. This highlights its significance as a potential area where buyers may step in, potentially acting as a foundation for any price pullbacks.
Additionally, the 2nd support level at 1580.68 is identified as an overlap support, further strengthening its importance as a potential support zone. The presence of the 61.80% Fibonacci Retracement adds to its significance.
On the resistance side, the 1st resistance level at 1668.10 is characterized as a swing high resistance, indicating its potential role as a level where selling pressure could intensify.
Furthermore, the 2nd resistance level at 1701.53 is marked as a pullback resistance, supported by the presence of the 78.60% Fibonacci Retracement. This highlights its potential importance as a point of reversal or resistance.
WTI/USD:
The WTI chart currently indicates an overall bullish momentum, suggesting the potential for an upward price trend towards the 1st resistance level.
The 1st resistance level at 91.03 is noted as a resistance level that aligns with the 78.6% Fibonacci projection level while the 2nd resistance level at 92.19 is identified as a multiple-swing-high resistance, indicating potential significant resistance in this area.
To the downside, an intermediate support level at 88.77 is identified as a pullback support while the 1st support level at 87.47 is identified as an overlap support level. Furthermore, the 2nd support level at 85.53 is also identified as an overlap support level, reinforcing its potential role as a support zone.

XAU/USD (GOLD):
The XAU/USD (Gold/US Dollar) chart currently exhibits a bearish overall momentum, influenced by several factors. One of the key factors contributing to this bearish sentiment is the presence of a major descending trendline, suggesting that bearish momentum is prevailing.
In this context, the price is expected to potentially make a bearish move off the 1st resistance level and drop towards the 1st support level.
The 1st support level at 1901.14 is marked as an overlap support, indicating its significance as a potential area where buyers might step in. This level is further supported by the confluence of both the 78.60% Fibonacci Retracement and the 78.60% Fibonacci Projection, emphasizing its importance.
The 2nd support at 1888.10 is characterized as a multi-swing low support, suggesting its potential strength as a support zone.
On the resistance side, the 1st resistance level at 1913.49 is identified as an overlap resistance, signifying its potential significance as a level where selling interest might emerge. This resistance level is further reinforced by the presence of the 38.20% Fibonacci Retracement.
The 2nd resistance at 1931.97 is also marked as an overlap resistance, highlighting its importance as a potential barrier to any further upward movement.

The accuracy, completeness and timeliness of the information contained on this site cannot be guaranteed. IC Markets does not warranty, guarantee or make any representations, or assume any liability regarding financial results based on the use of the information in the site.
News, views, opinions, recommendations and other information obtained from sources outside of www.icmarkets.com, used in this site are believed to be reliable, but we cannot guarantee their accuracy or completeness. All such information is subject to change at any time without notice. IC Markets assumes no responsibility for the content of any linked site.
The fact that such links may exist does not indicate approval or endorsement of any material contained on any linked site. IC Markets is not liable for any harm caused by the transmission, through accessing the services or information on this site, of a computer virus, or other computer code or programming device that might be used to access, delete, damage, disable, disrupt or otherwise impede in any manner, the operation of the site or of any user’s software, hardware, data or property.


