
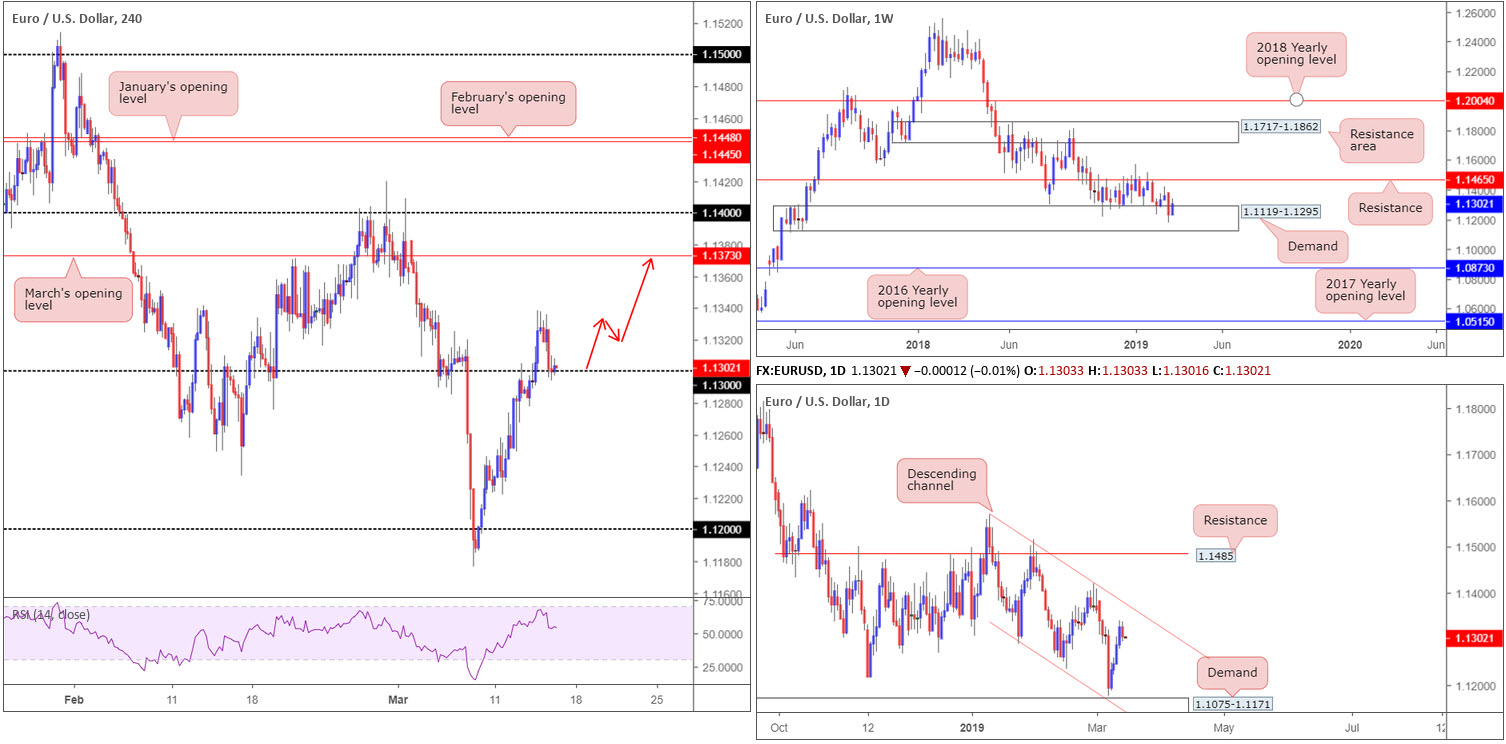
EUR/USD:
Following four days in the green, the single currency pulled back Thursday and reclaimed a hefty serving of Wednesday’s gains. This, as emphasised as a possibility in Thursday’s briefing, allowed the H4 candles to cross swords with 1.13 as support. Assuming this number continues to provide a floor, an advance beyond yesterday’s high at 1.1337 is likely on the cards towards March’s opening level at 1.1373.
On more of a broader outlook, weekly price continues to reflect a bullish stance out of demand coming in at 1.1119-1.1295, eclipsing a large portion of the prior week’s losses. Further buying from this point has resistance at 1.1465 to target. A closer reading on the daily timeframe shows the unit, despite yesterday’s selling, closing in on channel resistance (etched from the high 1.1569). This channel has been in motion since the beginning of this year.
Areas of consideration:
Having seen weekly buyers make a stand within the walls of demand and daily price display room to press as far north as its channel resistance, March’s opening level on the H4 timeframe at 1.1373 is certainly a possibility today/early next week.
Preferably on the back of a H4 bullish candlestick signal (entry and stop parameters can be defined according to this structure), a long from 1.13 today is worthy of attention. Reducing risk to breakeven at yesterday’s high 1.1337 is an option, with the following expectation set on a rally in the direction of March’s opening level mentioned above at 1.1373.
Today’s data points: Prelim UoM Consumer Sentiment.
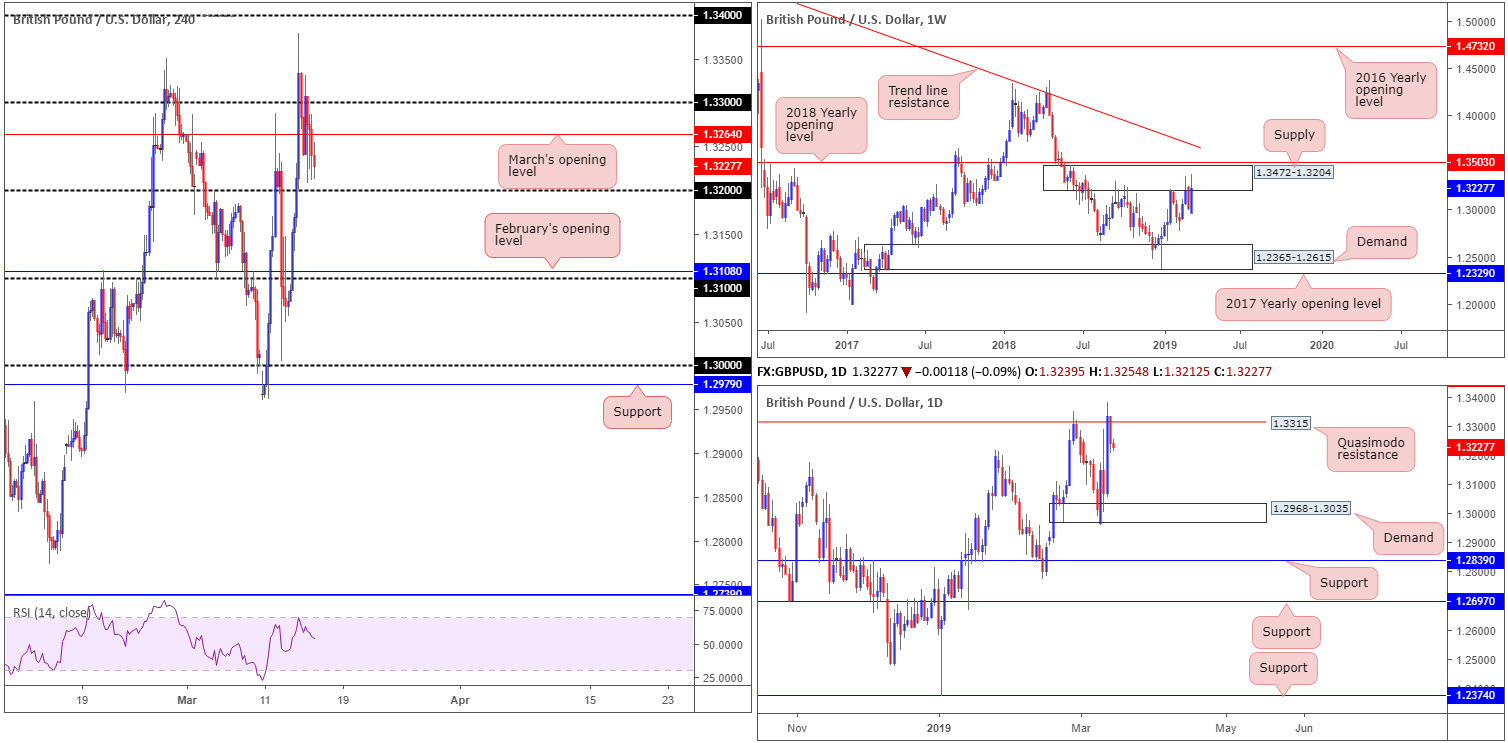
GBP/USD:
Sterling failed to sustain the no-deal driven rally Thursday, finishing in negative territory by 0.71%. A recovering greenback, along with UK Parliament rejecting all voted amendments (passing the main motion presented by the government to seek an extension to Article 50), collectively weighed on the British pound.
H4 movement reclaimed 1.33 to the downside and eventually pushed beneath March’s opening level at 1.3264. Focus has now shifted towards 1.32 as possible support on this timeframe. Below this number, the research team notes the pair is starved of support until reaching February’s opening level at 1.3108, shadowed closely by the 1.31 handle.
Although marginally exploring ground above daily Quasimodo resistance at 1.3315, price action ended south side of this level yesterday. This could have something to do with the fact this daily level resides within weekly supply fixed at 1.3472-1.3204. Note beyond this weekly zone we have the 2018 yearly opening level lurking nearby at 1.3503.
Areas of consideration:
The key observation in this market is the 1.32 handle on the H4 timeframe. Higher-timeframe flows suggest a break of this number is in store, which, as noted above, could lead to a run towards 1.31.
On account of this, should the market observe a H4 close take shape below 1.32 today and is followed up with a retest, entering short on the close of the rejecting candle (assuming it displays seller strength) is an option (stop-loss orders can be positioned above the rejecting candle’s wick).
Today’s data points: Prelim UoM Consumer Sentiment.
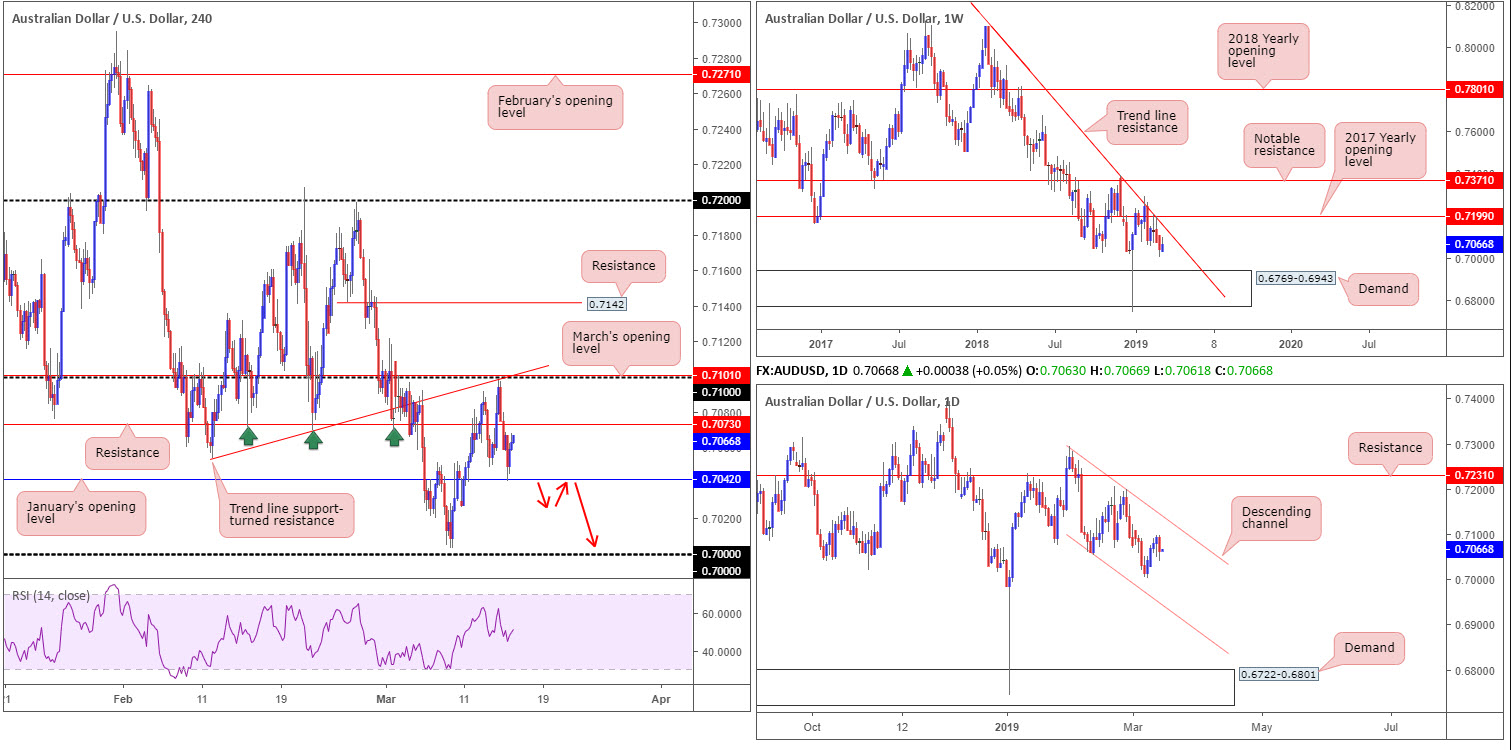
AUD/USD:
China’s industrial output grew 5.3% in the first two months of this year, the slowest pace of expansion in 17 years, official data showed Thursday. Despite this fixed-asset investment rose 6.1%, while retail sales rose 8.2%, both more than expected.
Due to Australia’s economic ties to China, the AUD/USD declined in response to Chinese data and overthrew H4 support at 0.7073 (now acting resistance), leaving the pathway free for the unit to challenge January’s opening level nearby at 0.7042, and challenge it did.
With buyers holding the fort above 0.7042, eyeing a possible retest of 0.7073, where are we positioned on the bigger picture?
Daily action remains compressing within a descending channel (0.7295/0.7060), which has been in motion since the beginning of February. Weekly flow, on the other hand, is still seen reflecting a bearish posture underneath its 2017 yearly opening level at 0.7199 and merging trend line resistance (extended from the high 0.8135). The next downside target on the weekly timeframe can be seen at demand drawn from 0.6769-0.6943.
Areas of consideration:
A push below 0.7042 on the H4 timeframe today/early next week has the key figure 0.70 in sight. Therefore, potential shorts on a retest of 0.7042 as resistance is something to keep an eye out for should we push for lower ground (red arrows).
The underside of resistance at 0.7073 on the H4 timeframe is also a possible sell zone today, given its history as a support (green arrows). In addition to this, 0.71 is also a possibility for sellers, seeing as it merges with March’s opening level at 0.7101 and a trend line support-turned resistance (extended from the low 0.7054).
For conservative traders unsure of the levels underlined above, waiting for additional candlestick confirmation is an option. Not only will this identify seller intent, it’ll also provide entry/risk levels to work with.
Today’s data points: Prelim UoM Consumer Sentiment.
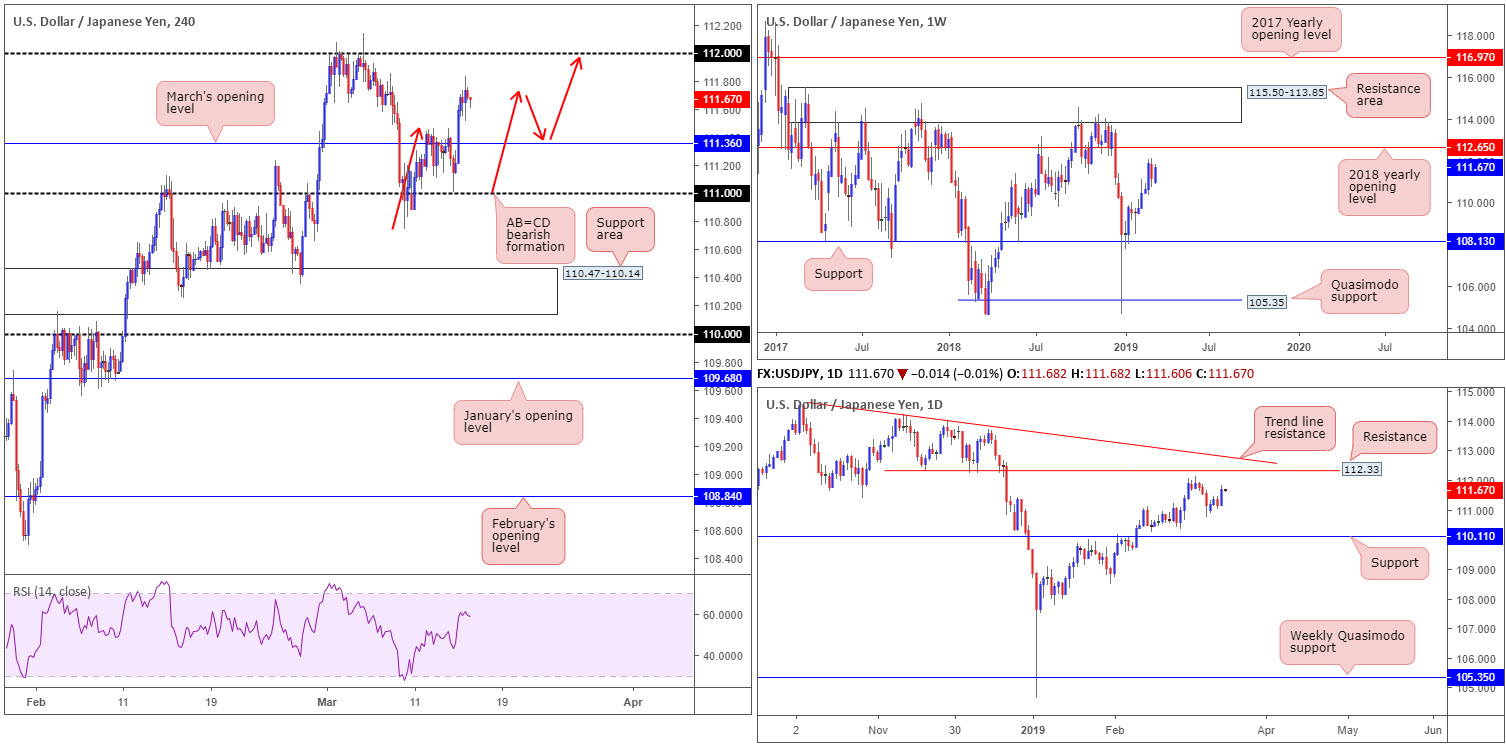
USD/JPY:
Settling above 96.70, the US dollar index staged a reasonably strong recovery Thursday, breaking a four-day bearish phase. This lifted the USD/JPY northbound; consequently conquering March’s opening level on the H4 timeframe at 111.36 and reaching highs of 111.83. Traders may also want to acknowledge H4 structure topped just beyond an AB=CD bearish formation (red arrows), which could, technically speaking, force a pullback today and retest 111.36 as support (red arrows). The next upside target on this timeframe can be seen around the 112 handle.
Despite fading fresh 2019 highs of 112.13 last week, price action remains supported on the weekly timeframe for now. In terms of structure, pivotal resistance at 112.65 (the 2018 yearly opening level) is seen, demonstrating this market still has room to advance.
Since bottoming at 104.65 at the beginning of the year, the daily candles printed a series of higher highs and higher lows. Recent selling found support and is likely set to continue higher, drawing in resistance plotted at 112.33, followed by trend line resistance extended from the high 114.23.
Areas of consideration:
According to the higher timeframes, the pendulum appears to be swinging towards more of an advance, with daily resistance at 112.33 in place as the first upside objective.
Should H4 action pullback and retest 111.36 as support and hold (preferably in the shape of a bullish signal – entry and risk levels can be determined on the back of this structure), a rally towards 112 could be on the cards.
Today’s data points: Prelim UoM Consumer Sentiment; BoJ Monetary Policy Statement and Press Conference; BoJ Gov. Kuroda Speaks.
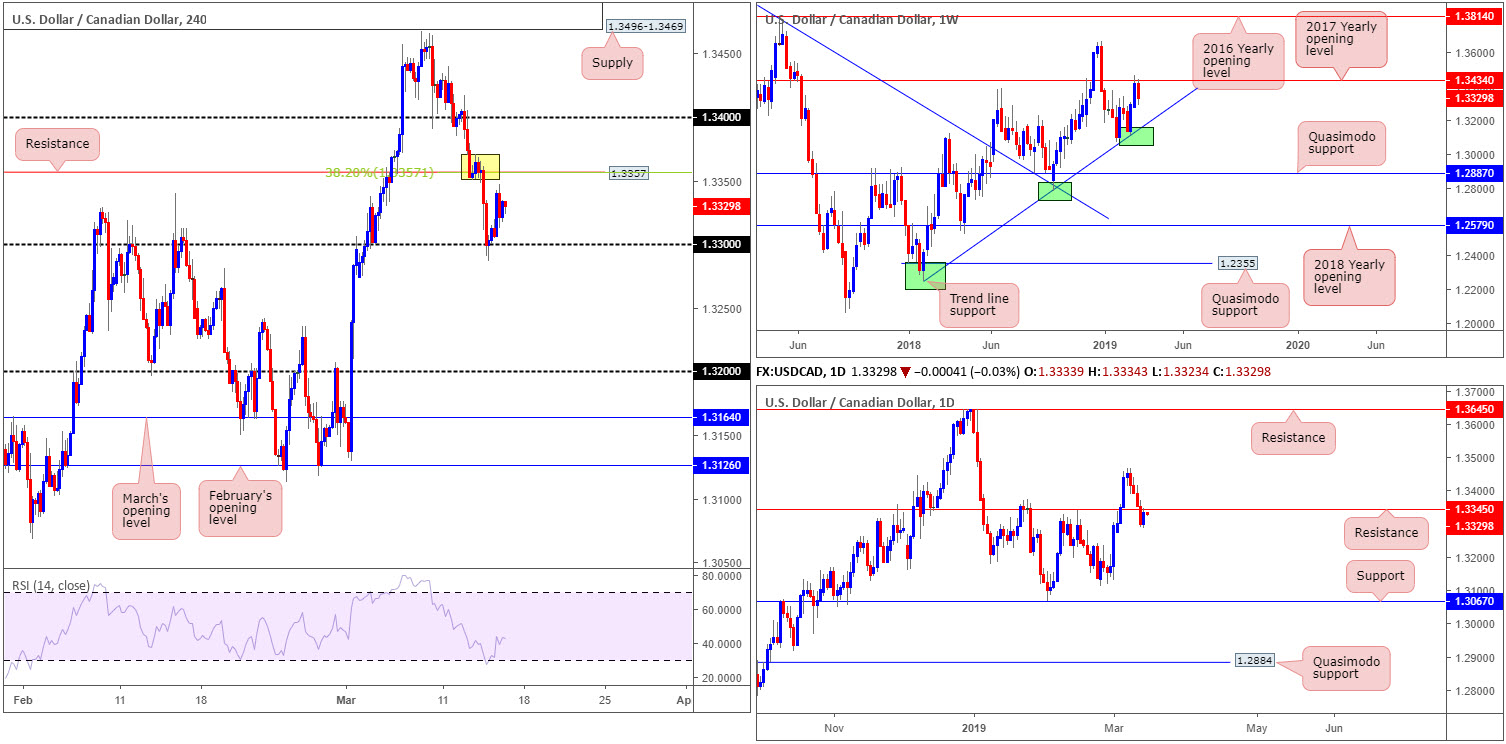
USD/CAD:
In recent sessions, the USD/CAD witnessed a measured response off the 1.33 handle on the H4 timeframe. Bolstered by broad-based USD buying, the pair concluded Thursday closing within striking distance of resistance priced in at 1.3357, which happens to merge with a 38.2% Fibonacci resistance value and a supply zone (yellow) at 1.3371-1.3350.
What’s also interesting from a technical perspective is daily flow retesting the underside of resistance coming in at 1.3345. Couple this with weekly movement selling off from the 2017 yearly opening level at 1.3434, H4 resistance mentioned above at 1.3357 is a high-probability sell zone.
Areas of consideration:
Keeping it Simple Simon this morning, a sell from 1.3357 is an option this morning, with stop-loss orders positioned above the H4 surrounding supply (yellow at 1.3371-1.3350), targeting 1.33 as the initial take-profit zone. Ultimately, though, the idea is for the unit to breach 1.33 and eventually touch gloves with 1.32, offering incredibly mouth-watering risk/reward.
Today’s data points: Prelim UoM Consumer Sentiment; Canadian Manufacturing Sales m/m.
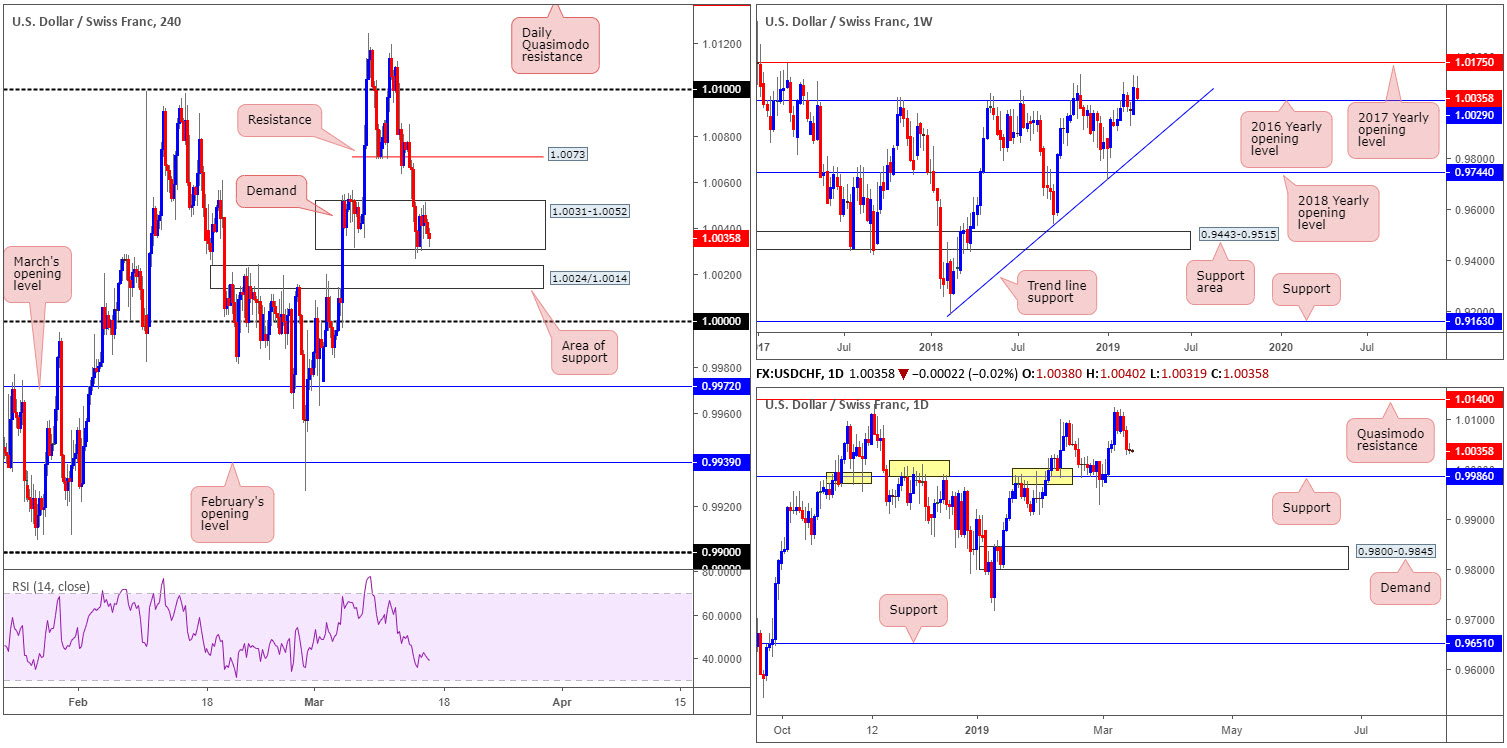
USD/CHF:
Despite a resurgence of USD bidding Thursday, USD/CHF prices finished the session unmoved, visually presented by a daily indecision candle. In view of yesterday’s lacklustre performance, much of the following piece echoes points put forward in Thursday’s briefing.
Kicking things off from the weekly timeframe this morning, we can see the unit retesting the top edge of its 2016 yearly opening level at 1.0029. In the event this barrier holds ground, the next area of interest falls in around the 2017 yearly opening level at 1.0175.
The daily timeframe, on the other hand, demonstrates scope to explore ground beyond the current weekly level towards support coming in at 0.9986. Boasting strong historical significance, this barrier is certainly worth a place on the watch list.
H4 demand at 1.0031-1.0052 remains in the fight despite suffering a mild breach to its lower boundary Wednesday. Stop-loss orders taken from beneath here, along with a nearby area of H4 support seen at 1.0024/1.0014 and weekly price testing its 2016 yearly opening level at 1.0029, could see a recovery take form today.
Areas of consideration:
A H4 bullish candlestick pattern printed from current price is, according to where we’re trading from on the weekly timeframe at the moment, a high-probability buy signal (entry/risk levels can be drawn from this structure). In terms of upside targets, the first port of call can be seen around H4 resistance etched from 1.0073.
Today’s data points: Prelim UoM Consumer Sentiment.
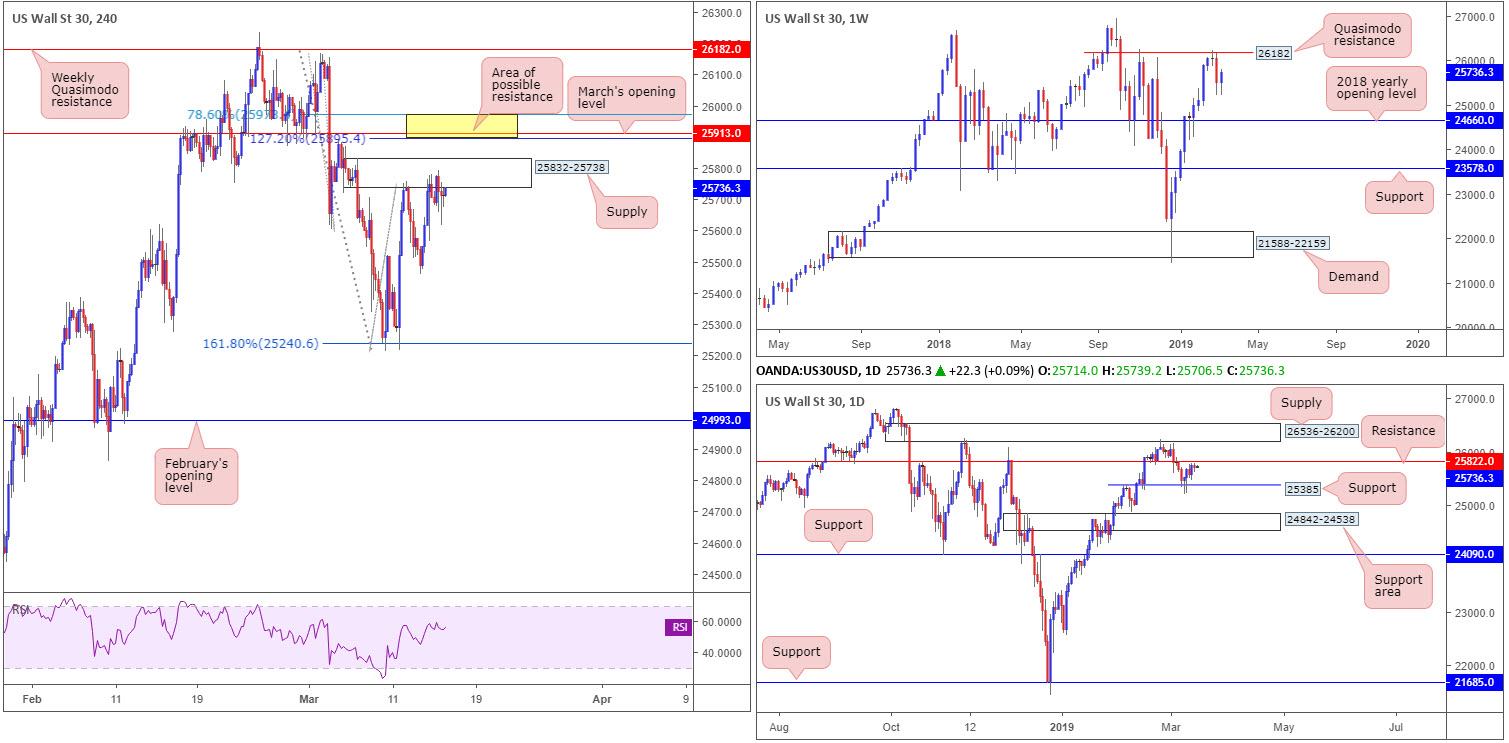
Dow Jones Industrial Average:
In spite of the US and China reportedly agreeing to delay the meeting between US President Trump and China President Xi (planned for the 27 March, though pushed back until at least the end of April) this did little to stir equity markets Thursday. On account of this, the research team’s outlook remains unchanged going into Friday’s segment…
H4 price flipped between gains/losses around the underside of supply at 25832-25738. In the event this area fails to hold, the next base of interest falls in around 25978/25895 (yellow – comprised of a 127.2% H4 Fibonacci ext. point at 25895, a 78.6% Fibonacci resistance value at 25978 and March’s opening level at 25913).
While weekly price shows room to potentially press as far north as Quasimodo resistance at 26182, lurking around the top limit of the current H4 supply is a daily resistance level drawn from 25822 (boasts reasonably attractive history).
Areas of consideration:
The current H4 supply zone at 25832-25738 is worthy of interest, though only once daily sellers are brought into the mix from resistance at 25822. A strong H4 bearish rotation candle printed from here indicates seller intent and could be worth shorting with an initial target objective set around 25460: Wednesday’s low.
Should we push for higher ground, though, keep eyes on the yellow H4 zone mentioned above at 25978/25895 for possible shorting opportunities.
Today’s data points: Prelim UoM Consumer Sentiment.
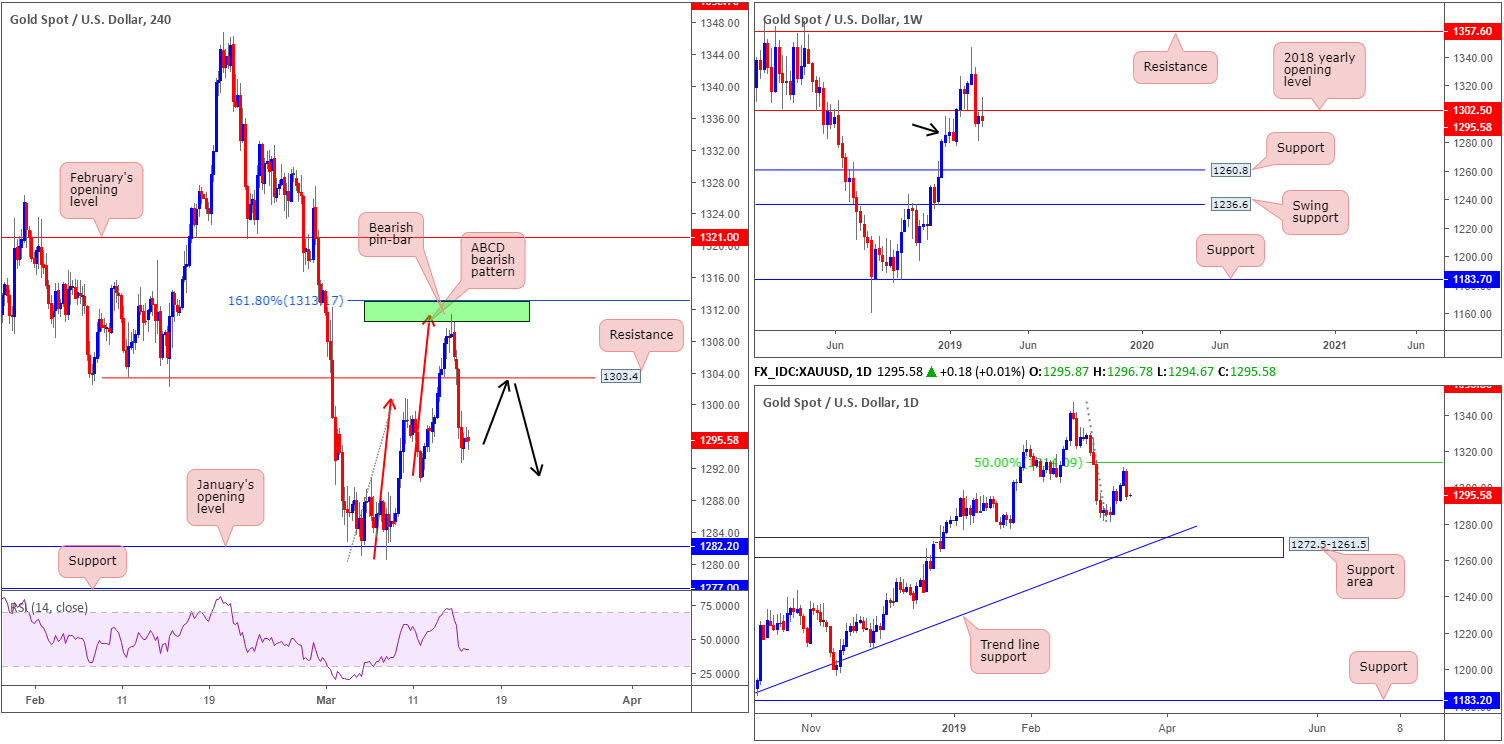
XAU/USD (GOLD):
For those who read Thursday’s briefing you may recall the research team highlighting a potential sell out of a completed H4 ABCD bearish pattern (green) between 1313.1/1310.3. On top of this, a H4 bearish pin-bar confirming candle as well as the RSI indicator testing overbought territory was visible. This by and of itself was clearly enough to attract sellers into the market Thursday.
Boosted by a USD rally, the move out of 1313.1/1310.3 far exceeded the initial expectation of reaching H4 support at 1303.4 (now acting resistance), erasing a large portion of the week’s gains and testing lows of 1292.9.
Thanks to recent selling, weekly price also snapped back beneath its 2018 yearly opening level at 1302.5, potentially forming a bearish pin-bar pattern. Despite this, traders are urged to consider the unit still trades from demand on this timeframe around 1276.5-1298.5 (black arrow).
Areas of consideration:
Traders who remain short this market from 1313.1/1310.3, expect potential buying to arise from Monday’s low at 1290.2. Beyond here, some local support resides around 1289.0ish, followed closely by January’s opening level at 1282.2.
For folks who missed the initial sell, a retest at 1303.4 before testing Monday’s low (black arrows) would, given its connection with weekly resistance at 1302.5, be an ideal location to be looking for selling opportunities. This could also be an area for those already short to pyramid their position. Similar to the sell from 1313.1/1310.3, though, waiting for a bearish candlestick signal is recommended (entry and risk levels can be positioned according to the pattern).
The accuracy, completeness and timeliness of the information contained on this site cannot be guaranteed. IC Markets does not warranty, guarantee or make any representations, or assume any liability with regard to financial results based on the use of the information in the site.
News, views, opinions, recommendations and other information obtained from sources outside of www.icmarkets.com.au, used in this site are believed to be reliable, but we cannot guarantee their accuracy or completeness. All such information is subject to change at any time without notice. IC Markets assumes no responsibility for the content of any linked site. The fact that such links may exist does not indicate approval or endorsement of any material contained on any linked site.
IC Markets is not liable for any harm caused by the transmission, through accessing the services or information on this site, of a computer virus, or other computer code or programming device that might be used to access, delete, damage, disable, disrupt or otherwise impede in any manner, the operation of the site or of any user’s software, hardware, data or property


