
DXY:
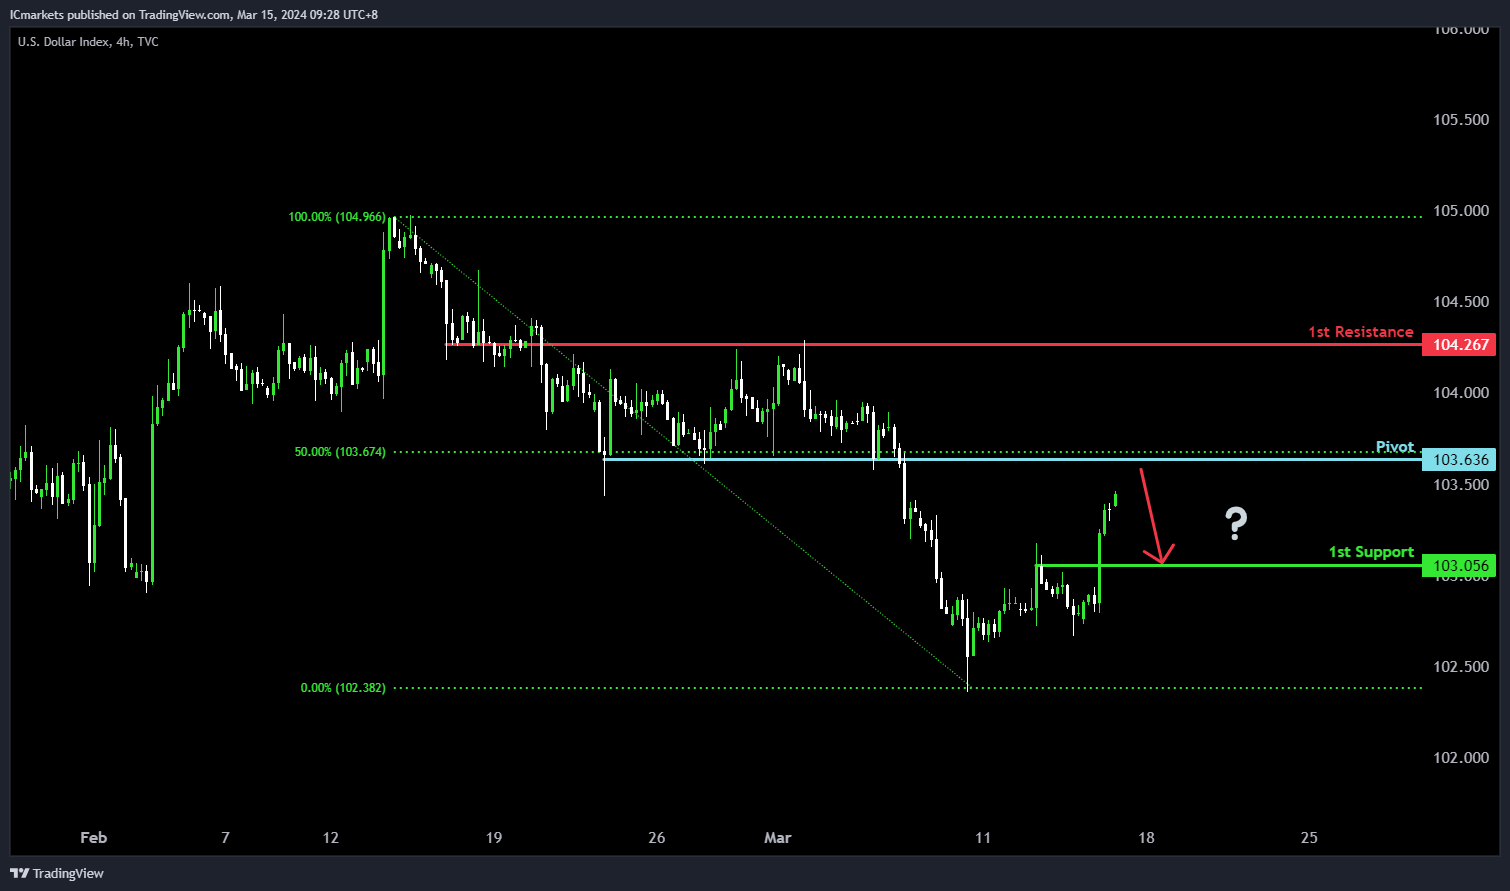
For DXY (Dollar Index), the potential direction is bearish, although the overall momentum of the chart remains bullish. There’s a likelihood of a bearish reaction off the pivot level, leading to a decline towards the 1st support.
The pivot at 103.63 serves as pullback resistance, reinforced by the presence of the 50% Fibonacci Retracement, indicating a potential barrier where selling pressure could intensify. Conversely, the 1st support at 103.05 is identified as pullback support, suggesting it could attract buying interest and potentially halt the downward movement.
On the resistance side, the 1st resistance at 104.26 is noted as a multi-swing high resistance, indicating its historical significance as a level where selling pressure has previously emerged, potentially limiting further upward movement.
EUR/USD:
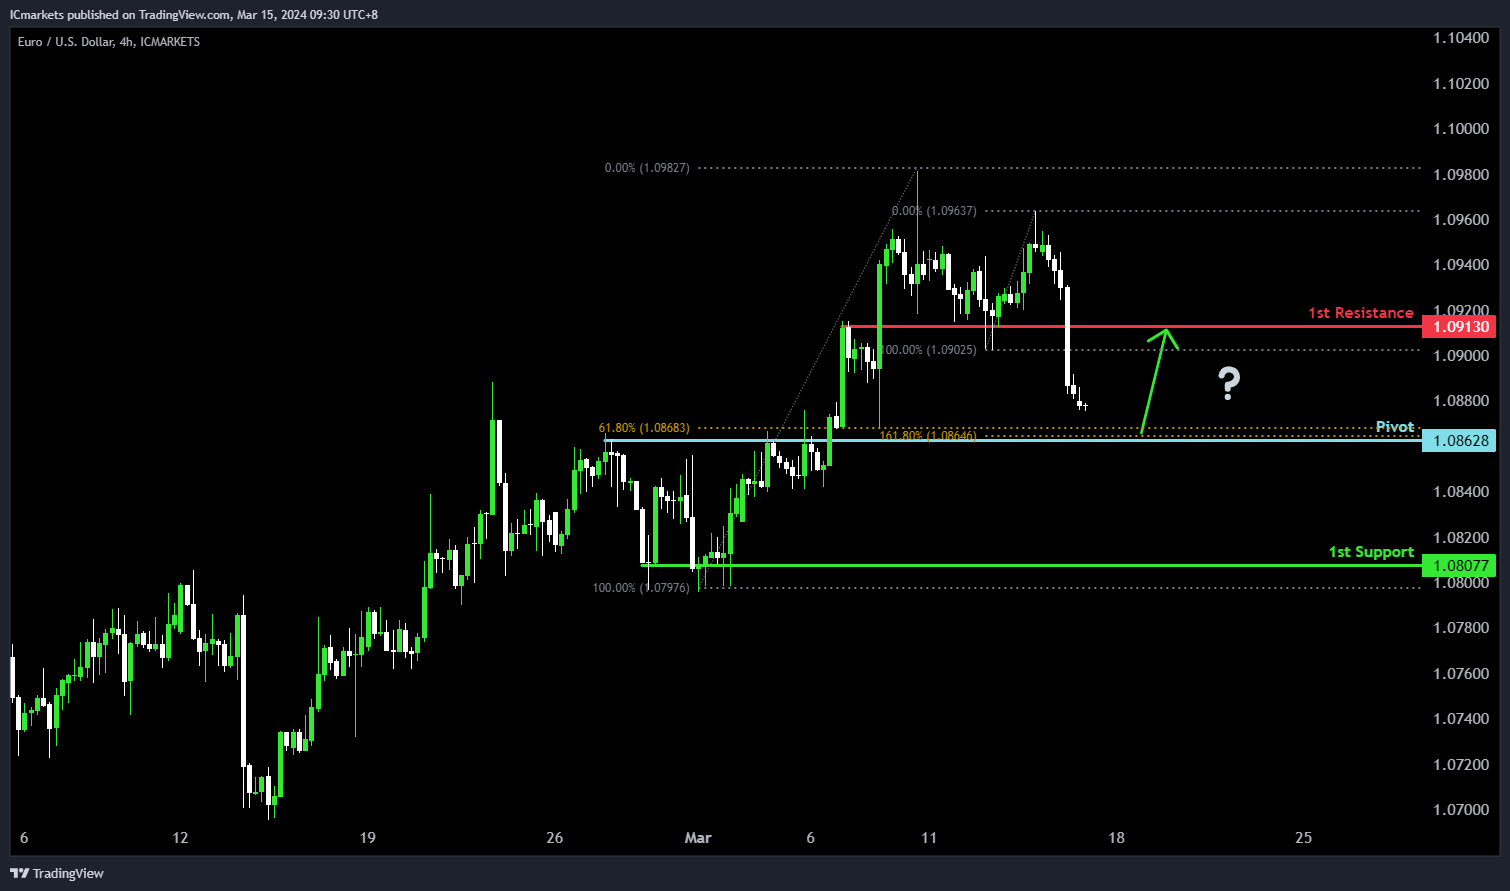
For EUR/USD, the potential direction is bullish, despite the overall momentum of the chart being bearish. There’s a possibility of a bullish bounce off the pivot level, indicating a move towards the 1st resistance.
The pivot at 1.0862 serves as an overlap support, supported by both the 61.80% Fibonacci Retracement and the 161.80% Fibonacci Extension, suggesting a significant level where buying interest may emerge. Additionally, the 1st support at 1.0807 is identified as multi-swing low support, further reinforcing its potential role as a level where buyers could intervene.
On the resistance side, the 1st resistance at 1.0913 is noted as pullback resistance, indicating its historical significance as a level where selling pressure may increase, potentially limiting further upward movement in the price.
EUR/JPY:
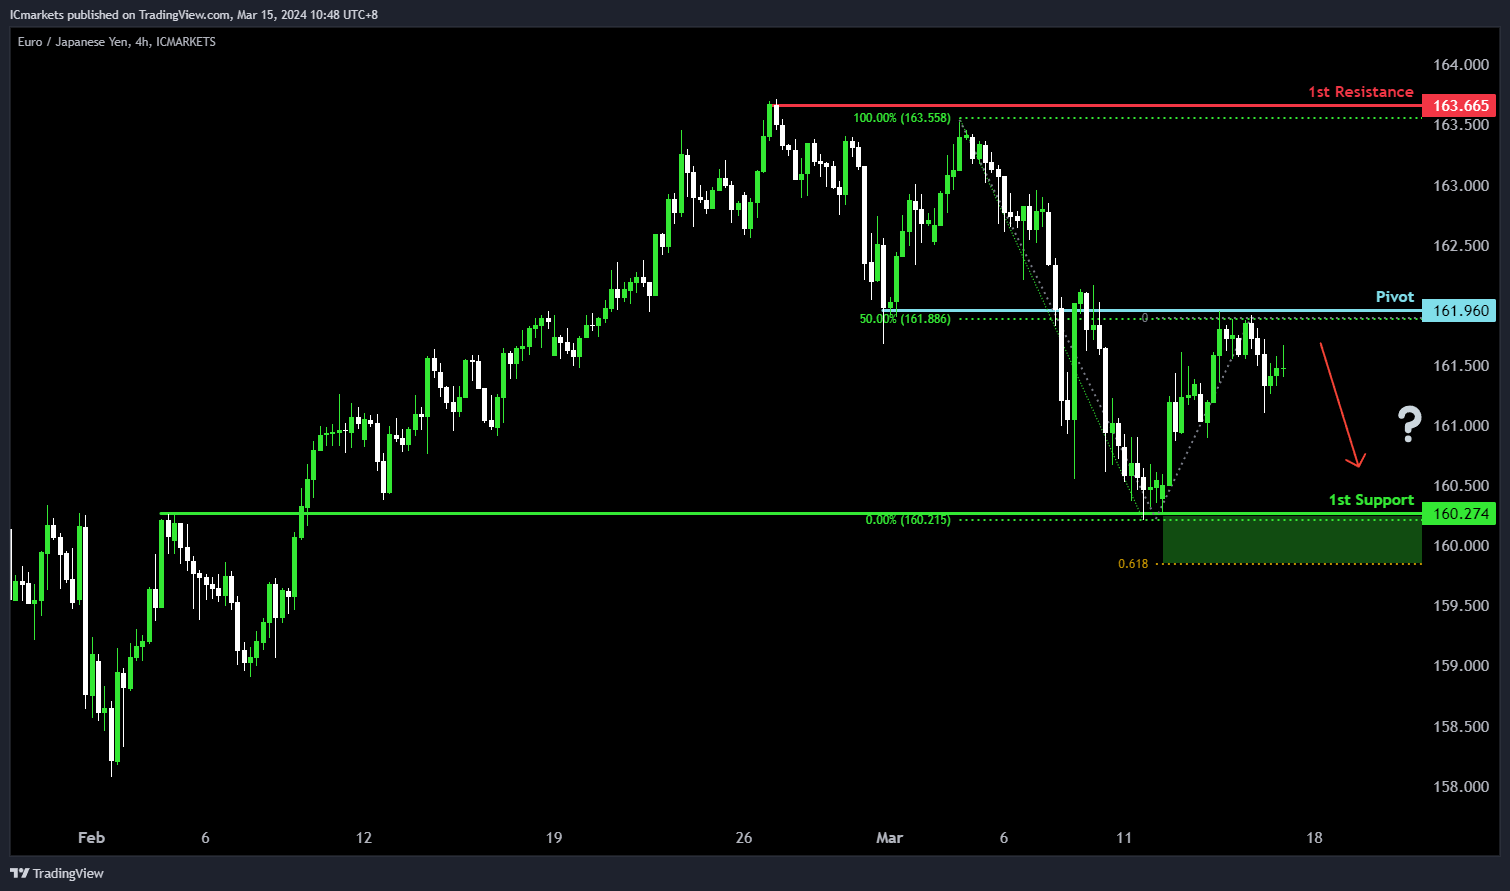
The EUR/JPY chart suggests a potential bearish direction, in line with the overall bearish momentum. There’s a possibility of a bearish reaction from the pivot level, indicating a potential drop towards the 1st support.
The pivot level at 161.960 is identified as a pullback resistance, indicating a significant historical level where selling pressure may have emerged previously. Additionally, this level coincides with the 50% Fibonacci Retracement, reinforcing its significance.
Furthermore, the 1st support at 160.274 is characterized as an overlap support, suggesting it has previously acted as a notable level where buyers entered the market. This level also aligns with the 61.80% Fibonacci Projection, adding further confluence to its importance as a potential support level.
On the resistance side, the 1st resistance level at 163.665 is noted as a swing high resistance, indicating a historical barrier to upward movement.
EUR/GBP:
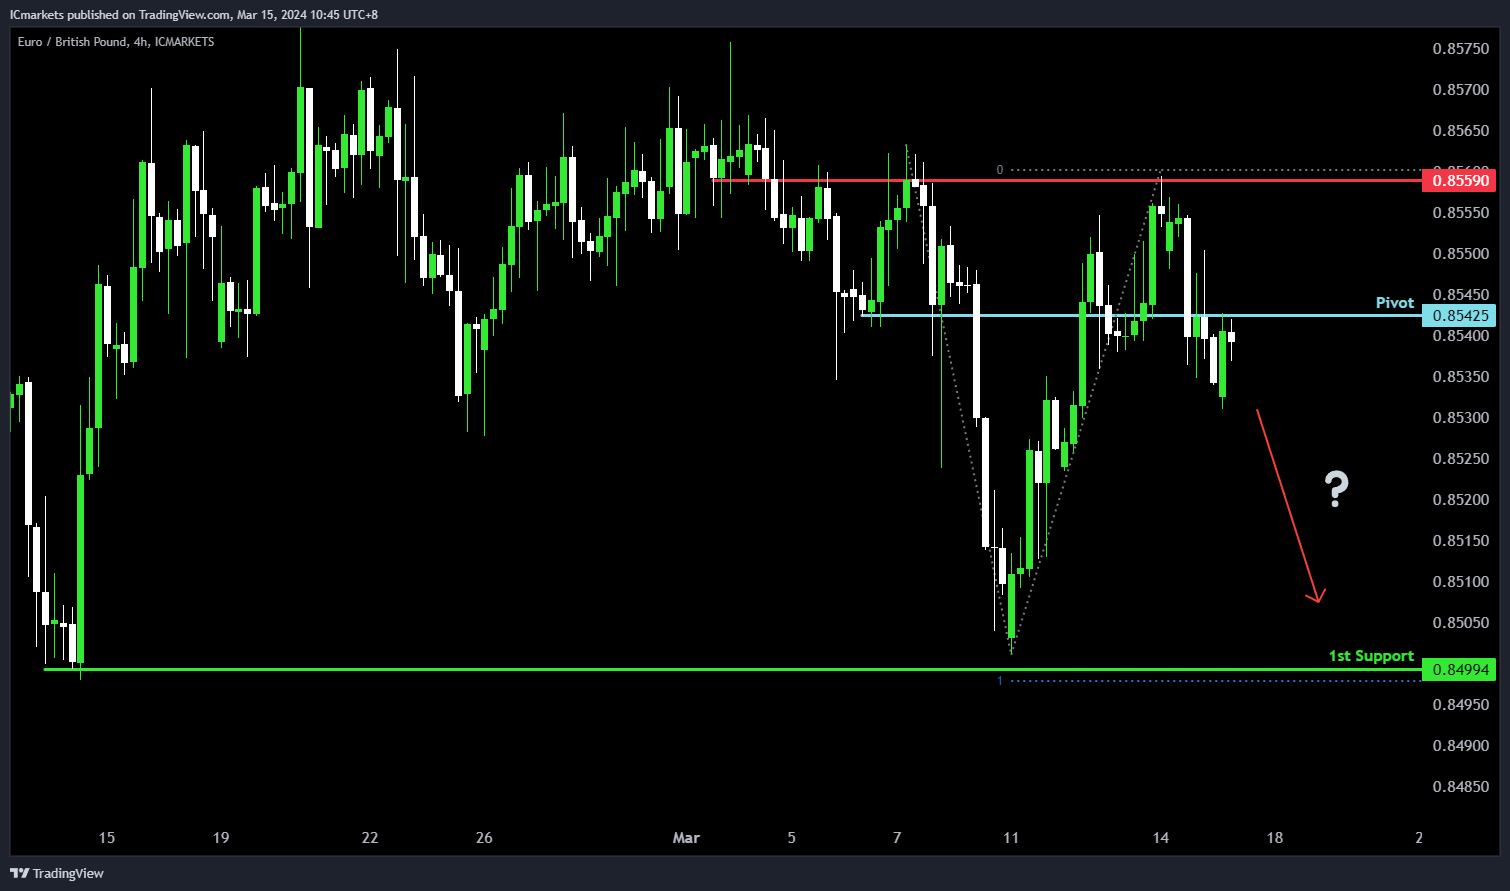
The EUR/GBP chart indicates a potential bearish direction, aligning with the overall bearish momentum. There’s a possibility of a bearish reaction from the pivot level, indicating a potential drop towards the 1st support.
The pivot level at 0.85425 is identified as a pullback support, indicating a significant historical level where buying interest may have emerged in the past.
Furthermore, the 1st support at 0.84994 is characterized as a swing low support, reinforcing its significance as a potential area where buyers could enter the market. Additionally, it coincides with the 100% Fibonacci Projection level, adding further weight to its importance.
On the resistance side, the 1st resistance level at 0.85590 is noted as a swing high resistance, suggesting a historical barrier to upward movement.
GBP/USD:
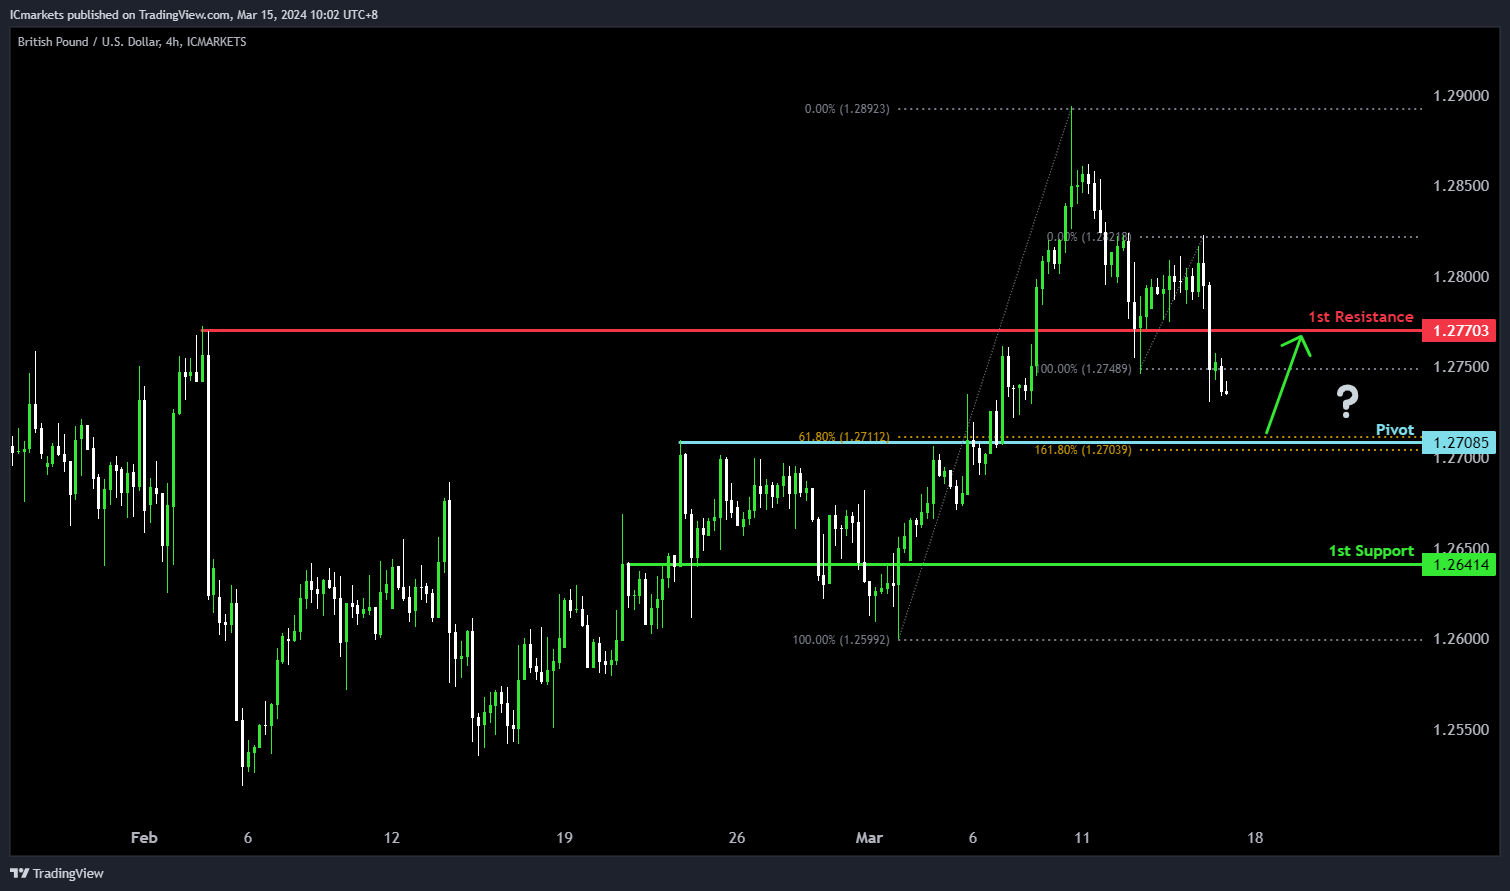
For GBP/USD, the potential direction is bullish, aligning with the overall bullish momentum of the chart. There’s a likelihood of a bullish bounce off the pivot level, indicating a move towards the 1st resistance.
The pivot at 1.2708 is identified as pullback support, reinforced by both the 61.80% Fibonacci Retracement and the 161.80% Fibonacci Extension, suggesting a significant level where buying interest may emerge. Additionally, the 1st support at 1.2641 acts as overlap support, indicating historical significance as a level where buyers have previously intervened.
On the resistance side, the 1st resistance at 1.2770 is noted as pullback resistance, supported by the 50% Fibonacci Retracement, suggesting a potential barrier where selling pressure could increase, potentially limiting further upward movement in the price.
.
GBP/JPY:
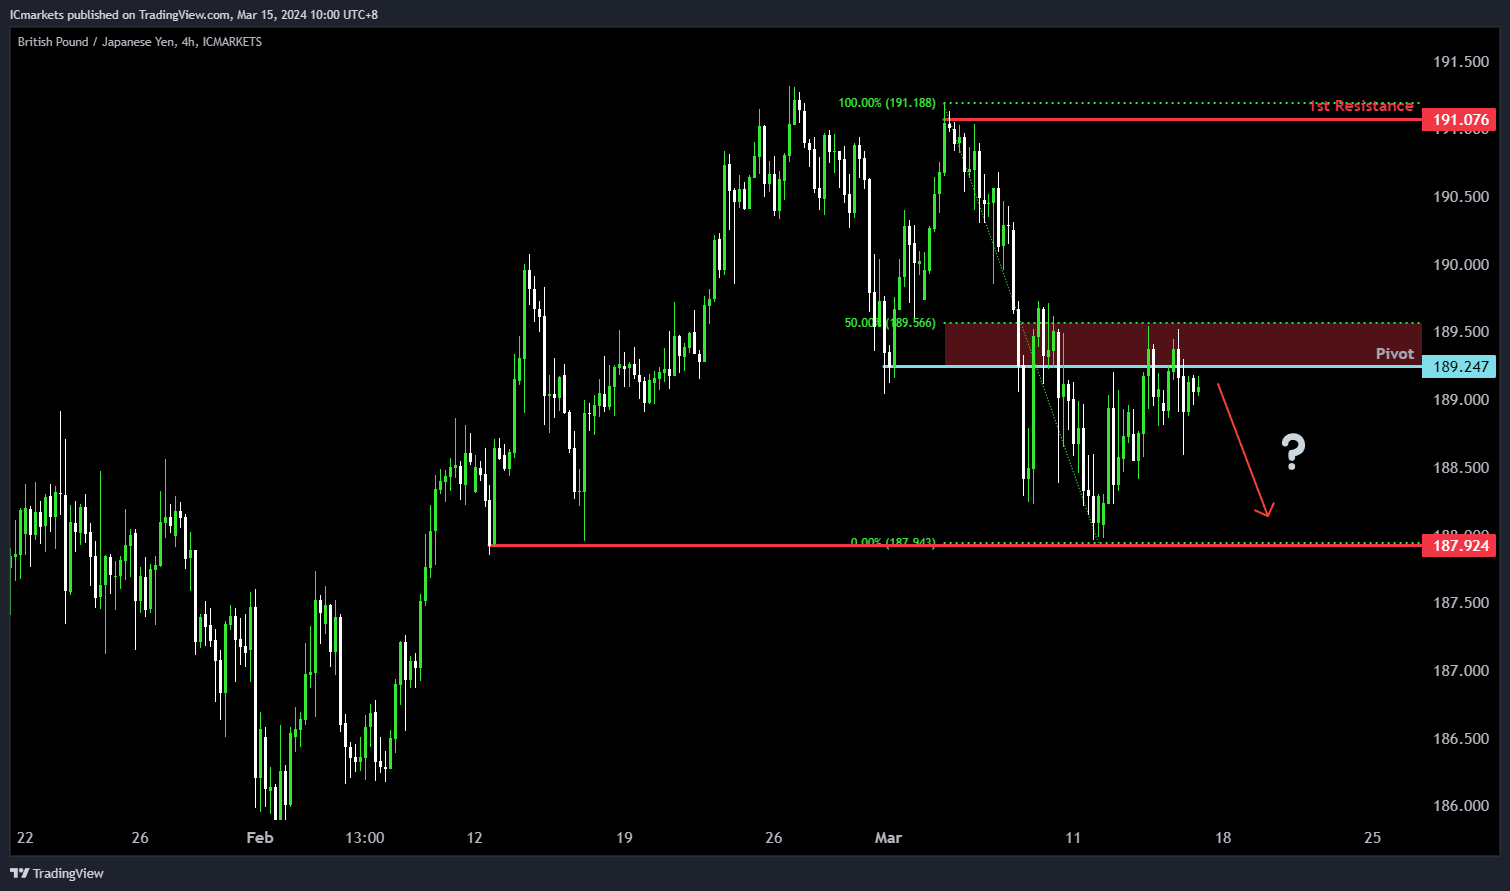
The GBP/JPY chart suggests a potential bearish direction, aligning with the overall bearish momentum. There’s a possibility of a bearish reaction from the pivot level, indicating a potential drop towards the 1st support.
The pivot level at 189.247 is identified as a pullback resistance, indicating a significant historical level where selling pressure may have emerged previously. Additionally, this level coincides with the 50% Fibonacci Retracement, reinforcing its significance as a potential resistance area.
On the support side, the 1st support level at 187.924 is characterized as a multi-swing low support, suggesting it has historically been a strong level where buyers entered the market. This adds to its significance as a potential area where the price could find support.
Conversely, the 1st resistance level at 191.076 is noted as a swing high resistance, indicating a historical barrier to upward movement.
USD/CHF:
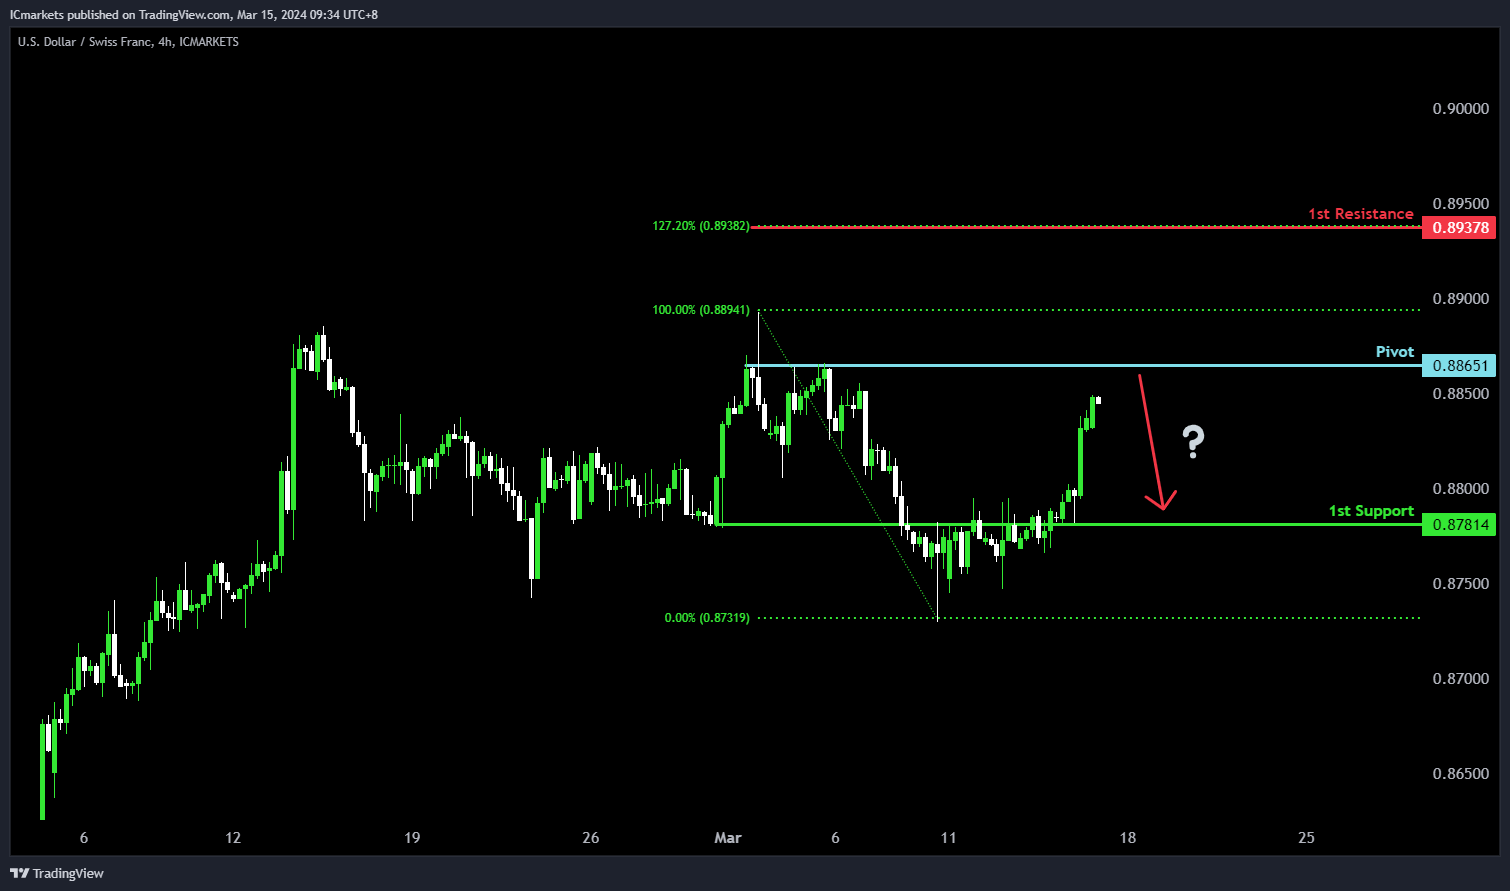
For USD/CHF, the potential direction is bearish, consistent with the overall bearish sentiment of the chart. There’s a possibility of a bearish reaction from the pivot level, indicating a potential drop towards the 1st support.
The pivot at 0.8865 is significant, noted as multi-swing high resistance, suggesting a crucial level. The 1st support at 0.8781 acts as overlap support, indicating historical significance.
On the resistance side, the 1st resistance at 0.8937, supported by the 127.20% Fibonacci Extension, suggests a potential barrier to upward movement.
USD/JPY:
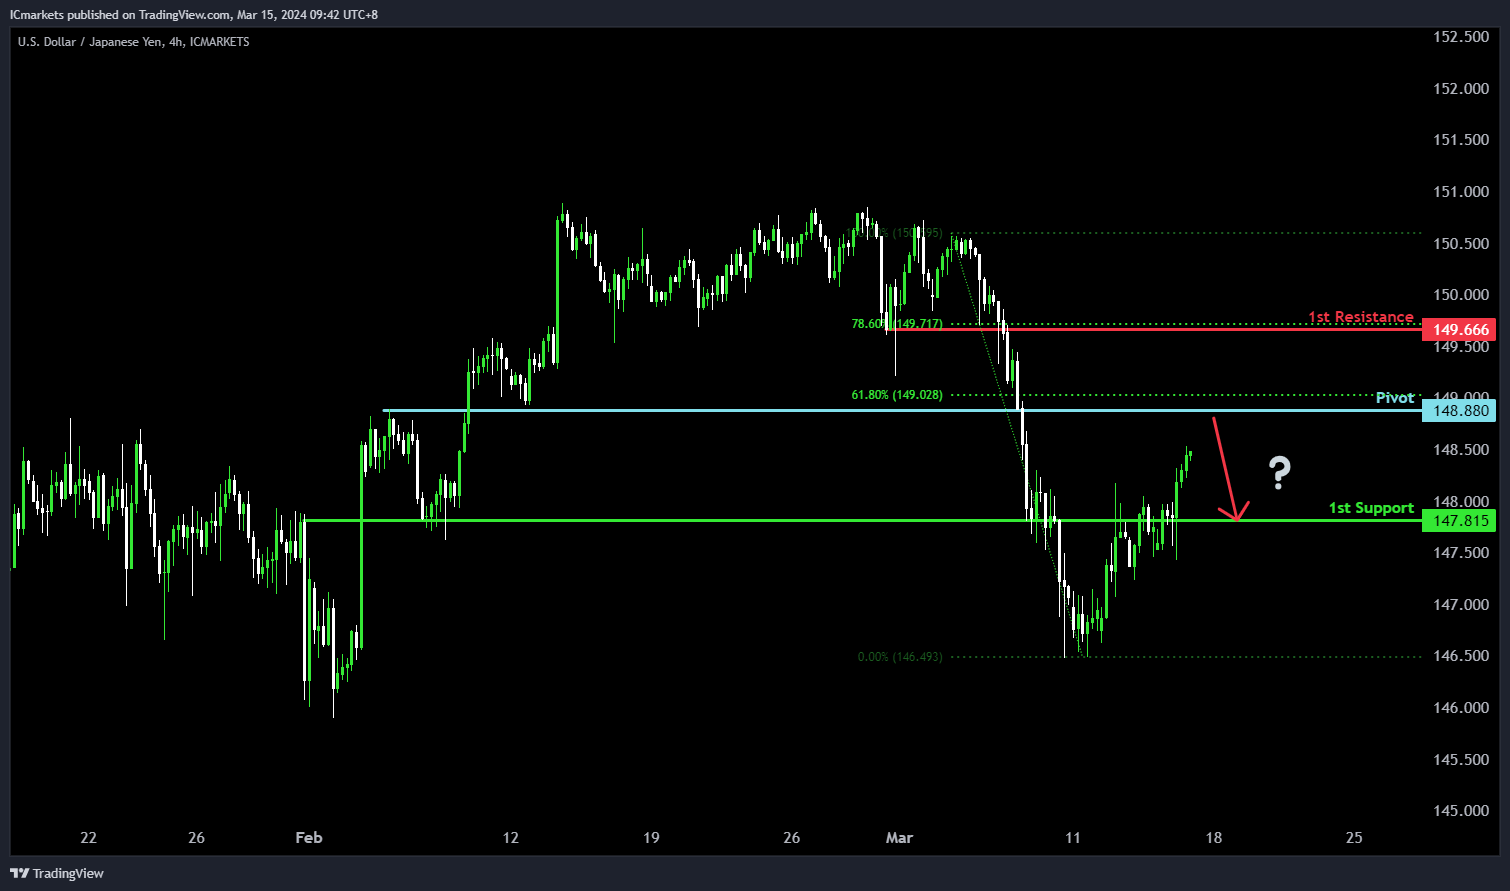
chart. There’s a potential scenario where the price reacts bearishly from the pivot level, leading to a drop towards the 1st support.
The pivot at 148.88 is significant, identified as pullback resistance, with reinforcement from the 61.80% Fibonacci Retracement. This suggests a pivotal level where selling pressure might increase. Additionally, the 1st support at 147.81 serves as overlap support, indicating historical significance.
On the resistance side, the 1st resistance at 149.66, supported by the 78.60% Fibonacci Retracement, forms another barrier to upward movement.
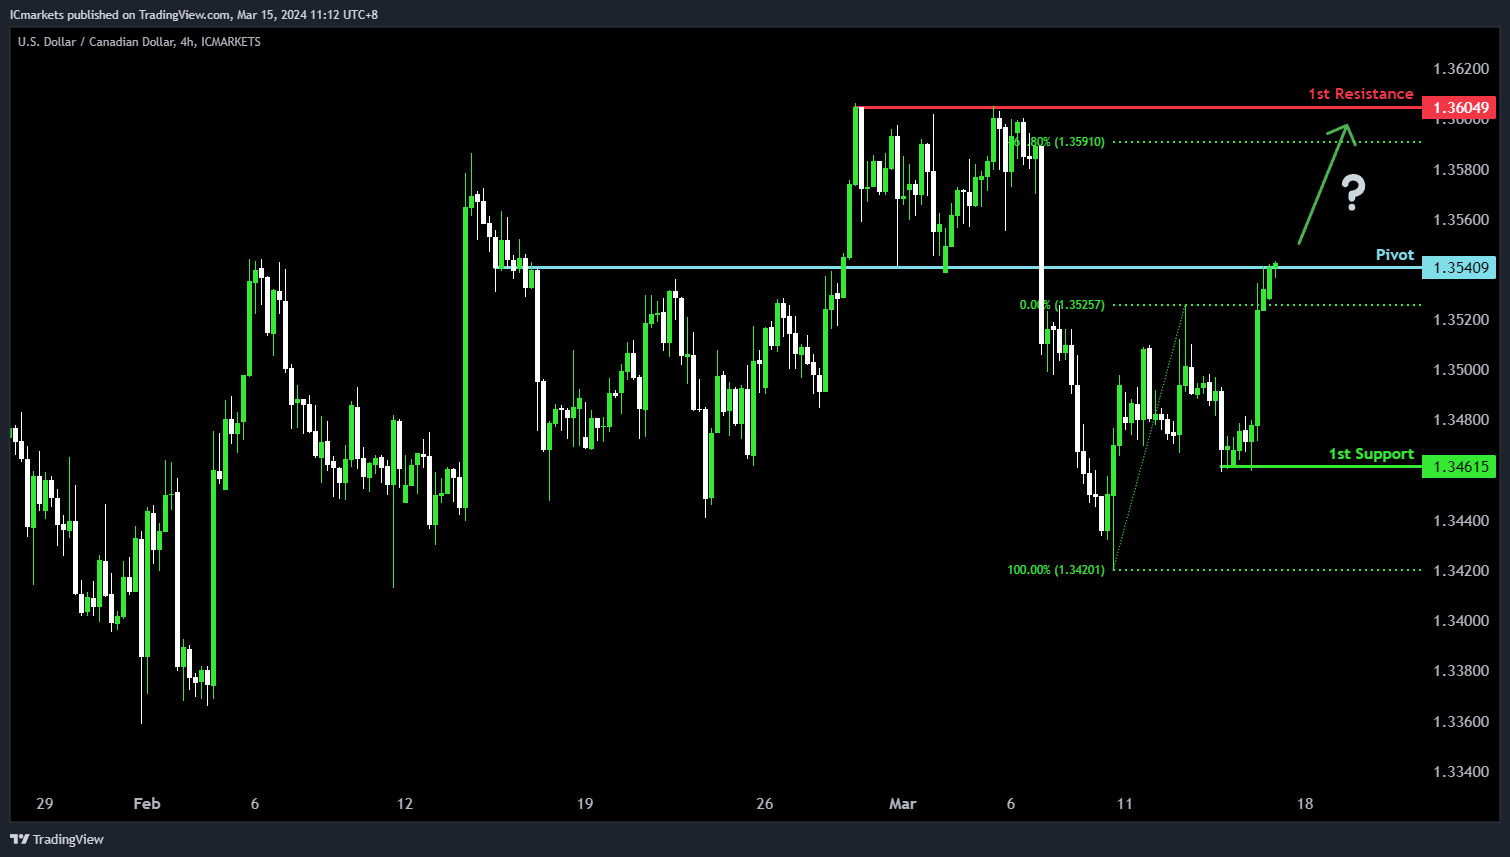
USD/CAD:
The USD/CAD chart currently demonstrates an overall bullish momentum. In this context, there is a potential scenario for price to break above the pivot and rise towards the 1st resistance.
The pivot level at 1.3540 is identified as an overlap resistance where price could potentially break through and climb higher. The 1st resistance level at 1.3604 is noted as a pullback resistance that aligns close to the -61.80% Fibonacci Expansion level, further highlighting its importance as a potential resistance zone.
To the downside, the 1st support level at 1.3461 is marked as a pullback support, reinforcing its significance as a key support level.
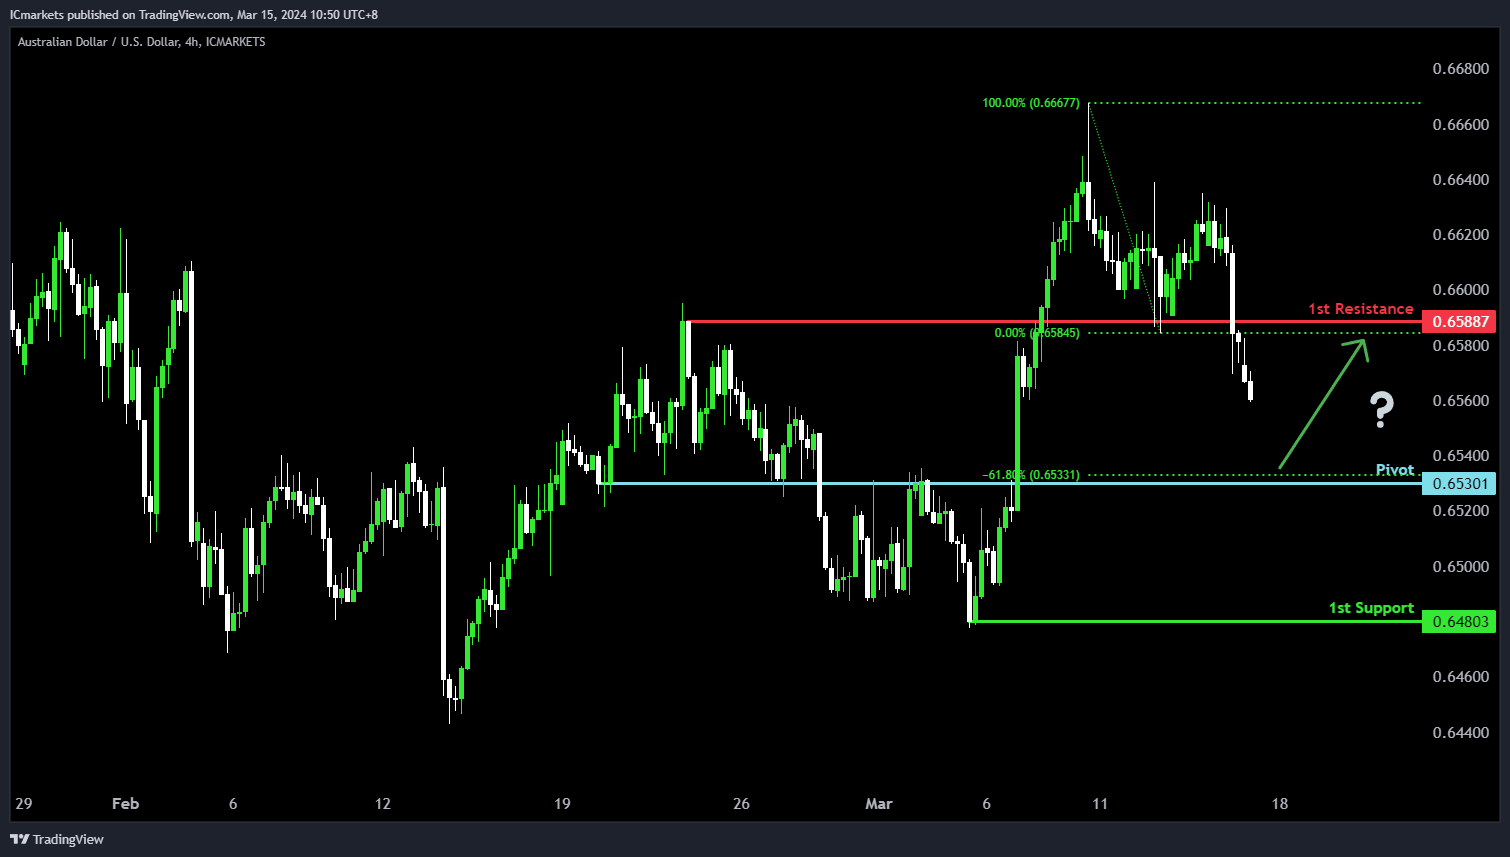
AUD/USD:
The AUD/USD chart currently demonstrates an overall bearish momentum. In this context, there is a potential scenario for price to drop towards the pivot and potentially make a weak bullish bounce towards the 1st resistance.
The pivot level at 0.6530 is identified as an overlap support that aligns with the -61.80% Fibonacci Expansion level where price could potentially reverse from to climb higher. The 1st resistance level at 0.6588 is noted as an overlap resistance, potentially limiting any further upward movement.
On the support side, the 1st support level at 0.6480 is marked as a pullback support, reinforcing its significance as a key support level.
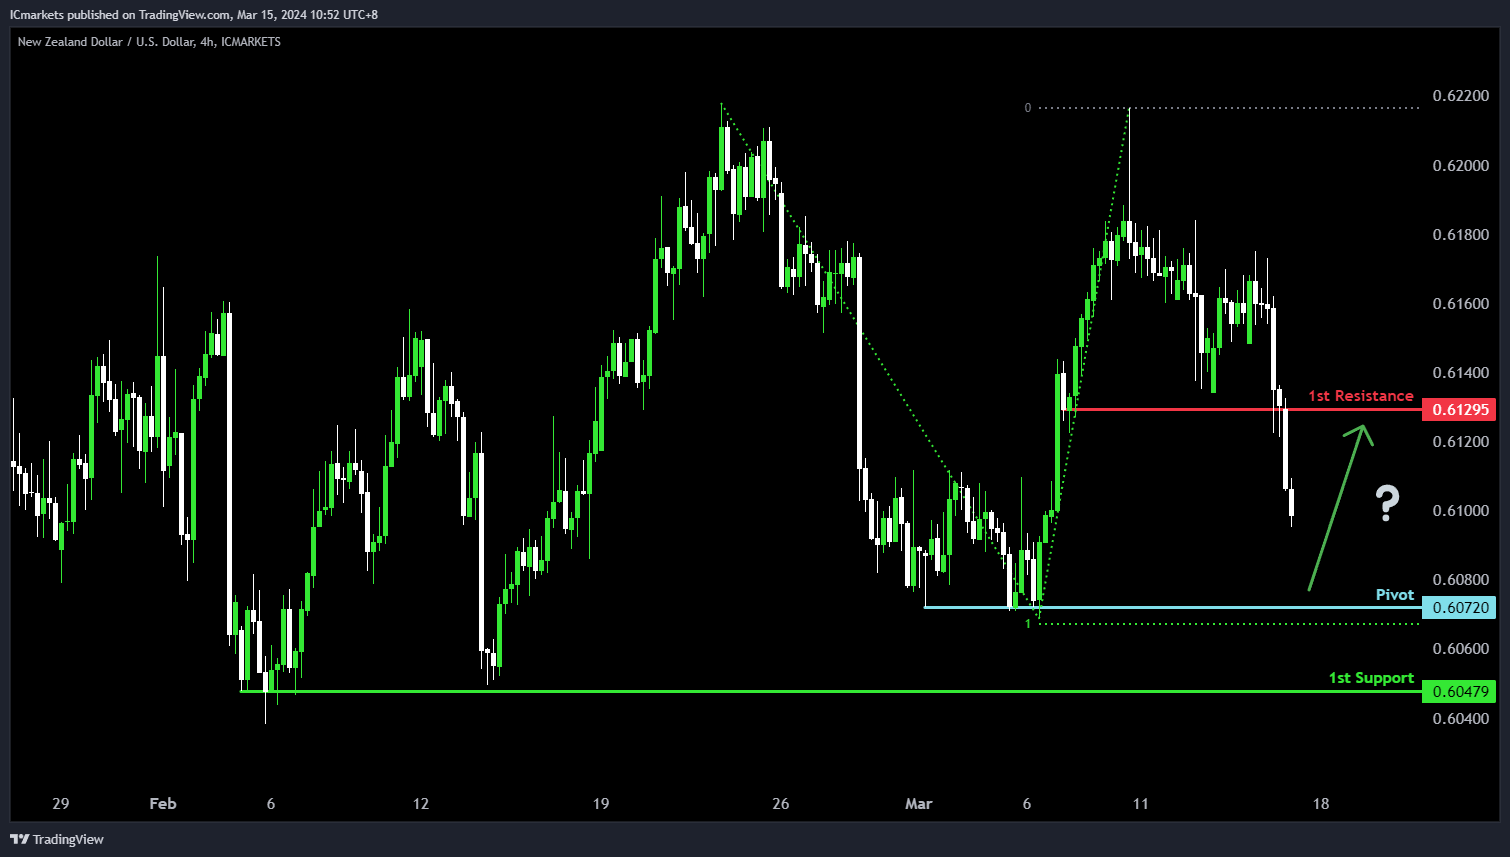
NZD/USD
The NZD/USD chart currently demonstrates an overall bearish momentum. In this context, there is a potential scenario for price to drop towards the pivot and potentially make a weak bullish bounce towards the 1st resistance.
The pivot level at 0.6072 is identified as a pullback support where price could potentially reverse from to climb higher. The 1st resistance level at 0.6129 is noted as a pullback resistance, potentially limiting any further upward movement.
On the support side, the 1st support level at 0.6047 is marked as a pullback support, reinforcing its significance as a key support level.
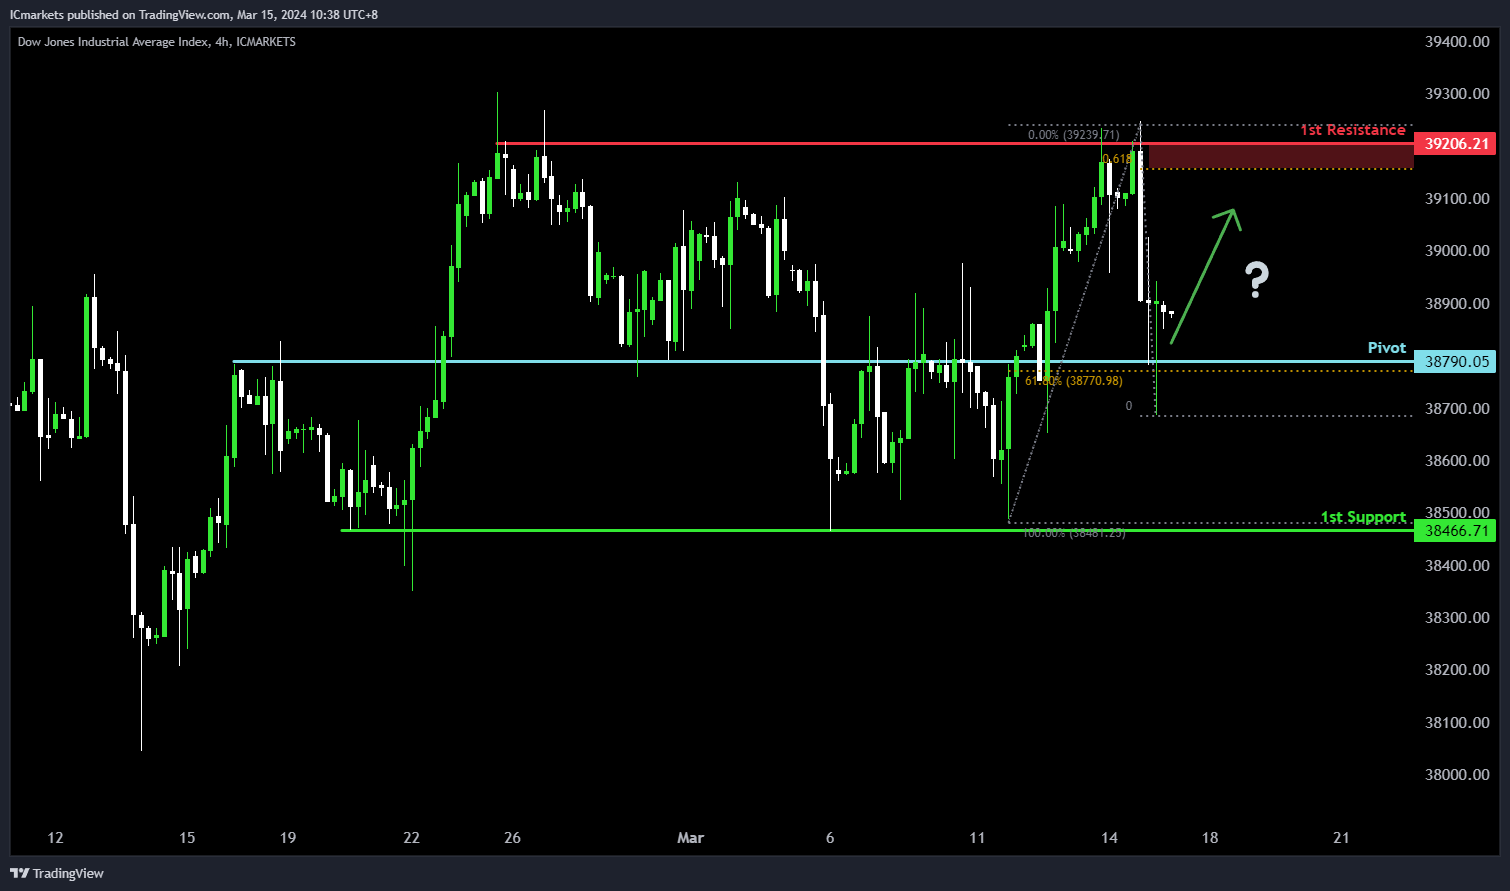
DJ30:
The DJ30 chart suggests a potential bullish direction, consistent with the overall bullish momentum. There is a potential scenario for price to bounce off the pivot and rise towards the 1st resistance.
The pivot level at 38790.05 acts as an overlap support and coincides with the 61.80% Fibonacci Retracement level, indicating a significant historical level where buying interest has previously emerged.
Furthermore, the 1st support at 38466.71 is identified as a swing low support, reinforcing its significance as a potential area where buyers might enter the market.
On the resistance side, the 1st resistance level at 39206.21 is characterized by multi-swing high resistance and aligns with the 61.80% Fibonacci Projection, suggesting a historical barrier to upward movement.
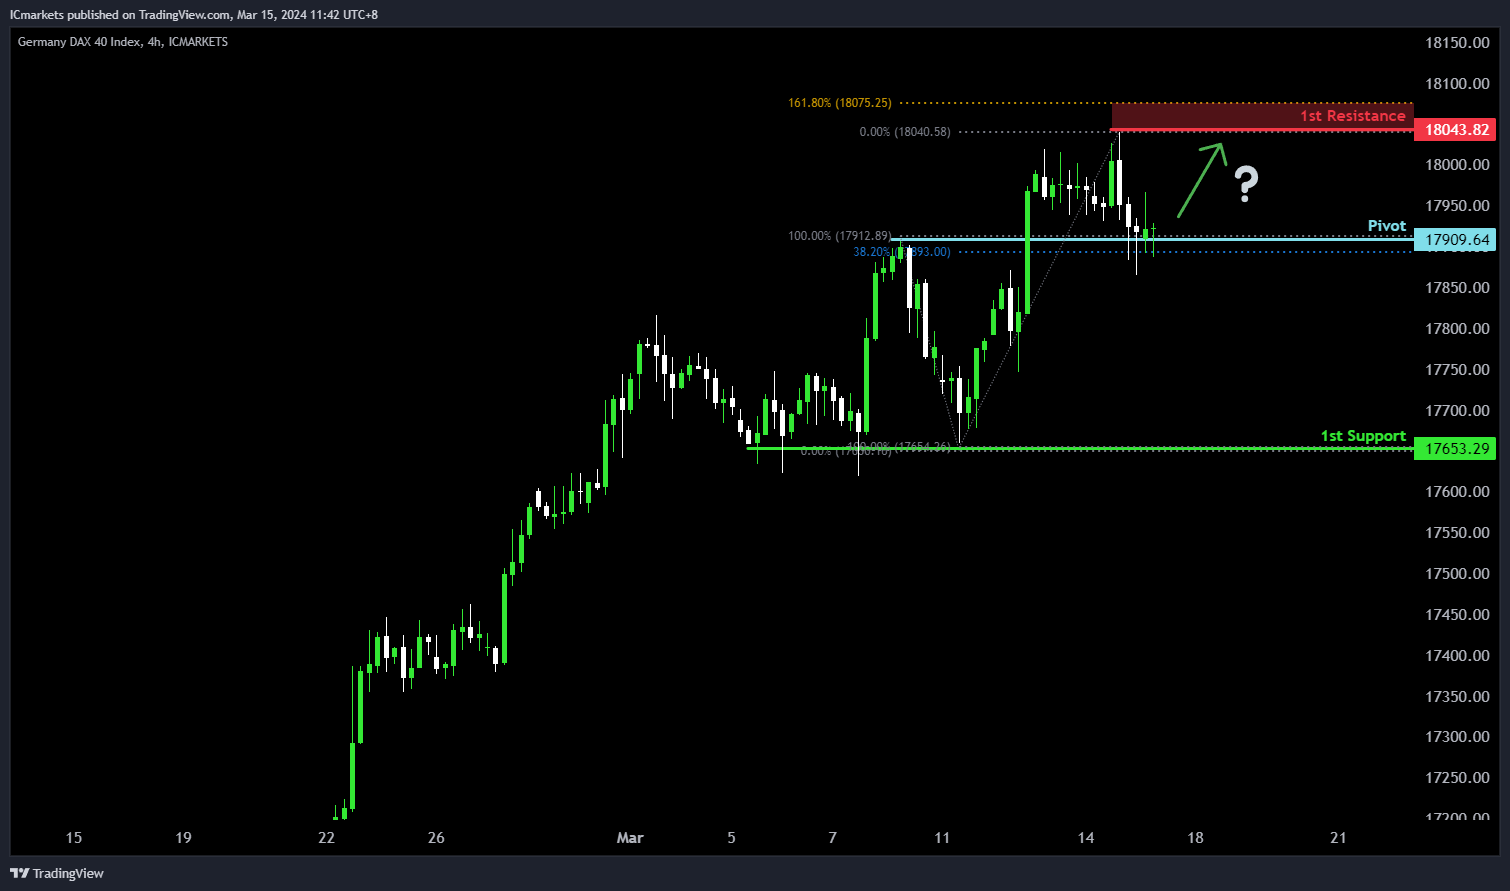
GER40:
The GER40 chart indicates a potential bullish direction, aligning with the overall bullish momentum. There is a potential scenario for price to bounce off the pivot and rise towards the 1st resistance.
The pivot level at 17909.64 serves as a pullback support and coincides with the 38.20% Fibonacci Retracement level, indicating a significant historical level where buying interest has previously emerged.
Furthermore, the 1st support at 17653.29 is identified as a swing low support, reinforcing its significance as a potential area where buyers might enter the market.
On the resistance side, the 1st resistance level at 18043.82 is characterized by the 161.80% Fibonacci Extension, suggesting a potential barrier to upward movement.
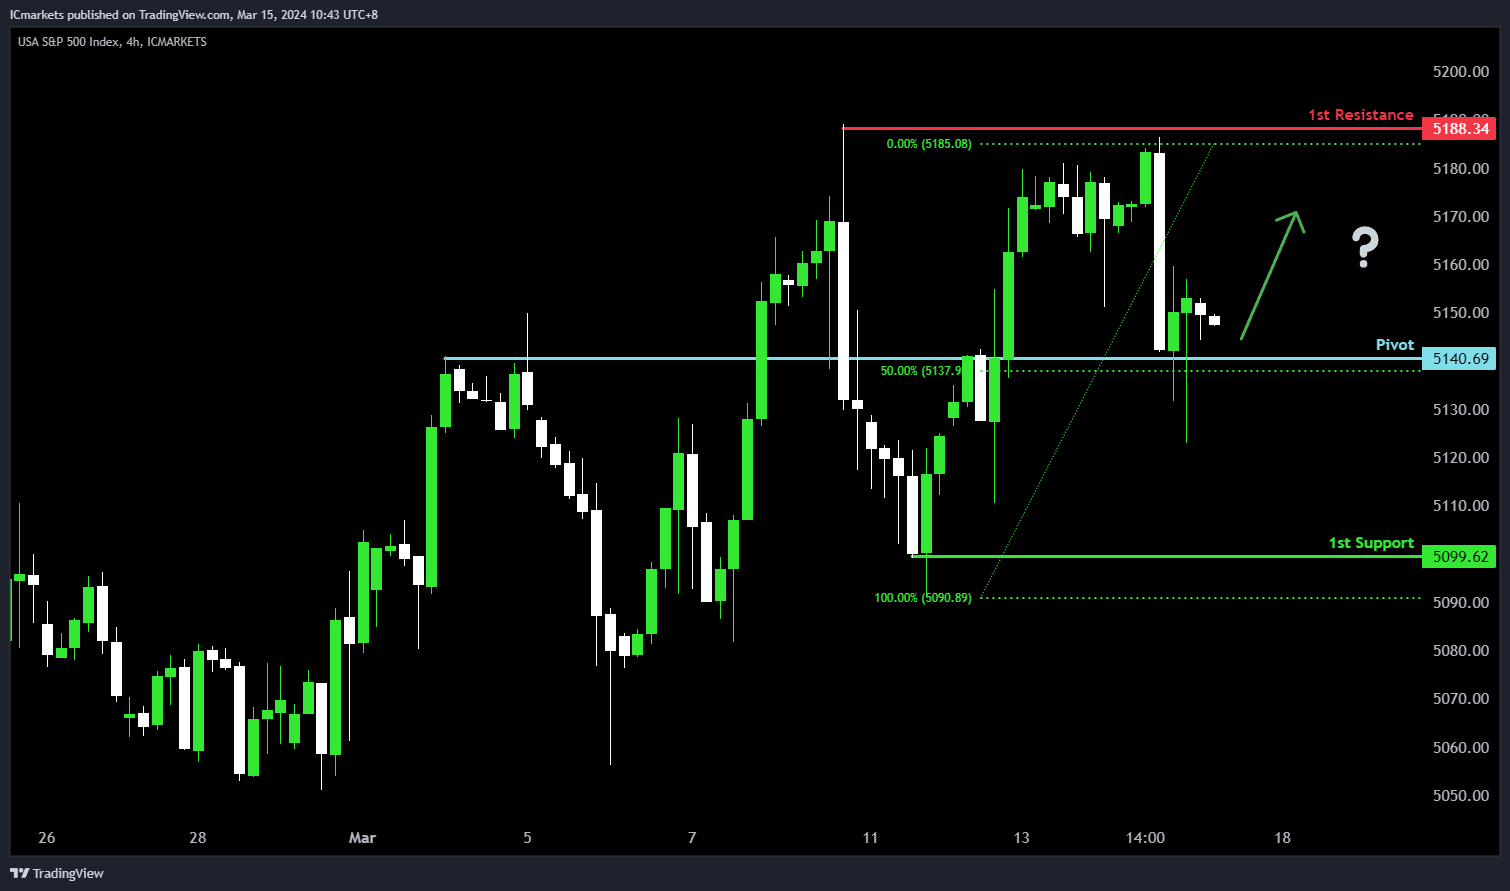
US500:
The US500 chart suggests a potential bullish direction, consistent with the overall bullish momentum. There is a potential scenario for price to bounce off the pivot and rise towards the 1st resistance.
The pivot level at 5140.69 is identified as a pullback support and aligns with the 50% Fibonacci Retracement level, indicating a significant historical level where buying interest may emerge.
Additionally, the 1st support at 5099.62 is characterized as a swing low support, further reinforcing its importance as a potential area where buyers might enter the market.
On the resistance side, the 1st resistance level at 5188.34 is noted as a swing high resistance, suggesting a historical barrier to upward movement.
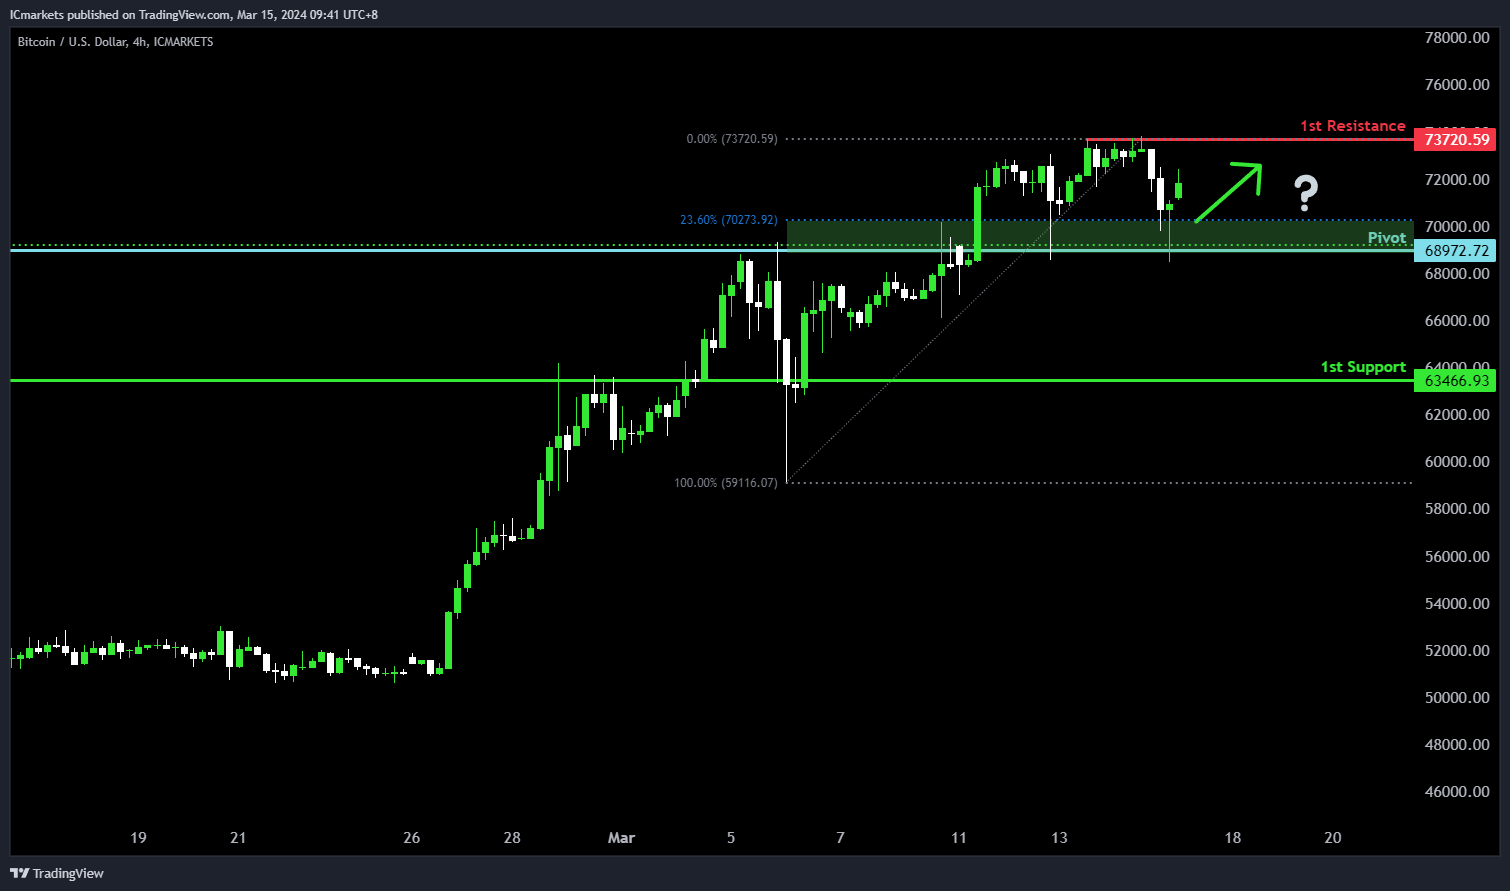
BTC/USD:
The BTC/USD chart indicates a potential bullish direction, in line with the overall bullish momentum. There is a potential scenario for price to bounce off the pivot and rise towards the 1st resistance
The pivot level at 68972.72 acts as an overlap support and coincides with the 23.60% Fibonacci Retracement, signifying a significant historical level where buying interest has been observed.
Additionally, the 1st support at 63466.93 is identified as a pullback support, further strengthening its role as a potential area where buyers could enter the market.
On the resistance side, the 1st resistance level at 73720.59 is characterized as a swing high resistance, suggesting a historical barrier to upward movement.
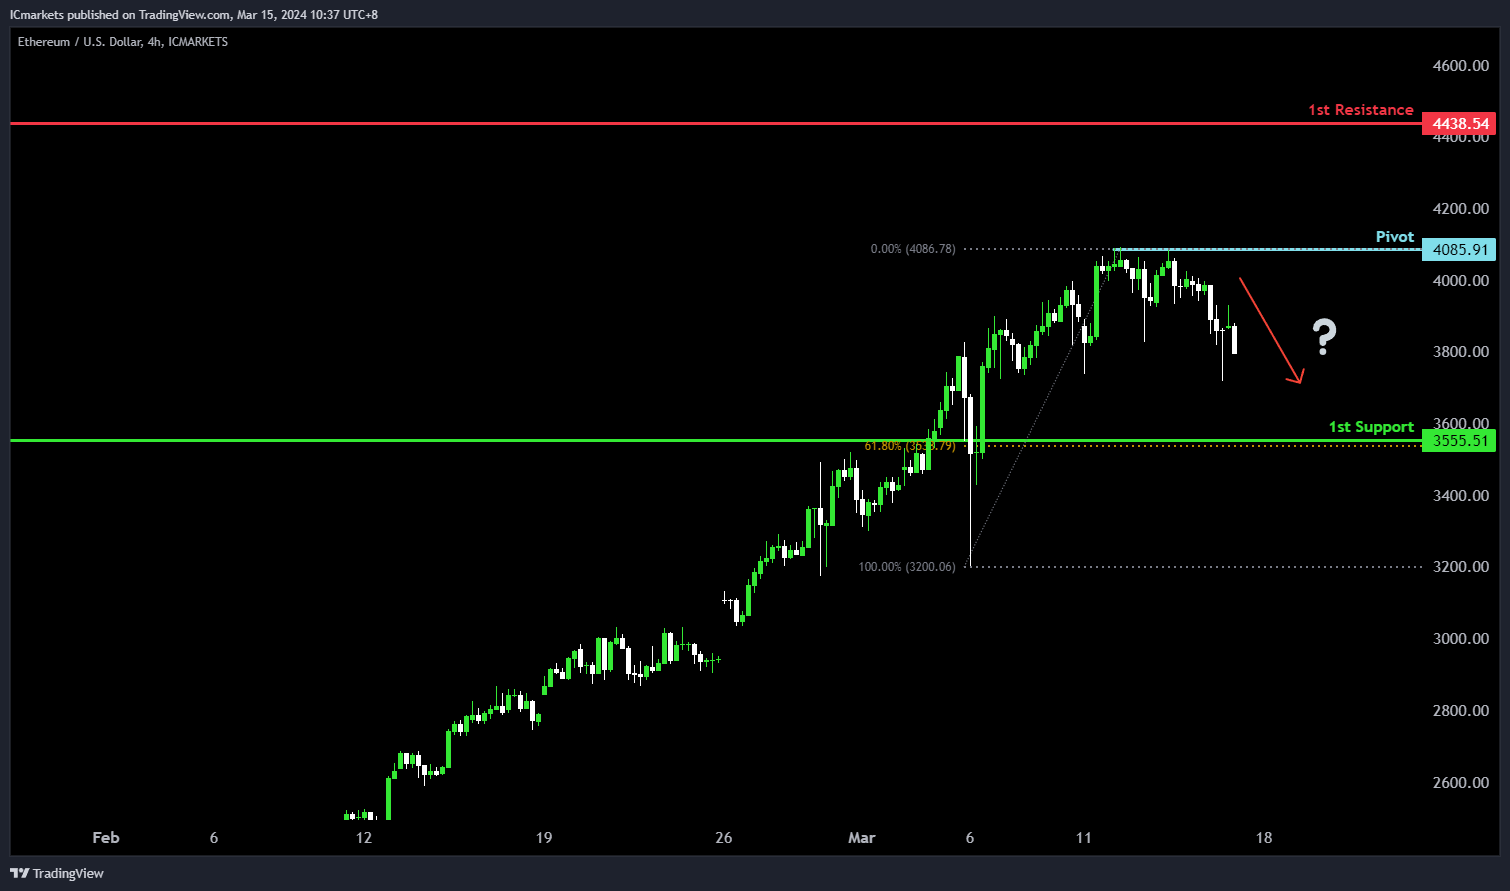
ETH/USD:
The ETH/USD chart suggests a potential bearish direction, contrasting with the overall bullish momentum. There’s a possibility of a bearish reaction from the pivot level, indicating a potential drop towards the 1st support.
The pivot level at 4085.91 acts as a swing high resistance, indicating a significant historical level where selling pressure has been observed.
Furthermore, the 1st support at 3555.51 is identified as a pullback support and coincides with the 61.80% Fibonacci Retracement level, reinforcing its significance as a potential area where buyers might enter the market.
On the resistance side, the 1st resistance level at 4438.54 is characterized as an overlap resistance, suggesting a historical barrier to upward movement.
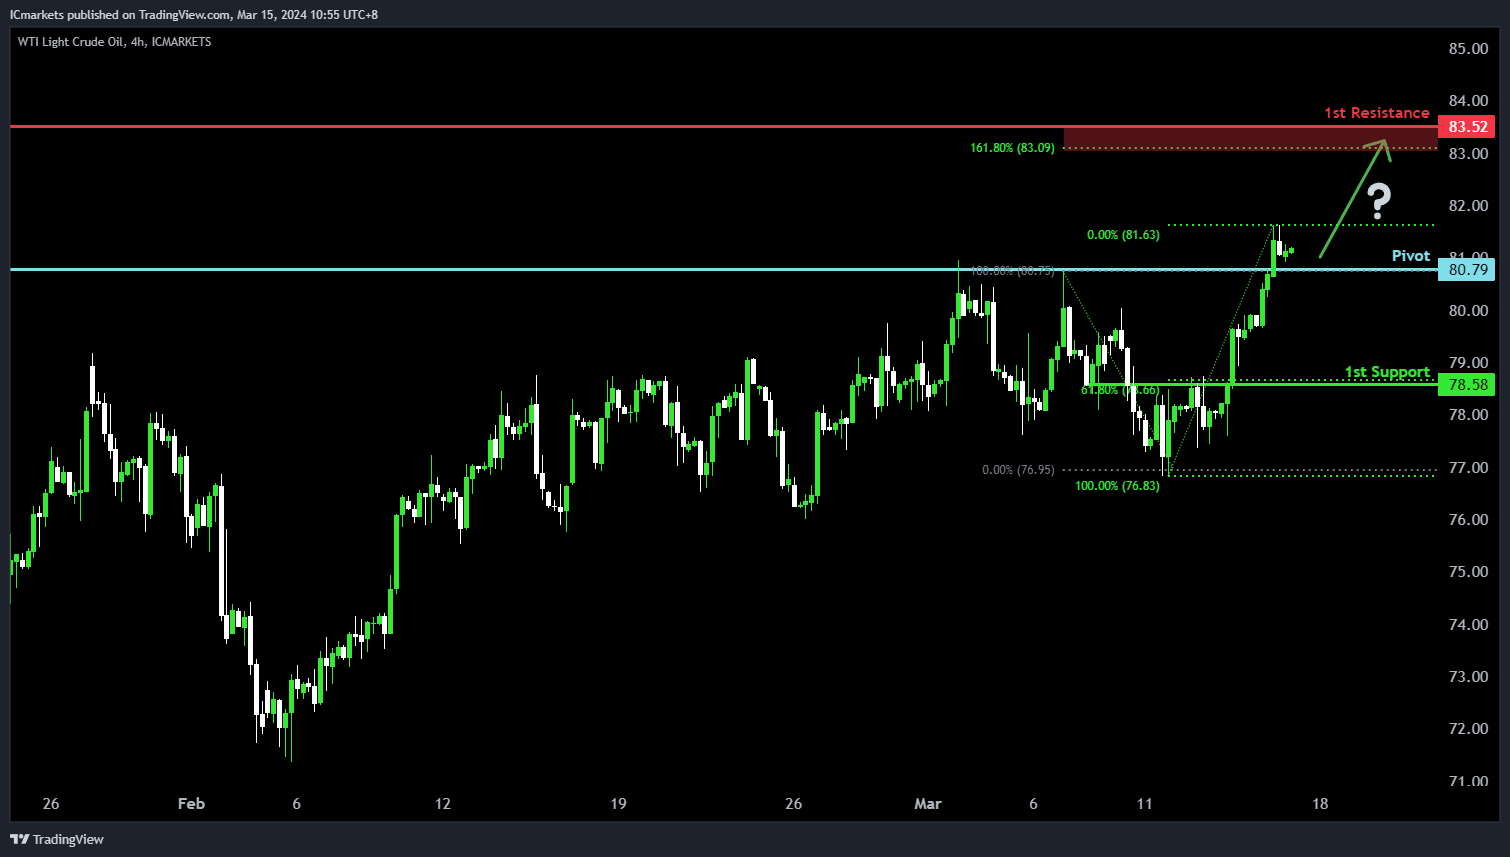
WTI/USD:
The WTI (West Texas Intermediate) chart currently demonstrates an overall bullish momentum. In this context, there is a potential scenario for price to bounce off the pivot and rise towards the 1st resistance.
The pivot level at 80.79 is identified as an overlap support where price could potentially bounce off to climb higher. The 1st resistance level at 83.52 is noted as a pullback resistance that aligns close to the 161.80% Fibonacci Extension level, further reinforcing its significance as a potential barrier to further bullish movement.
To the downside, the 1st support level at 78.58 is marked as an overlap support that aligns with the 61.80% Fibonacci Retracement level, reinforcing its significance as a key support level.
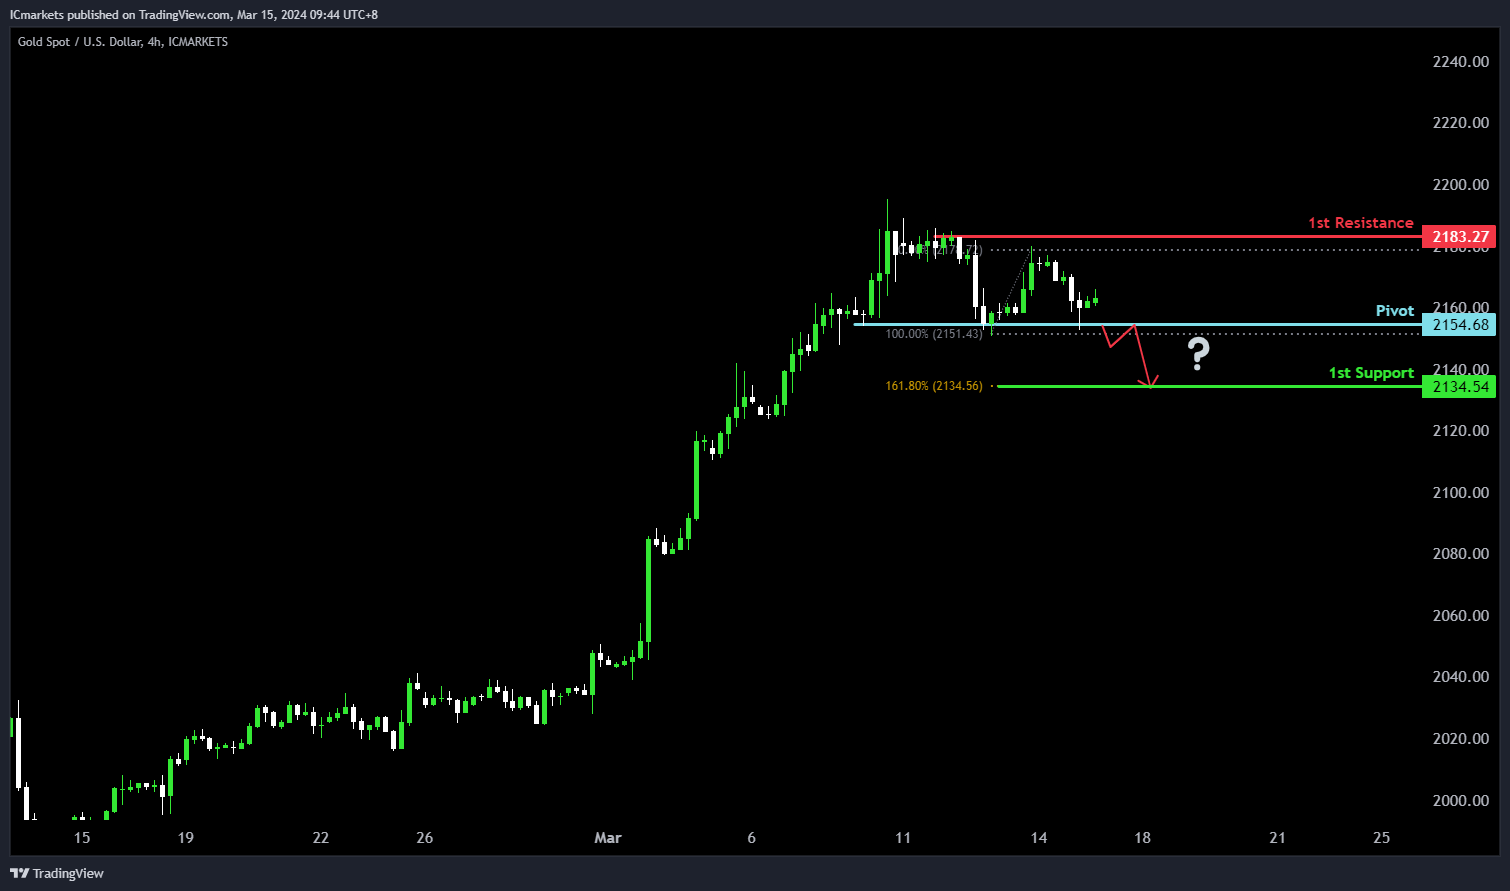
XAU/USD (GOLD):
For XAU/USD, the potential direction is bearish, consistent with the prevailing bearish momentum of the chart. There’s a possibility of a bearish break off the pivot level, leading to a drop towards the 1st support.
The pivot at 2154.68 is significant, identified as multi-swing low support, indicating its importance as a level where buying interest may emerge. However, the price could potentially break below this level towards the 1st support at 2134.54, which is reinforced by the 161.80% Fibonacci Extension, suggesting a strong level of support.
On the resistance side, the 1st resistance at 2183.27 serves as multi-swing high resistance, potentially hindering upward movement.
The accuracy, completeness and timeliness of the information contained on this site cannot be guaranteed. IC Markets does not warranty, guarantee or make any representations, or assume any liability regarding financial results based on the use of the information in the site.
News, views, opinions, recommendations and other information obtained from sources outside of www.icmarkets.com, used in this site are believed to be reliable, but we cannot guarantee their accuracy or completeness. All such information is subject to change at any time without notice. IC Markets assumes no responsibility for the content of any linked site.
The fact that such links may exist does not indicate approval or endorsement of any material contained on any linked site. IC Markets is not liable for any harm caused by the transmission, through accessing the services or information on this site, of a computer virus, or other computer code or programming device that might be used to access, delete, damage, disable, disrupt or otherwise impede in any manner, the operation of the site or of any user’s software, hardware, data or property.


