
A note on lower timeframe confirming price action…
Waiting for lower timeframe confirmation is our main tool to confirm strength within higher timeframe zones, and has really been the key to our trading success. It takes a little time to understand the subtle nuances, however, as each trade is never the same, but once you master the rhythm so to speak, you will be saved from countless unnecessary losing trades. The following is a list of what we look for:
- A break/retest of supply or demand dependent on which way you’re trading.
- A trendline break/retest.
- Buying/selling tails/wicks – essentially we look for a cluster of very obvious spikes off of lower timeframe support and resistance levels within the higher timeframe zone.
- Candlestick patterns. We tend to only stick with pin bars and engulfing bars as these have proven to be the most effective.
We search for lower timeframe confirmation between the M15 the H1 timeframes, since most of our higher-timeframe areas begin with the H4. Stops are usually placed 5-10 pips beyond confirming structures.
EUR/USD:
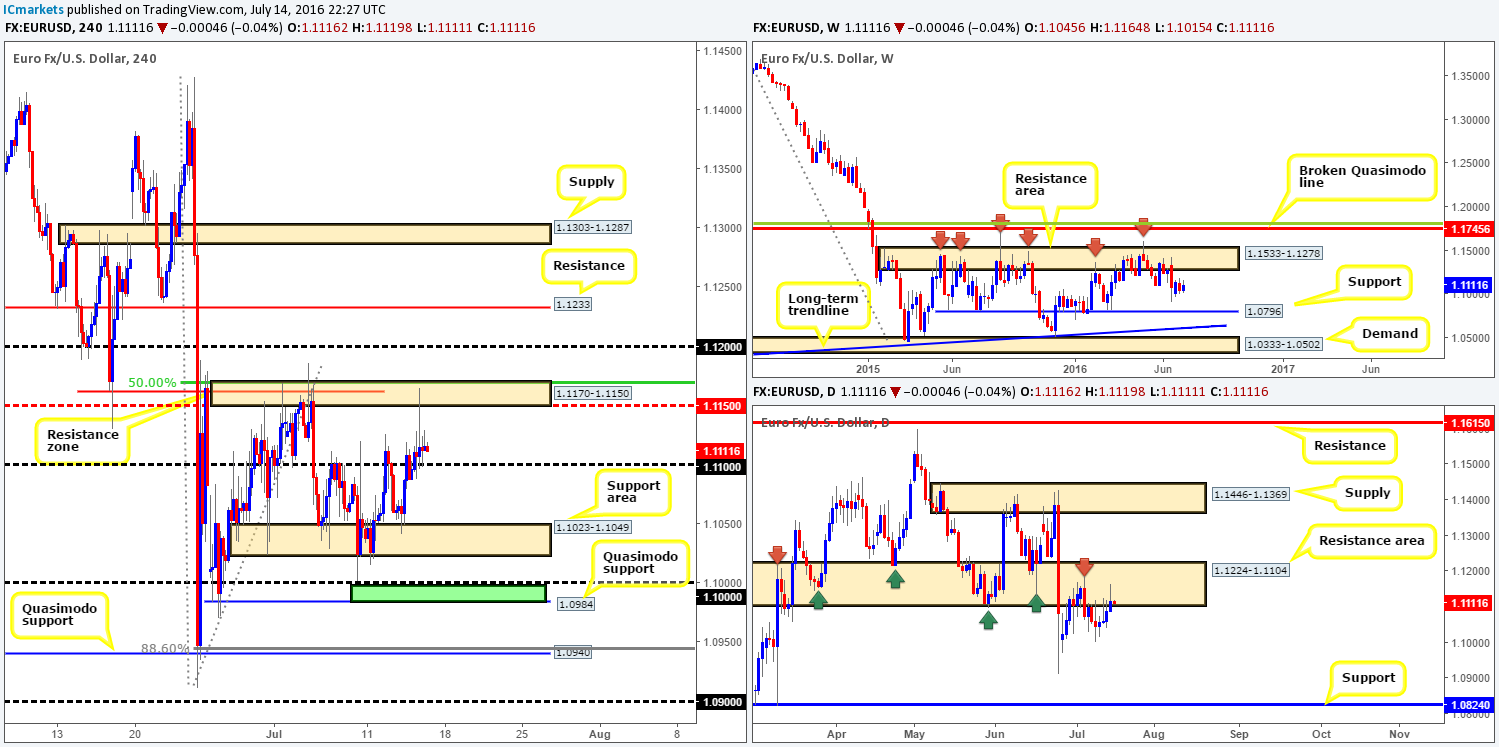
In recent sessions, the single currency received a boost to the upside following the BoE leaving interest rates unchanged. The rally however, was a short-lived one. A string of better than expected US data hit the wire, forcing price to rotate from the H4 resistance zone drawn in at 1.1170/1.1150 back down to the 1.11 region by the day’s end. H4 structure, as can be seen from the chart, is relatively cramped at the moment. To the upside we have the aforementioned H4 resistance zone, while beyond the 1.11 handle, there’s a H4 support area at 1.1023-1.1049 seen in the firing range.
Our suggestions: Despite the somewhat congested trading conditions, we feel further downside is the more likely route today. The reason for why simply comes down to the daily chart trading from within a resistance area coming in at 1.1224-1.1104. With that being said, a break below and retest of 1.11 followed by a lower timeframe sell signal (see the top of this report for entry techniques), would be enough for us to consider selling this market. The first take-profit target from here can be seen at the above said H4 support area, with the second target zone falling in between 1.0984/1.10.
Levels to watch/live orders:
- Buys: Flat (Stop loss: N/A).
- Sells: Watch for price to consume the 1.11 handle and look to trade any retest seen thereafter (lower timeframe confirmation required).
GBP/USD:
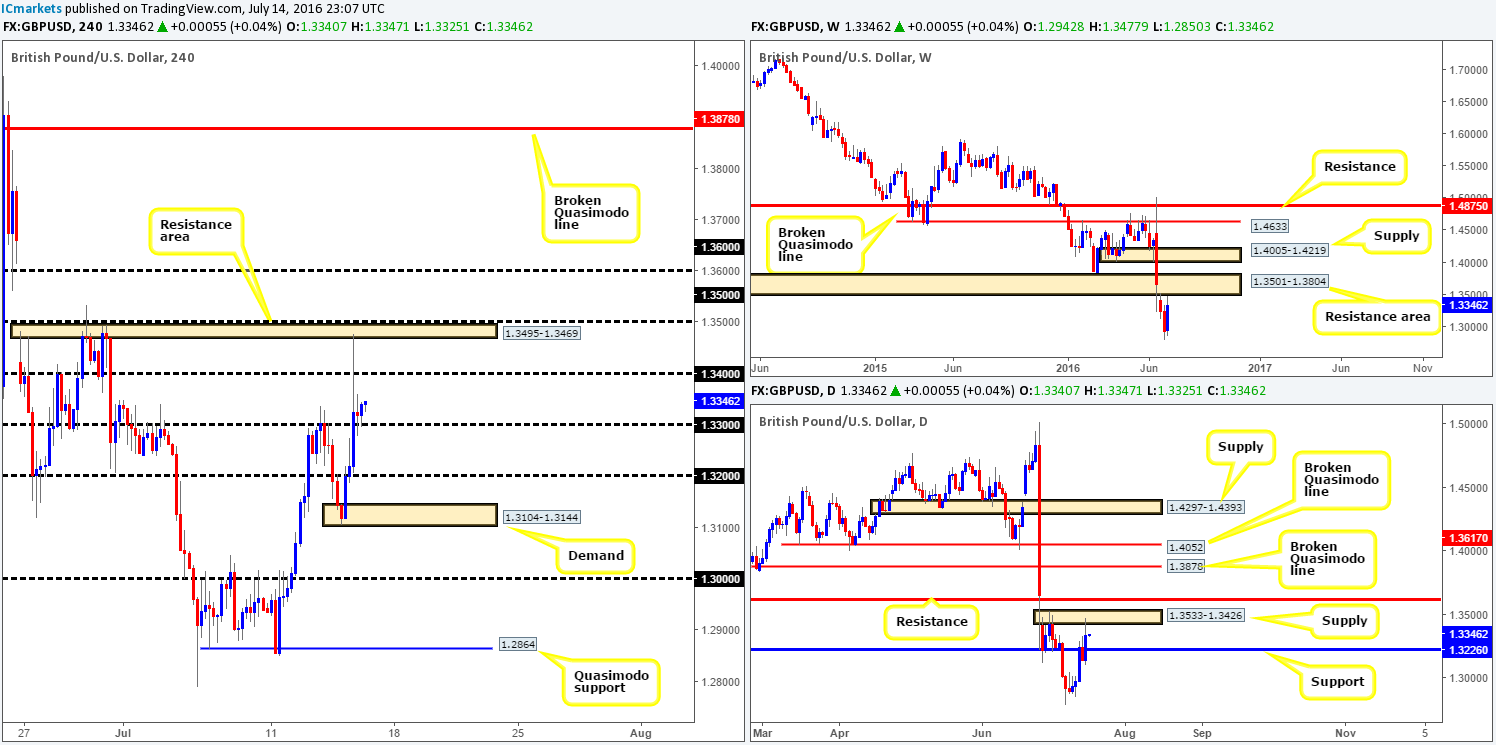
Kicking off this morning’s report with a look at the weekly chart shows us that price recently came within twenty or so pips of striking the weekly resistance area drawn from 1.3501-1.3804, which for the time being is holding price lower. Turning our attention to the daily chart, we can see that cable rebounded from a daily supply area at 1.3533-1.3426, which is glued to underside of the aforementioned weekly resistance area. To our way of seeing things, the next downside target from this zone falls in at 1.3226: a recently broken daily resistance-turned support.
Stepping across to the H4 chart, yesterday’s mid-morning trade in London saw the pair aggressively rally higher on the back of the BoE leaving interest rates unchanged. As is shown on the H4 chart, price whipsawed through both the 1.33 and 1.34 handles, before finding a pocket of offers around a small H4 resistance area at 1.3495-1.3469. In light of price now seen retesting 1.33 as support, is this enough to buy the GBP considering the higher timeframe structures?
Our suggestions: Buying from 1.33 is not something our team would stamp high probability, simply due to where price is positioned on the higher timeframes (see above). Therefore, we’re now looking for 1.33 to give way. A break below this line followed by a retest and a lower timeframe sell signal is sufficient enough, in our opinion, to sell this market. We’d look to take initial profits around the daily support at 1.3226, followed by the 1.32 handle, and then with a little bit of luck, possibly the H4 demand zone at 1.3104-1.3144.
Levels to watch/live orders:
- Buys: Flat (Stop loss: N/A).
- Sells: Watch for price to consume the 1.33 handle and look to trade any retest seen thereafter (lower timeframe confirmation required).
AUD/USD:
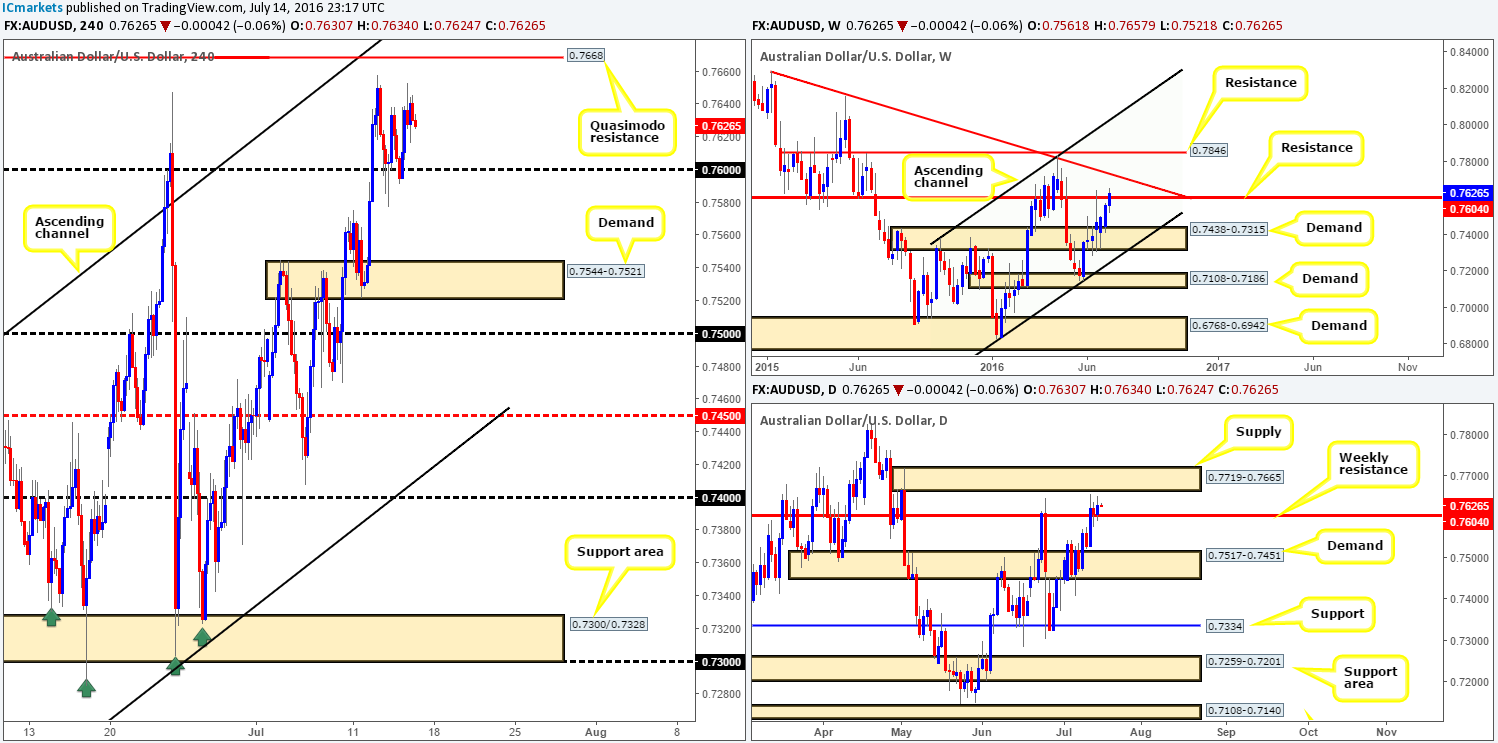
Following yesterday’s advance from the 0.76 region, the AUD/USD pair consolidated in a tight range between 0.7640/0.7628. This, as you can see, leaves the commodity-linked currency loitering mid-range between 0.76 and a H4 Quasimodo resistance level at 0.7668. Consequent to this rather lackluster performance, much of the following report will echo thoughts put forward in our previous analysis…
The weekly resistance level at 0.7604 is showing signs of weakness at the moment, especially seeing as how daily action is now using the line as support to potentially propel prices up to daily supply at 0.7719-0.7665.
Our suggestions: Despite weakness being seen around the current weekly resistance line, the H4 Quasimodo level at 0.7668 is an interesting zone and somewhere we’d consider shorting, due to it fusing beautifully with the underside of the aforementioned daily supply zone. Waiting for lower timeframe confirmation is recommended (see the top of this report) but given the higher timeframe convergence, a market order at 0.7667 with a stop placed ABOVE the daily supply is also something to consider.
Levels to watch/live orders:
- Buys: Flat (Stop loss: N/A).
- Sells: 0.7668 region [Market entry is possible as long as one is willing to place their stops above the daily supply area at 0.7719-0.7665] (Stop loss: 0.7723).
USD/JPY:
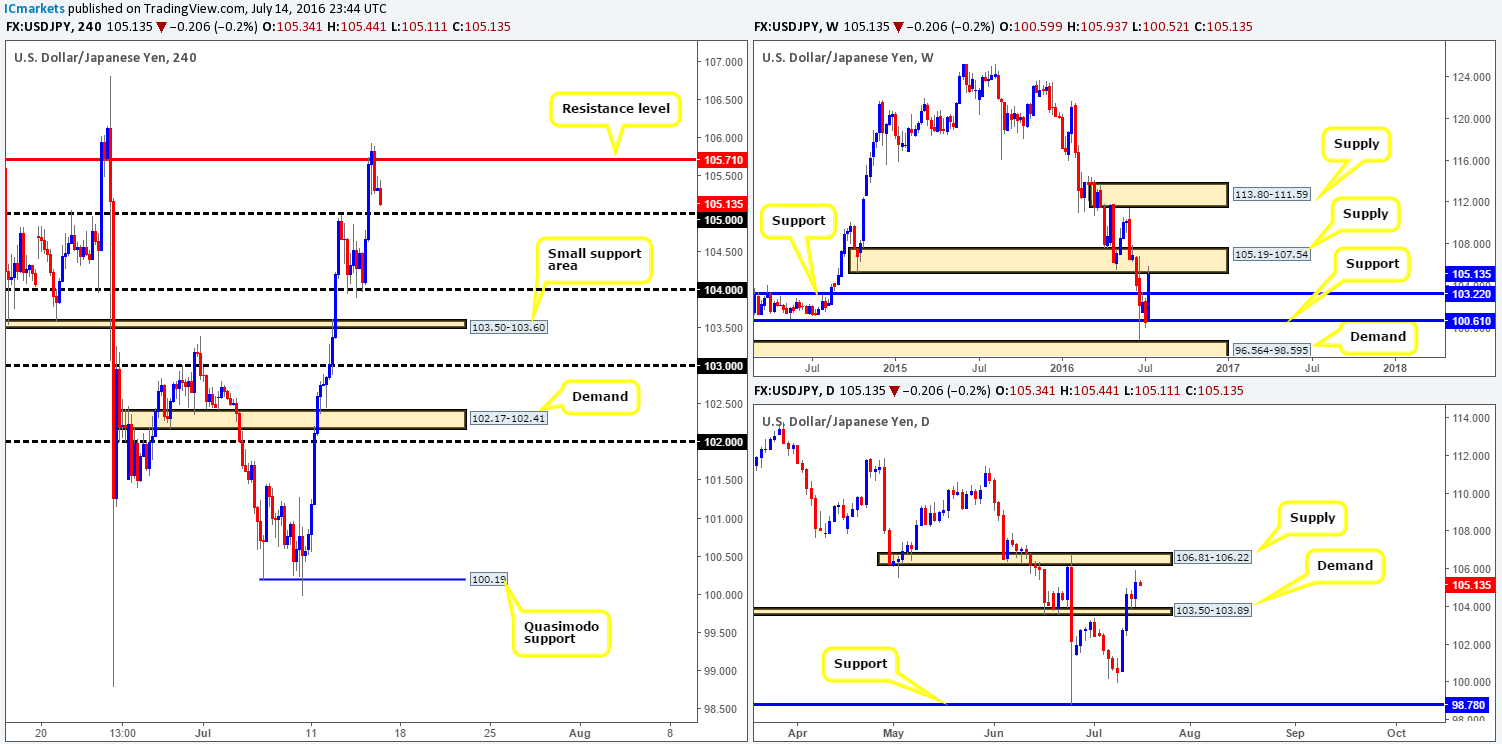
Going into the early hours of yesterday’s sessions, the USD/JPY bottomed out around the 104 handle and rallied over 170 pips! This impressive round of buying, as you can see, began leveling off once price tagged the H4 resistance level at 105.71 amid European trading.
The bearish response from the aforementioned H4 resistance should not really come as much of a surprise. Not only was price trading within touching distance of a daily supply zone registered at 106.81-106.22, but price is now seen crossing swords with a weekly supply at 105.19-107.54. This begs the question whether the sellers can continue driving this market lower today and possibly rip through bids at the 105 handle?
Our suggestions: In light of the above points, we feel that the major will take out bids around 105 today, and potentially continue lower down to 104. To trade this move, however, we’d need to see two things happen. Firstly, a retest of 105 as resistance, and secondly a lower timeframe sell signal following the retest. This could be either an engulf of demand followed by a subsequent retest as supply, a trendline break/retest or simply a collection of well-defined selling wicks around 105. Stops are usually placed 5-10 pips above the confirming structures.
Levels to watch/live orders:
- Buys: Flat (Stop loss: N/A).
- Sells: Watch for price to consume the 105 handle and look to trade any retest seen thereafter (lower timeframe confirmation required).
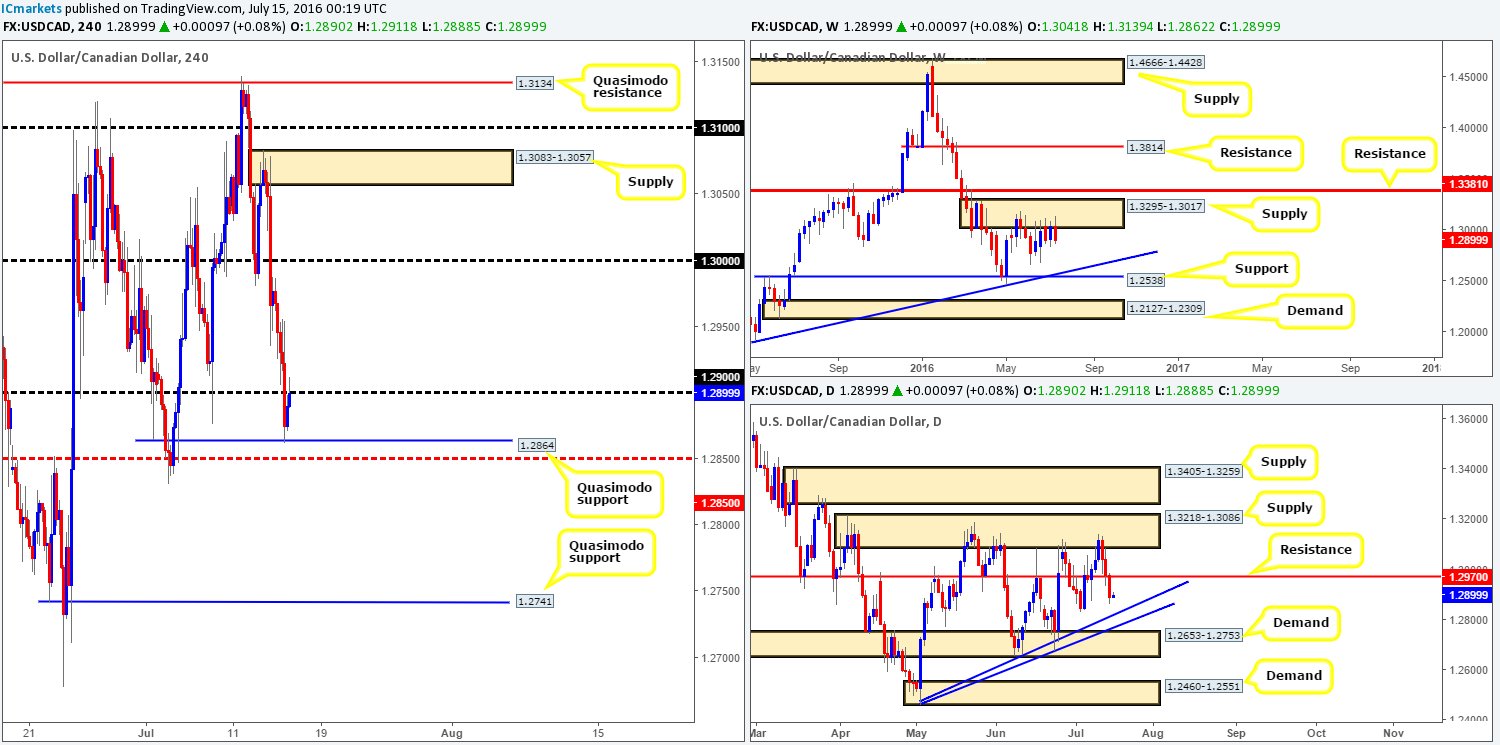
USD/CAD:
The USD/CAD declined in value for a third consecutive day yesterday, resulting in price taking out the 1.29 handle and attacking a H4 Quasimodo support level at 1.2864. Given that the loonie is flirting with the underside of 1.29 at the moment, where does one go from here? Well, taking into account that weekly price is selling off from the underside of a weekly supply zone at 1.3295-1.3017, alongside daily action recently closing below daily support at 1.2970 (now acting resistance), the market may see further selling today…
Our suggestions: One could look to short from the 1.29 handle today. However, although the higher timeframe structures do support further downside, the H4 take-profit targets are positioned rather close by: the H4 Quasimodo support at 1.2864 and the H4 mid-way support at 1.2850 (fuses with a daily trendline support taken from the low 1.2460 and is the next downside target on the daily timeframe).
Therefore, if one is able to pin down a setup on the lower timeframes around 1.29 with a small stop-loss order, a sell trade is a viable option from here in our book.
Levels to watch/live orders:
- Buys: Flat (Stop loss: N/A).
- Sells: 1.29 region [Tentative – confirmation required] (Stop loss: dependent on where one confirms this area).
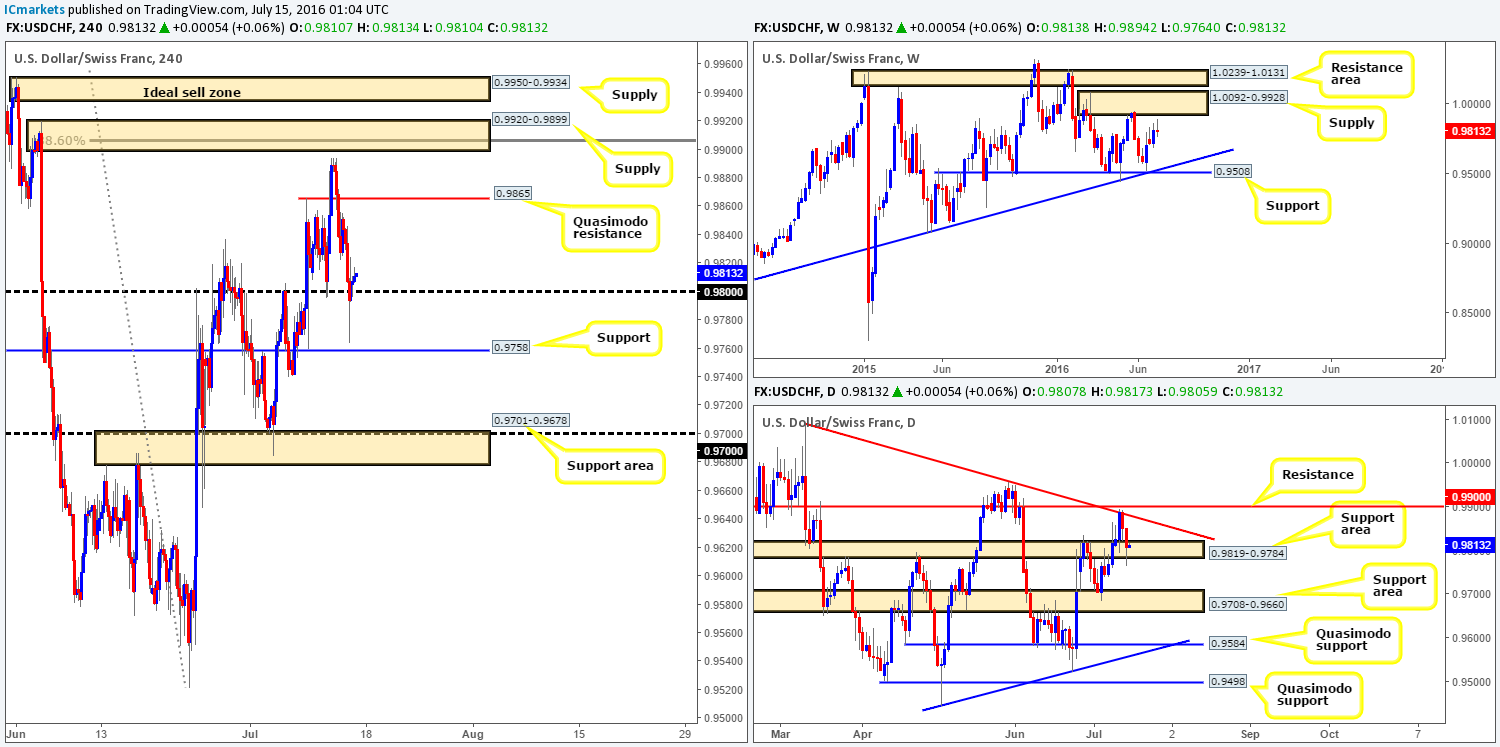
USD/CHF:
Since the USD/CHF topped out just ahead of the H4 supply at 0.9920-0.9899, the pair has declined in value for two consecutive days. Following the BoE keeping interest rates unchanged yesterday, the pair, as you can see, aggressively whipsawed through the 0.98 handle.
For traders looking to buy above 0.98 today, here’s what we’re seeing at the moment:
- On the H4 chart, there’s room seen to advance north up to a H4 Quasimodo resistance line at 0.9865.
- 0.98 is bolstered by a daily support area at 0.9819-0.9784.
- Weekly price, however, came within shouting distance of connecting with a weekly supply zone at 1.0092-0.9928, before undergoing a downside correction. This – coupled with the fact that the next upside target on the daily chart is a nearby daily trendline resistance extended from the high 1.0092, is a little concerning.
Our suggestions: Personally, we do not see anything concrete in this market today. The upside path is too risky due to the possibility of continuation selling from the aforementioned weekly supply area (see above), and below 0.98 there’s a nearby H4 support sitting forty pips away at 0.9758. This makes selling difficult in regards to risk/reward!
Levels to watch/live orders:
- Buys: Flat (Stop loss: N/A).
- Sells: Flat (Stop loss: N/A).
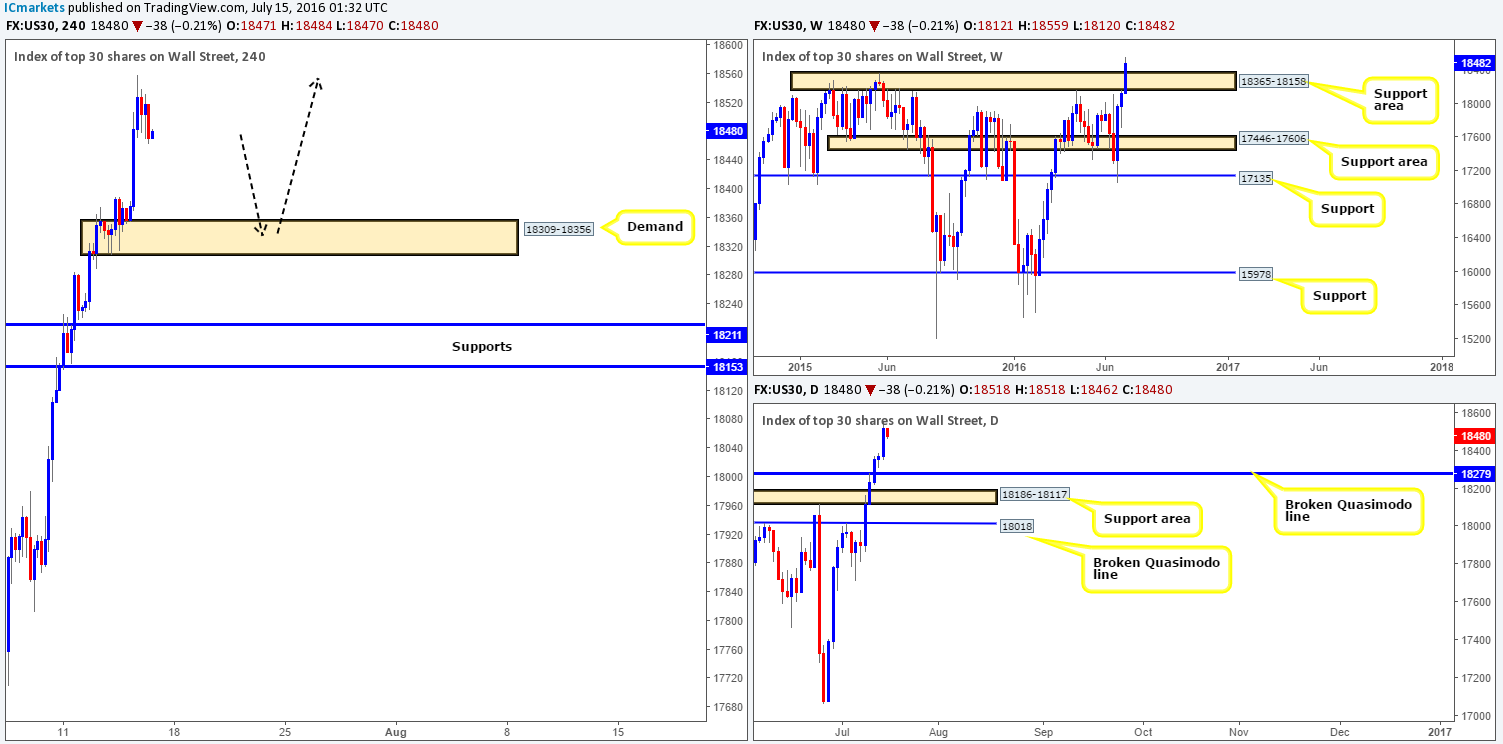
DOW 30:
The US stock market rallied for a fifth consecutive day yesterday, consequently recording an all-time high at 18559. Yesterday’s buying was boosted by a string of better than expected US data, which included the PPI report m/m, unemployment insurance claims and core PPI.
As far as we’re concerned, there is very little that suggests selling this market at this time. That being the case, our team will look to ‘buy the dips’ in this market until price action suggests otherwise. Our first port of call will be the H4 demand zone coming in at 18309-18356. This base is housed nicely within the recently broken weekly resistance area at 18365-18158 (now an acting support area), and sits just above a broken daily Quasimodo level at 18279.
Our suggestions: Watch for a lower timeframe buy entry from the H4 demand area mentioned above at 18309-18356. The reason for requiring extra confirmation here simply comes down to the possibility that price may fake beyond the aforementioned H4 demand into the broken daily Quasimodo line. For those who struggle to find reliable setups on the lower timeframes, please see the top of this report for a list of techniques we regularly use.
Levels to watch/live orders:
- Buys: 18309-18356 [Tentative – confirmation required] (Stop loss: dependent on where one confirms this area).
- Sells: Flat (Stop loss: N/A).
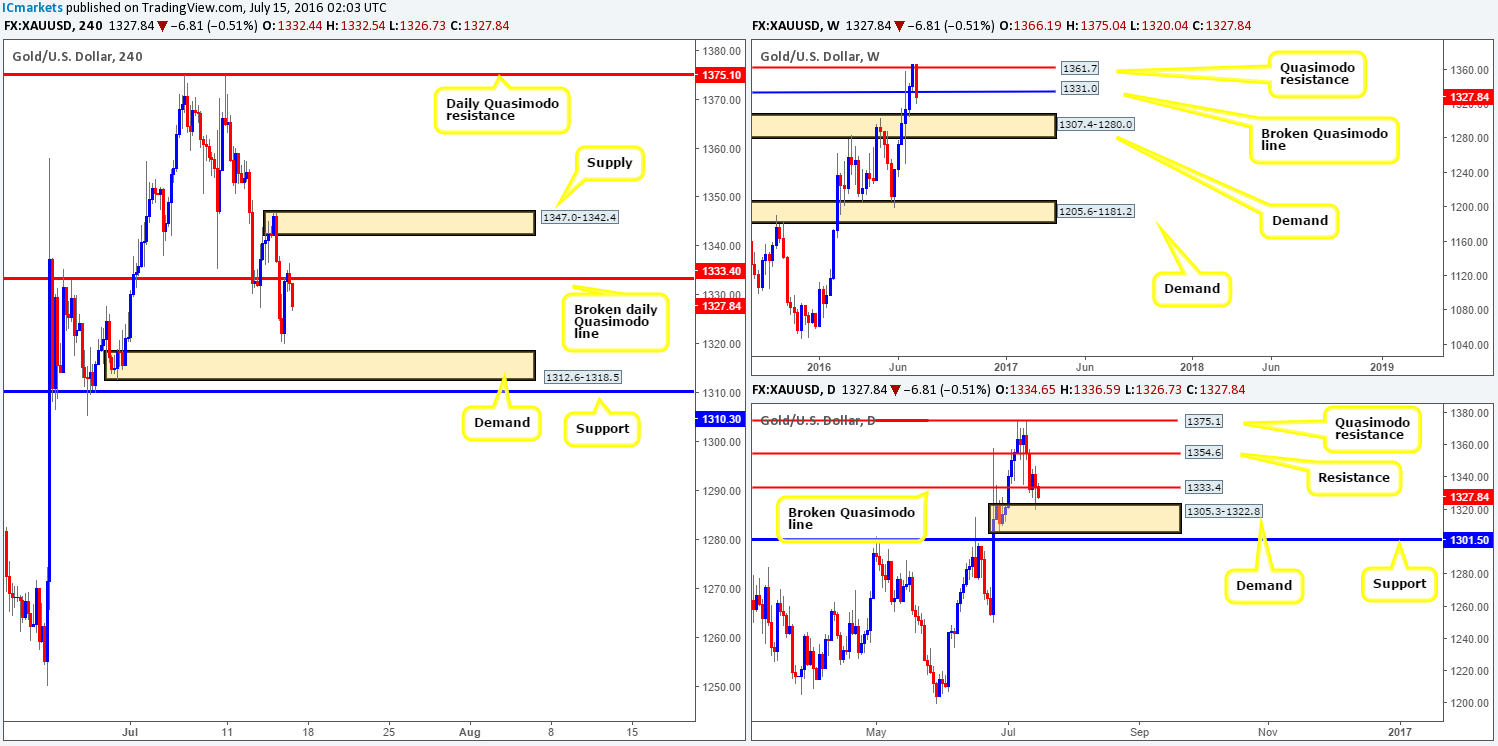
Gold:
Investors are seen dumping the safe-haven metal given the gains being posted over in the equity markets at the moment. Gold is on course to record its first weekly loss in over six weeks, as price is aggressively selling off from a weekly Quasimodo resistance level at 1361.7. The next downside target from here: the weekly broken Quasimodo line at 1331.0 is currently under pressure, which may indicate further selling could be on the cards today/next week.
On the other side of the field, however, the metal is seen trading from a daily demand area seen at 1305.3-1322.8 that sits on top of a weekly demand area at 1307.4-1280.0 (essentially the next downside target on the weekly timeframe beyond the current weekly broken Quasimodo line).
From the H4 chart, one can actually see the yellow metal retesting the underside of the recently broken daily Quasimodo line at 1333.4, which could be enough to take out yesterday’s low 1320.0 and tag in H4 demand at 1312.6-1318.5 (located within the daily demand zone mentioned above at 1305.3-1322.8).
Our suggestions: In that daily action has already connected with daily demand at 1305.3-1322.8, selling this market is risky in our opinion, since this could help weekly price rotate and respect the broken weekly Quasimodo line at 1331.0 by the week’s end. Therefore, opting to stand on the sidelines here may be the best path to take today.
Levels to watch/live orders:
- Buys: Flat (Stop loss: N/A).
- Sells: Flat (Stop loss: N/A).


