
Key risk events today:
US Retail Sales m/m.
(Previous analysis as well as outside sources – italics).
EUR/USD:
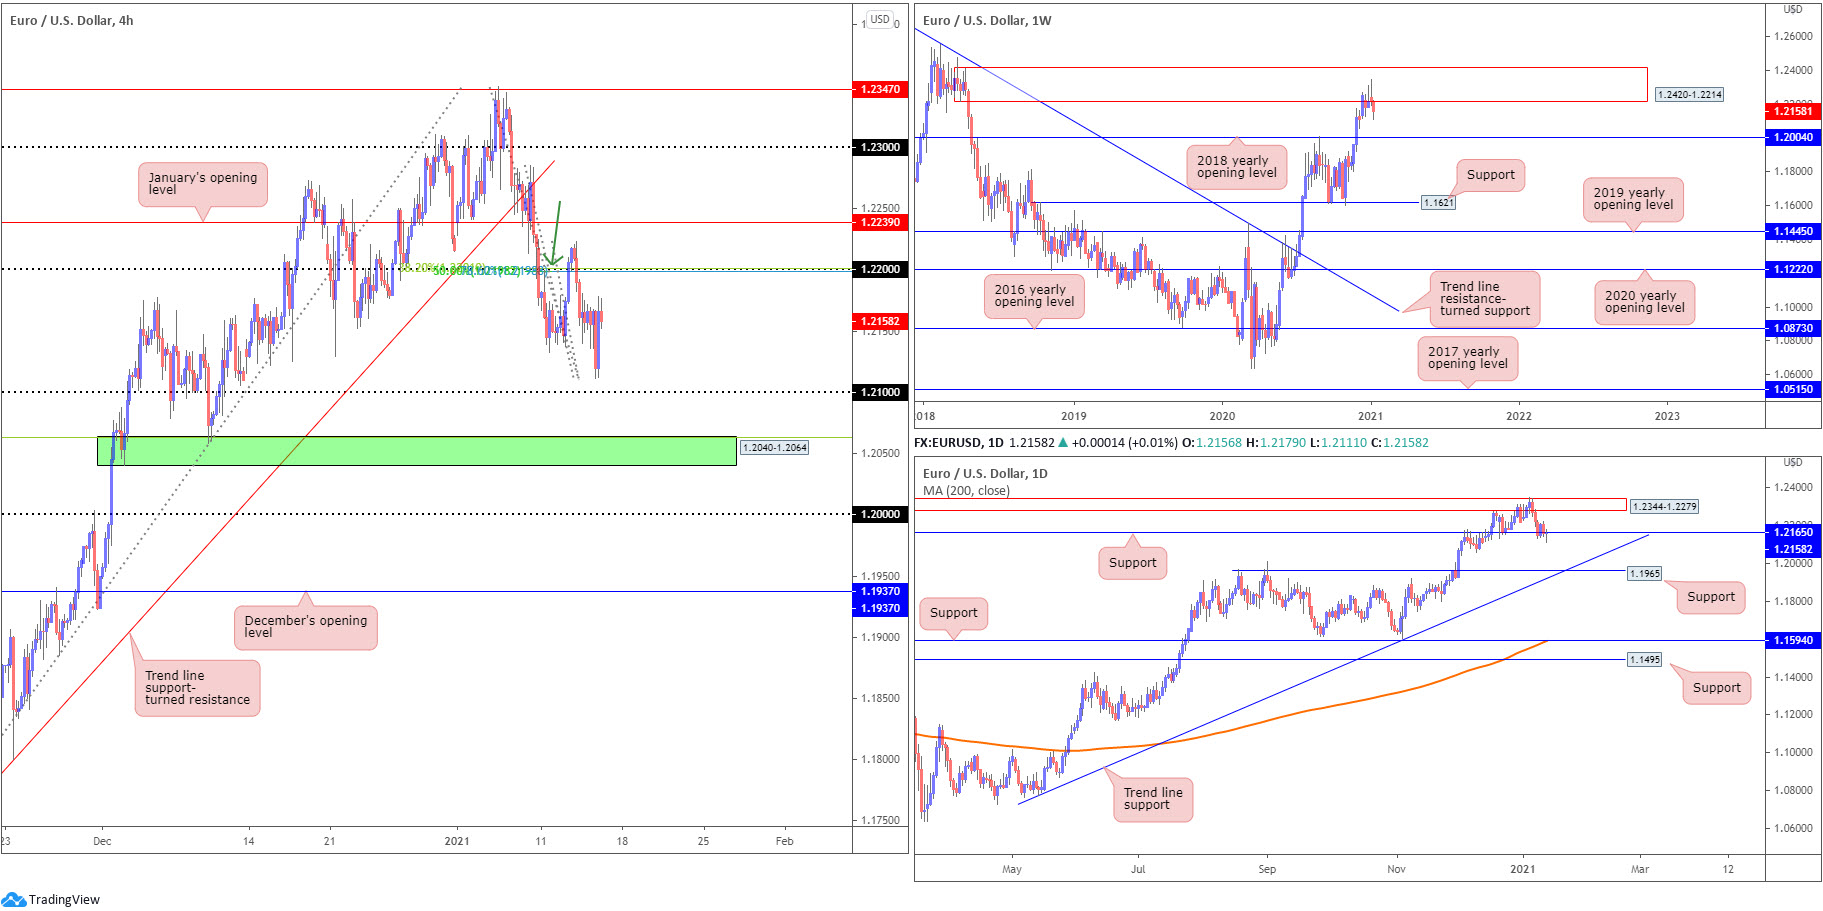
Europe’s single currency concluded European trading off worst levels against the US dollar Thursday, following a spike to lows at 1.2111.
To the upside (H4), possible resistance could shape at 1.22, bolstered by a collection of Fibonacci retracement levels and a Quasimodo resistance left shoulder (green arrow). Above, traders may also attempt to invade January’s opening value at 1.2239. With respect to support, the pair could mount an attack on the 1.21 figure should sellers take control, with a break exposing demand (green) at 1.2040-1.2064 and a 38.2% Fibonacci retracement ratio at 1.2062 (green line).
Further afield, the weekly timeframe has supply in focus at 1.2420-1.2214. Should sellers take the reins, the 2018 yearly opening value at 1.2004 is likely a level downside movement may target. In terms of trend, however, upside remains favoured – more so if price overthrows the 1.2555 February 12 high (2018). The above implies buyers could take the wheel and eventually attempt to overthrow the aforementioned supply zone.
Technical structure on the daily timeframe remains around support priced in at 1.2165, following a dominant rejection from supply at 1.2344-1.2279 (nestled within the walls of weekly supply mentioned above at 1.2420-1.2214). A break of support not only lays the basis for further selling to support at 1.1965 (and trend line support, taken from the low 1.0774), a bearish move would also add conviction to the weekly timeframe’s supply.
Areas of consideration:
- Longer term, although the trend has faced an upward trajectory since early 2020, weekly price displays signs of weakness within supply at 1.2420-1.2214.
- 22 – bolstered by H4 Fibonacci confluence and a Quasimodo resistance.
- Daily support at 1.2165 appears to be hampering a 1.21 test on the H4.
GBP/USD:
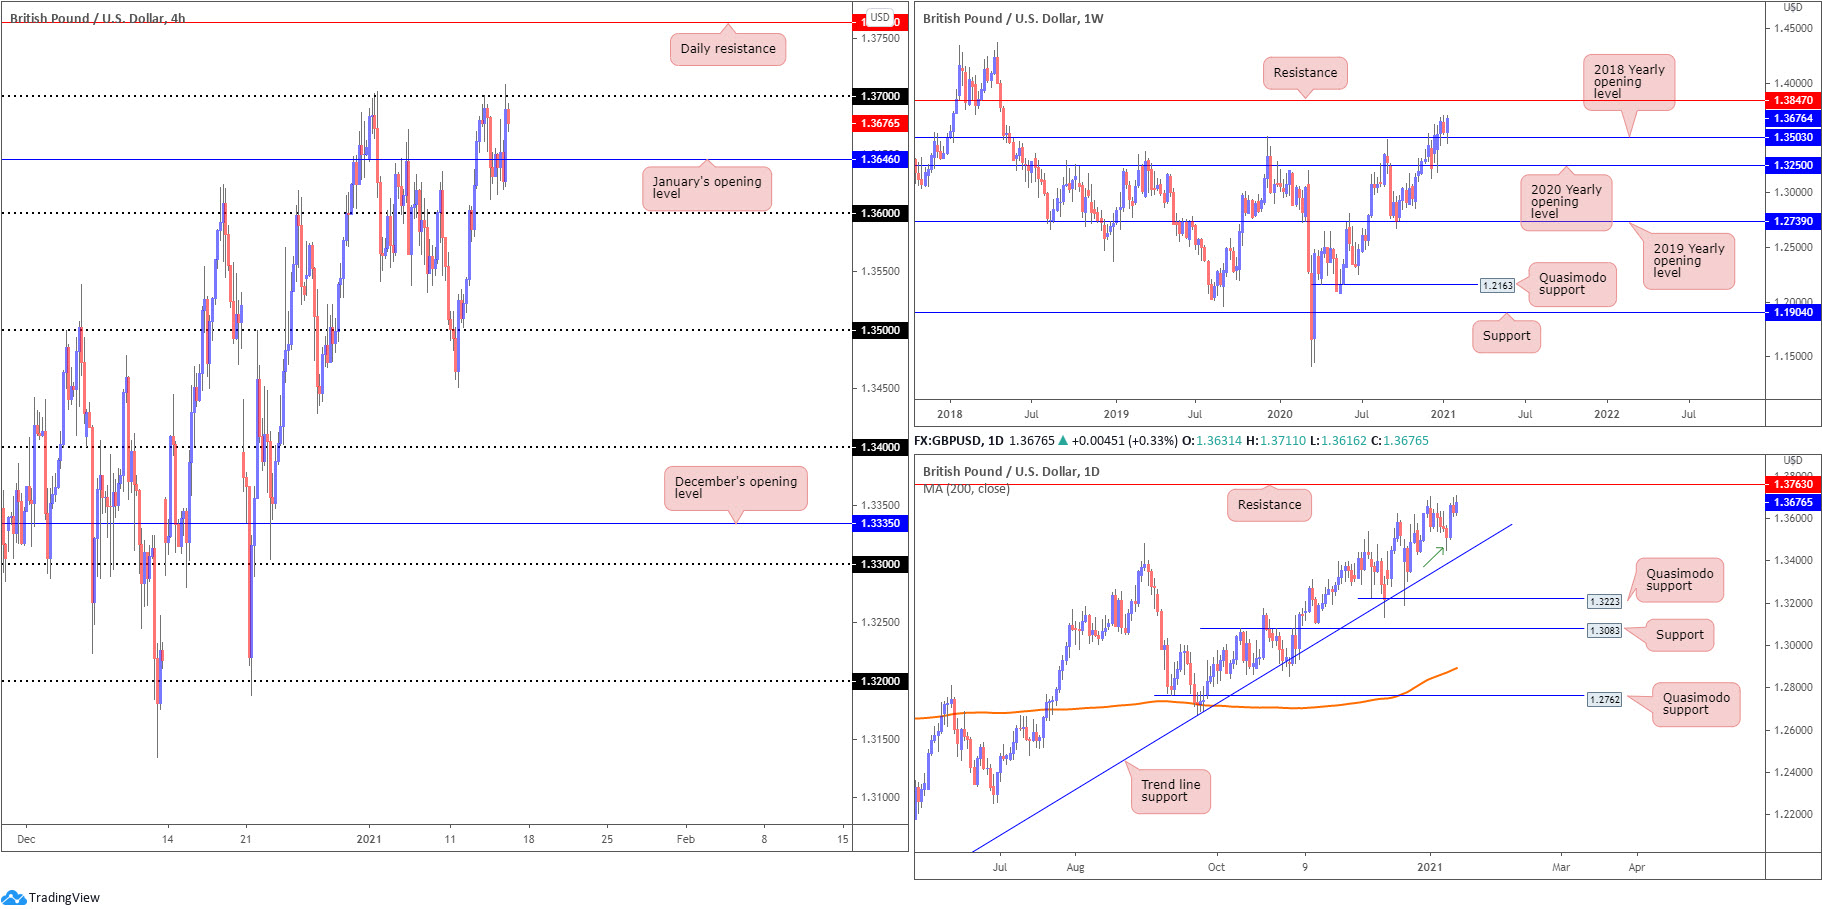
Sterling continues to outperform the US dollar.
Thursday conquered January’s opening value from 1.3646 and shook hands with the 1.37 figure. Although the latter held in recent hours, upside pressure derived from weekly support at 1.3503 (the 2018 yearly opening value) is likely to force moves over 1.37. The weekly timeframe’s next upside target is seen at resistance from 1.3847.
What’s also technically important to take on board is the daily timeframe demonstrates scope to climb further, at least until crossing paths with resistance at 1.3763. This follows Tuesday’s bullish pivot swing point (green arrow) printed ahead of trend line support, etched from the low 1.1409.
Areas of consideration:
- Weekly support at 1.3503 holding, in a market trending higher, places long-term buyers in a favourable position.
- A retest at January’s opening value from 1.3646 (H4) could spark buying.
- A breakout above 1.37 may prompt a bullish theme, targeting daily resistance at 1.3763. Conservative breakout strategies, however, may call for at least a 1.37 retest before pulling the trigger.
AUD/USD:
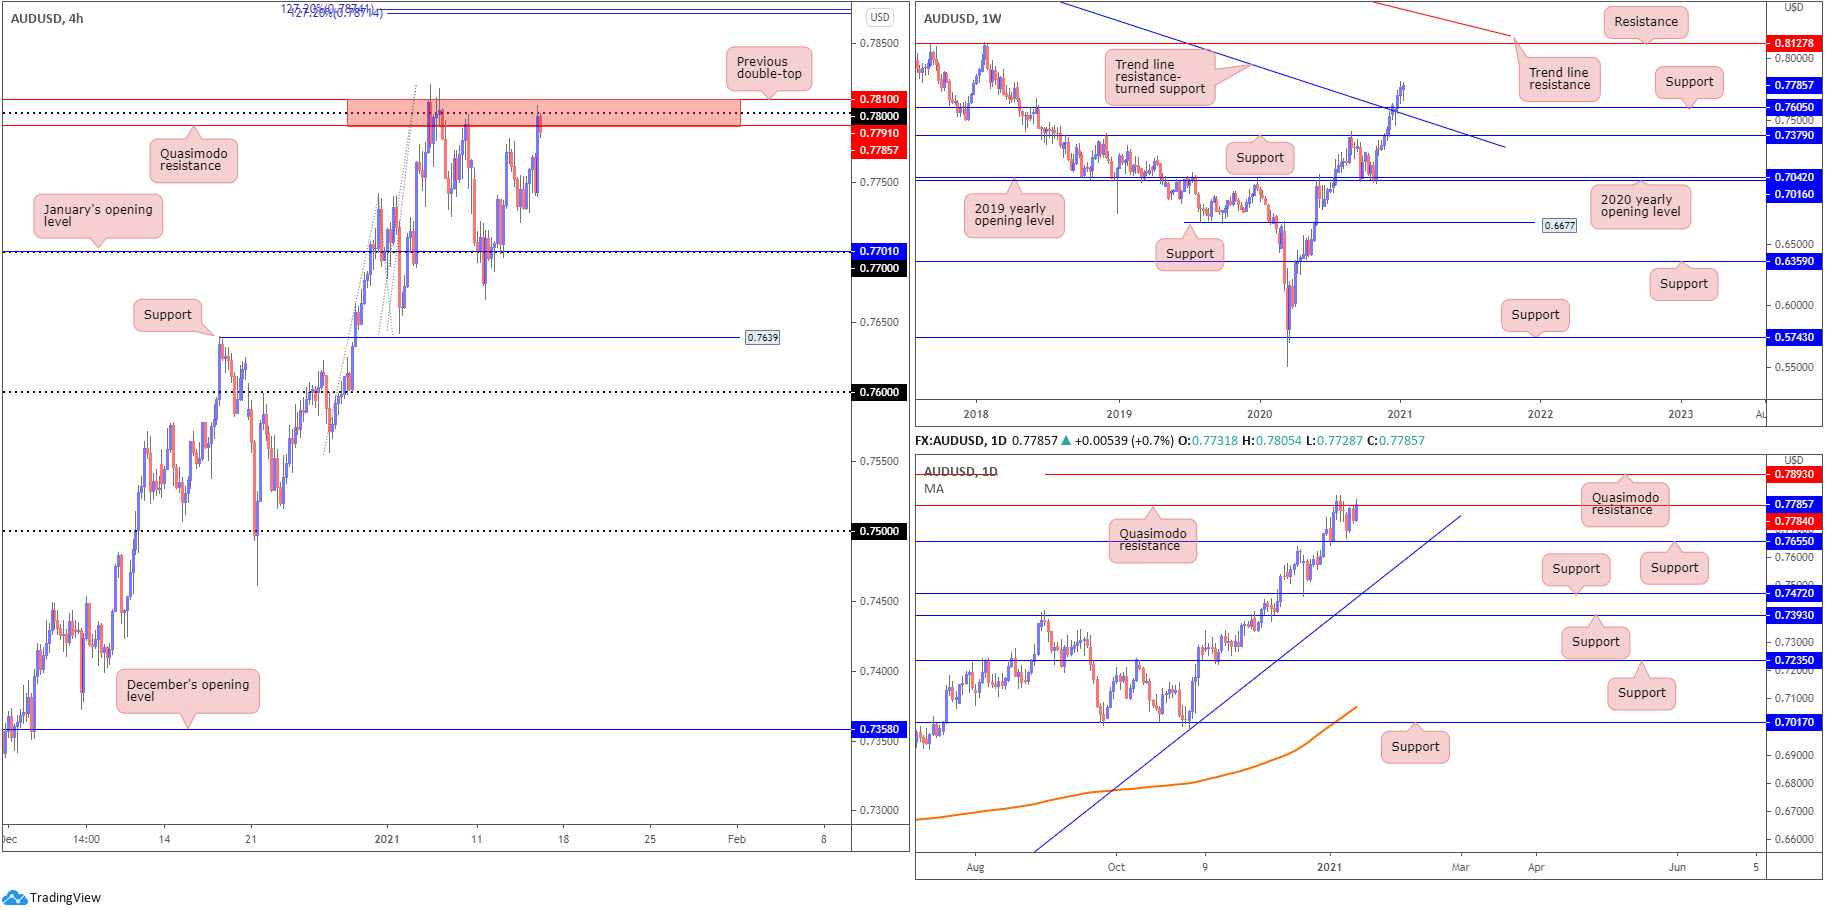
The Australian dollar, as evident from the weekly timeframe, has been trending higher since March of 2020. In conjunction with the overall trend, the weekly chart also points to further buying until we reach resistance coming in at 0.8127. In the event a correction takes shape, support at 0.7605 (a previous Quasimodo resistance) and merging trend line resistance-turned support, taken from the high 1.1065, could see action.
This places a question mark on daily Quasimodo resistance at 0.7784, along with H4 resistance at 0.7810/0.7791 (red), an area formed from a previous double-top pattern, a Quasimodo resistance and the 0.78 figure. Note the recent reaction from the aforementioned daily resistance also failed to reach support at 0.7655, implying strength to the upside.
Areas of consideration:
- Any correction formed from H4 resistance at 7810/0.7791, according to chart structure, is unlikely to be anything to write home about.
- Weak daily resistance at 0.7784, coupled with a strong underlying trend, could lift AUD/USD above 0.78 today, targeting a Fibonacci projection area at around 0.7873 on the H4, followed by daily Quasimodo resistance parked at 0.7893.
USD/JPY:
Following on from Thursday’s analysis, research noted the following from the weekly timeframe (italics):
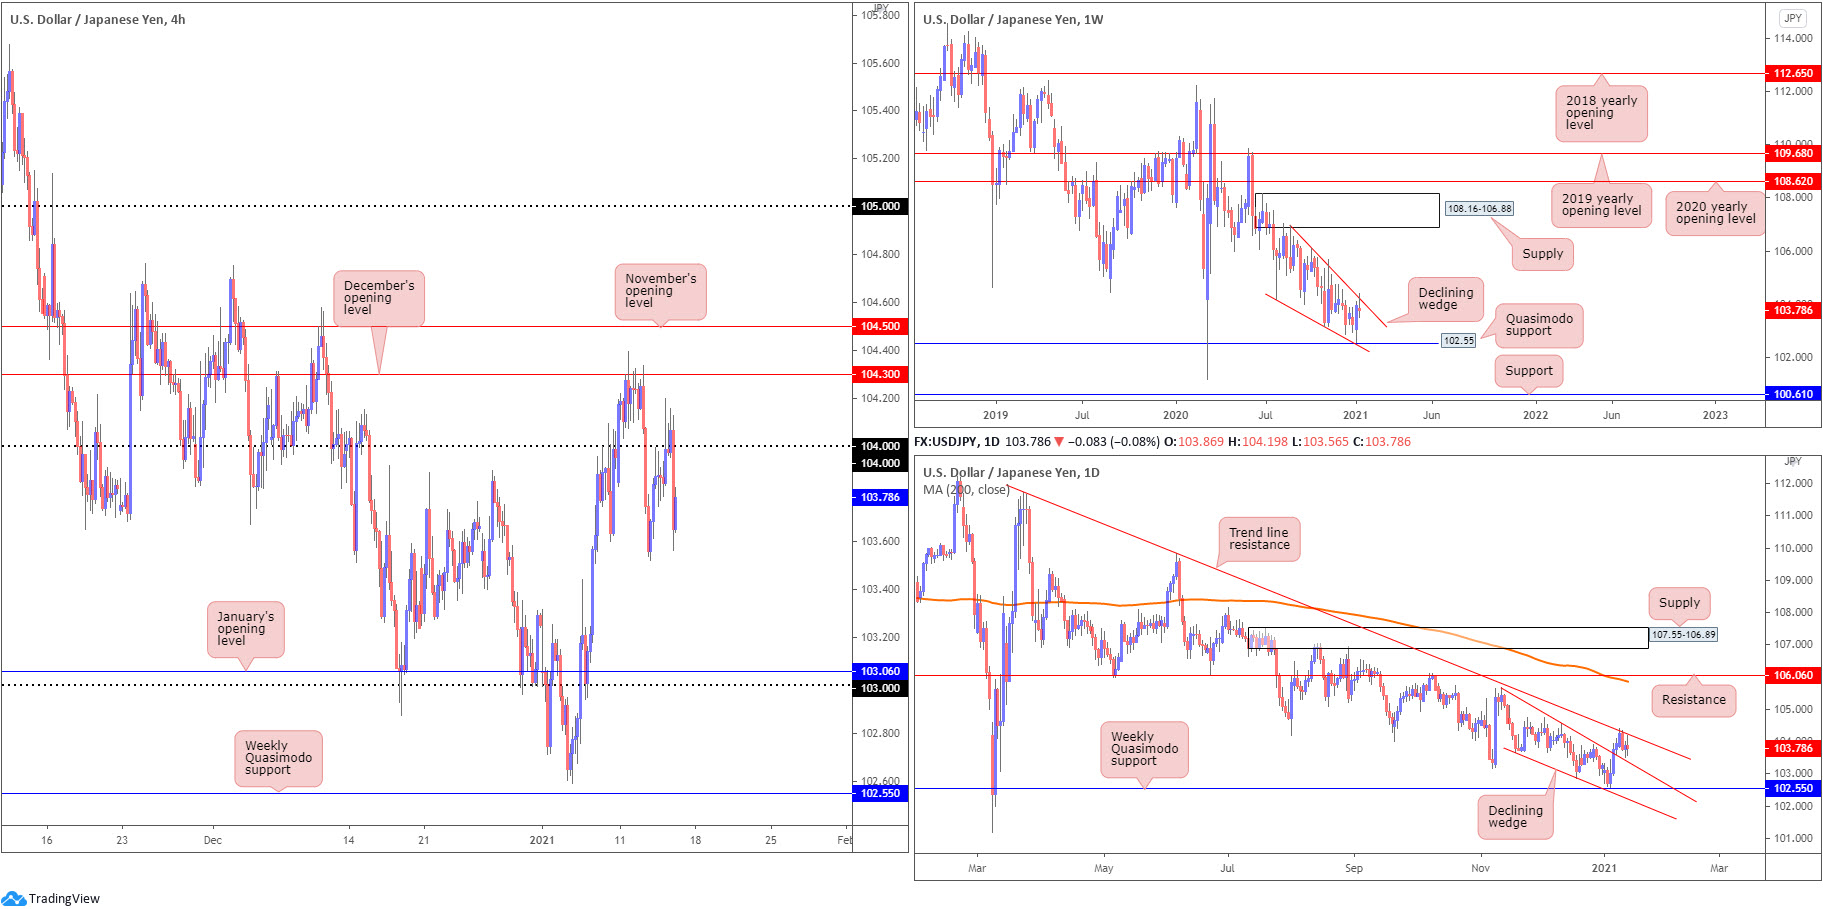
Top-down analysis reveals weekly price recently shook hands with the upper edge of a declining wedge pattern, taken from the high 106.94. With room to press lower, this may see traders zone in on Quasimodo support at 102.55.
The daily timeframe’s technical structure also remains pretty much unchanged, with Thursday establishing an indecision candle (italics):
Action out of the daily timeframe also recently had price cross swords with trend line resistance, extended from the high 111.71. Downside support resides around the upper boundary of a recently penetrated declining wedge, taken from the high 105.67.
Out of the H4 chart, Thursday’s technical research suggested a possible 104 retest could be in store, in view of the room to move lower on the bigger picture. A 104 retest did occur, though tested peaks at around 104.20 before the round number held ground. This mild fakeout perhaps caught a lot of traders off guard.
Areas of consideration:
- 104 holding delivers a bearish vibe as we head into Friday.
- Breaching Wednesday’s low at 103.52 (seen on the H4) may induce further selling, targeting the upper boundary of the penetrated declining wedge on the daily timeframe, followed by January’s opening value at 103.06 and the 103 figure (H4).
USD/CAD:
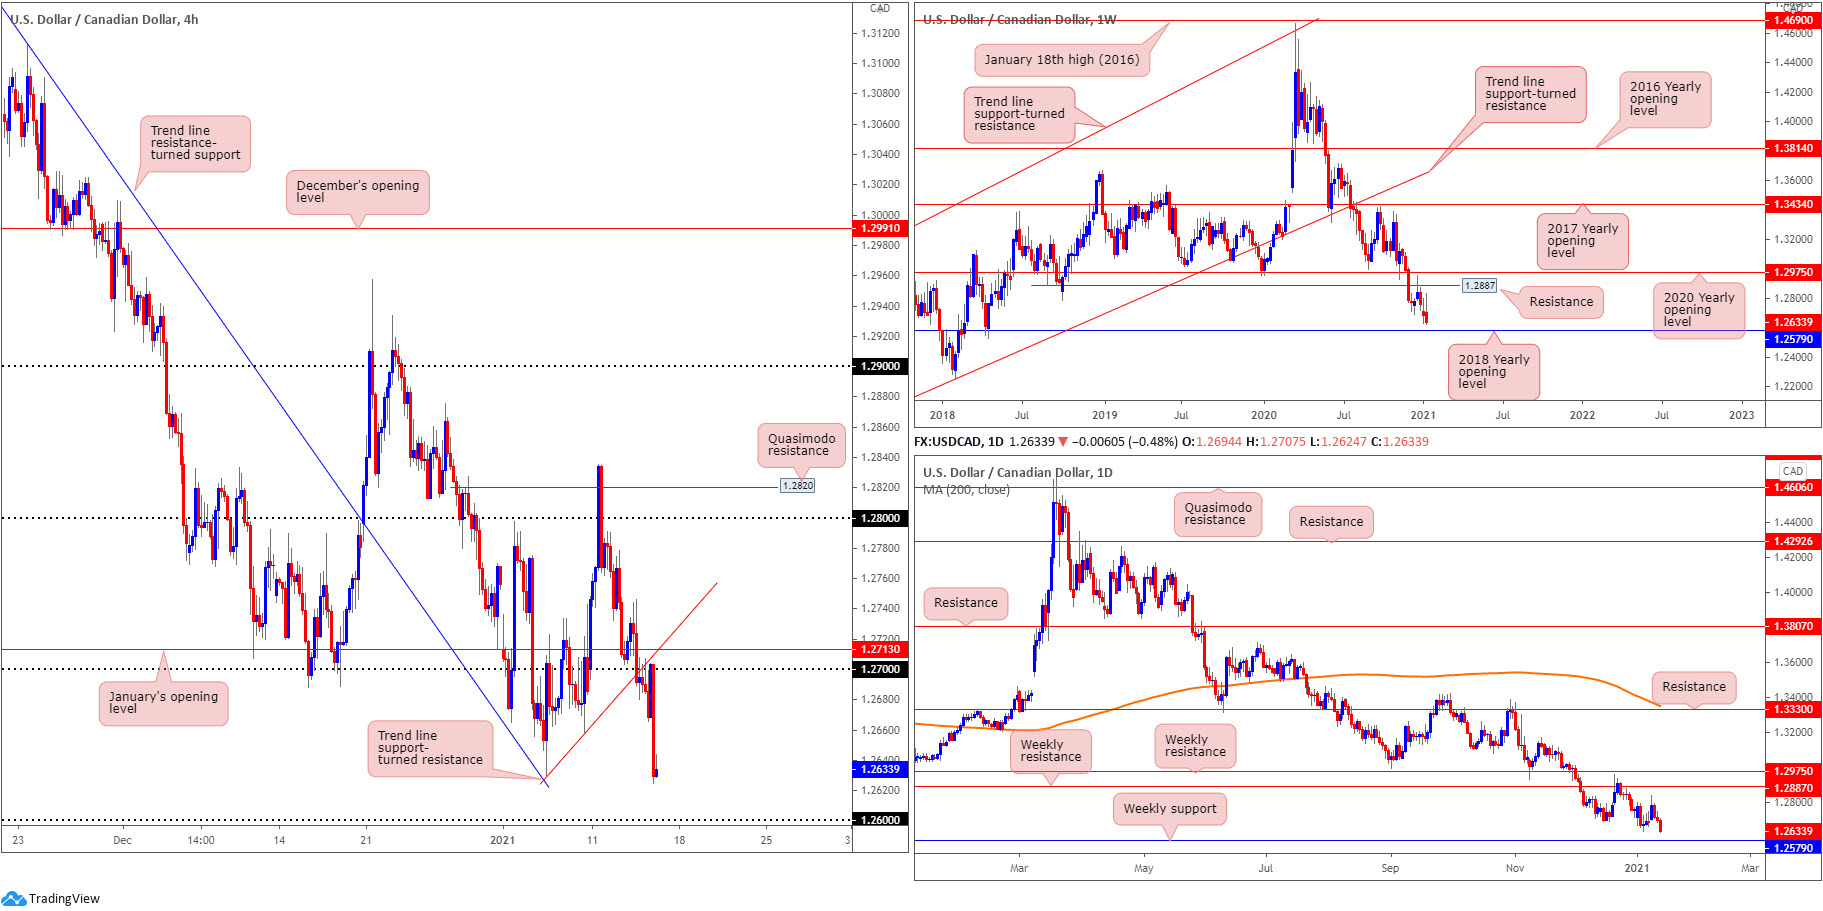
For those who read Thursday’s technical briefing you may recall the following research based on the H4 timeframe (italics):
January’s opening value from 1.2713 served as support in early trading Wednesday, though struggled to overcome 1.2730. This led to the 1.27 figure and associated trend line support, taken from the multi-month low 1.2630, suffering a breach in recent hours.
With the above on board, and H4 currently retesting the underside of 1.27 (and trendline support-turned resistance), a bearish scenario could form to target 1.2630, as well as the 1.26 figure (H4) and weekly support at 1.2579 (the 2018 yearly opening value).
As evident from the H4 chart this morning, price did indeed hold the 1.27 retest and is, at the time of writing, engaging with the multi-month lows at 1.2630.
Areas of consideration:
- Sellers short the retest at 1.27 have likely reduced risk to breakeven and liquidated partial profits at 1.2630.
- Beyond 1.2630, as highlighted above, support targets in view are the 1.26 figure and the 2018 yearly opening value on the weekly timeframe at 1.2579.
USD/CHF:
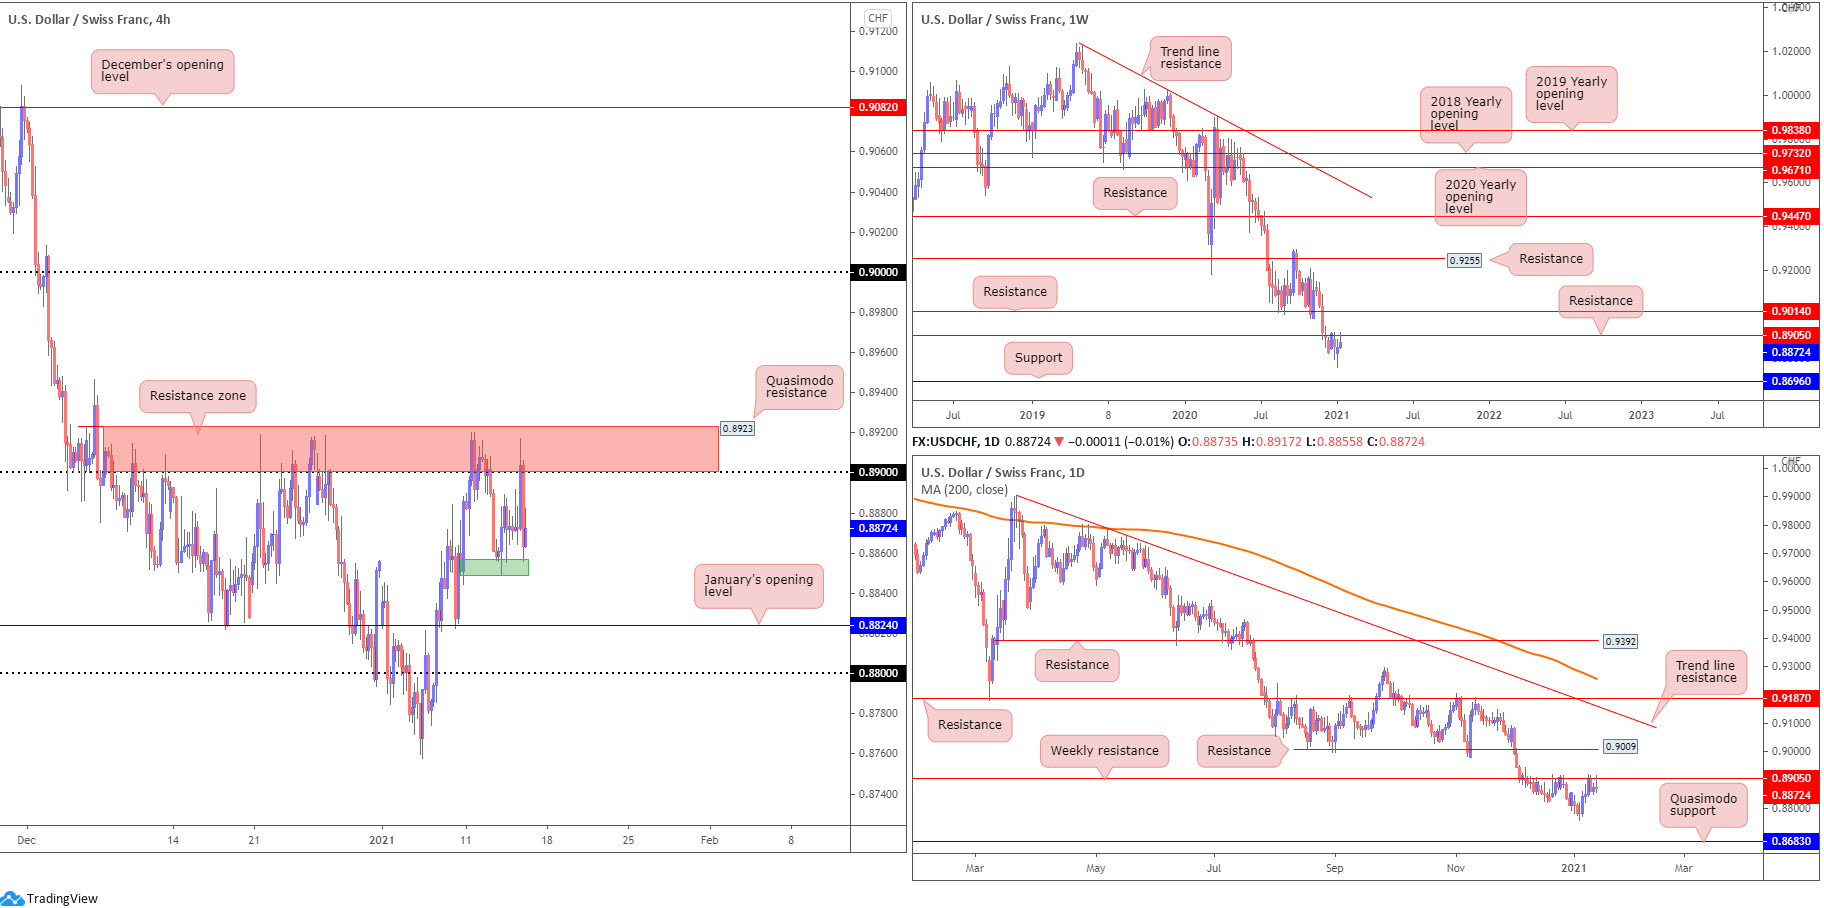
H4 resistance marked between 0.8923 (Quasimodo resistance) and the 0.89 figure (red zone), as you can see, has capped upside since early December, and did so again on Thursday. North of the zone, room to approach the key figure 0.90 is seen, while any bearish move from 0.8923-0.89 targets January’s opening value from 0.8824 and possibly the 0.88 figure.
Meanwhile, higher timeframe price action is retesting the lower edge of resistance at 0.8905, a level conveniently converging with the aforementioned H4 resistance zone.
Areas of consideration:
- Having seen all three timeframes (H4, daily and weekly) respect resistance, in a market trending lower since April 2019, sellers could remain at the wheel today.
- Sellers short the H4 resistance at 0.8923-0.89 are likely watching 0.8850 on the H4. Brushing aside this angle shines the spotlight on January’s opening value at 0.8824 as the next downside target, with follow-through momentum to highlight 0.88.
Dow Jones Industrial Average:
Major US equity benchmarks concluded Thursday on the backfoot as investors digested the recent surge in US unemployment claims. The Dow Jones Industrial Average fell 68.95 points, or 0.22%; the S&P 500 dropped 14.30 points, or 0.38% and the Nasdaq declined 16.31 points, or 0.12%.
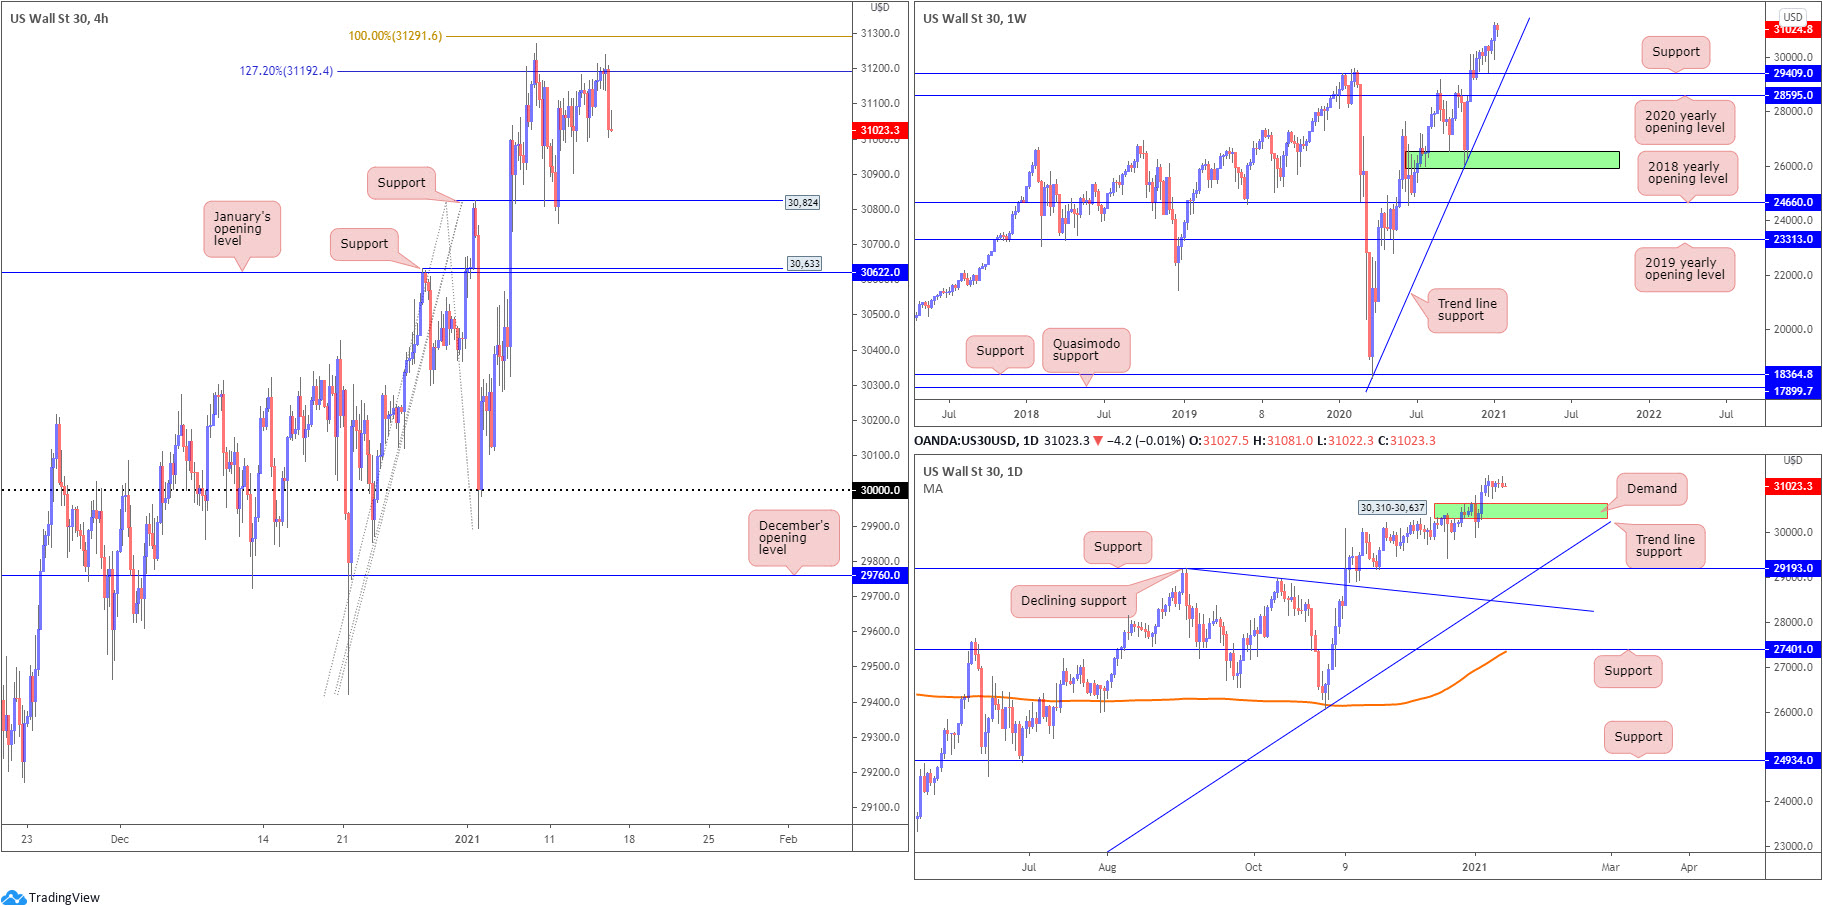
The technical picture on the H4 timeframe has price movement rejecting Fibonacci resistance (127.2% Fibonacci projection point at 31,192/100% Fibonacci extension level at 31,291). Support from here is seen priced in around 30,824 (swing high), followed by support residing at 30,633, a previous Quasimodo resistance level that blends with January’s opening value at 30,622.
From the weekly timeframe, the DJIA clearly continues to circle all-time peaks at 31,271. Should a correction occur, limited support is in sight until trend line support, extended from the low 18,213, and 29,409 (previous Quasimodo resistance). A closer reading of price action on the daily timeframe shows the unit has put forward an indecisive tone since the beginning of the week. If a correction does eventually come to pass, demand is seen at 30,310-30,637.
Areas of consideration:
Areas unchanged due to lacklustre movement.
- H4 support at 30,824.
- H4 resistance (Fibonacci) between 31,192/31,291.
- H4 support at 30,633 and January’s opening value at 30,622, an area plotted within the upper range of daily demand at 30,310-30,637.
- A H4 breakout above 31,291 potentially fuels a bullish breakout theme to refresh all-time peaks.
XAU/USD (GOLD):
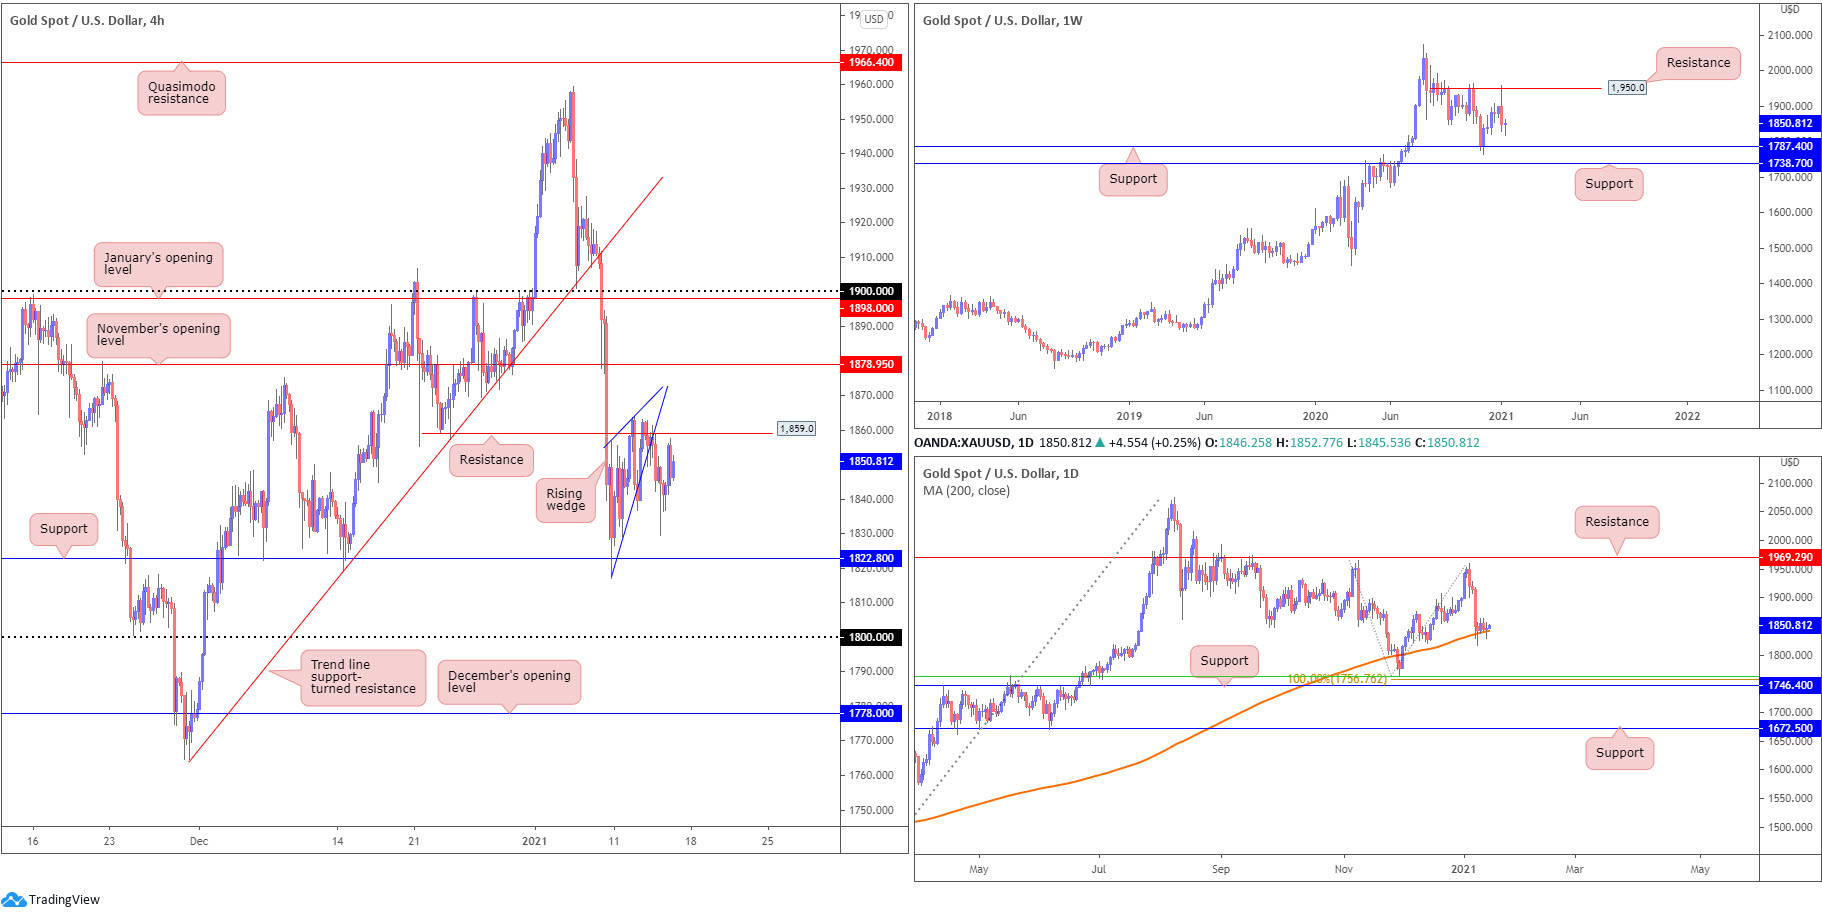
Following Wednesday’s break of the H4 rising wedge pattern ($1,817/$1,856), early trading voyaged to lows at $1,829 on Thursday. Despite the start, price recovered and concluded flat on the day. H4 resistance is pictured at $1,859, while above targets November’s opening value from $1,878. Lower on the curve, H4 support resides at $1,822.
Further out, the technical setting on the weekly timeframe shows price currently trades off worst levels. As noted in Thursday’s technical briefing, last week fell sharply from resistance at $1,950. This implies further selling could develop, aiming at support from $1,787, a level plotted just north of another layer of support at $1,738. Price action on the daily timeframe remains flirting with the 200-day SMA (orange – $1,842). Technically speaking, this is likely one of the factors behind the weekly timeframe’s reluctance to reach for support at $1,787.
Areas of consideration:
- The 200-day SMA support.
- Weekly support coming in at $1,787. Note this level resides between $1,800 and December’s opening value at $1,778 on the H4 scale.
- A breakout above H4 resistance at $1,859 stirs a possible breakout theme to November’s opening value from $1,878.
The accuracy, completeness and timeliness of the information contained on this site cannot be guaranteed. IC Markets does not warranty, guarantee or make any representations, or assume any liability regarding financial results based on the use of the information in the site.
News, views, opinions, recommendations and other information obtained from sources outside of www.icmarkets.com.au, used in this site are believed to be reliable, but we cannot guarantee their accuracy or completeness. All such information is subject to change at any time without notice. IC Markets assumes no responsibility for the content of any linked site.
The fact that such links may exist does not indicate approval or endorsement of any material contained on any linked site. IC Markets is not liable for any harm caused by the transmission, through accessing the services or information on this site, of a computer virus, or other computer code or programming device that might be used to access, delete, damage, disable, disrupt or otherwise impede in any manner, the operation of the site or of any user’s software, hardware, data or property.


