
EUR/USD:
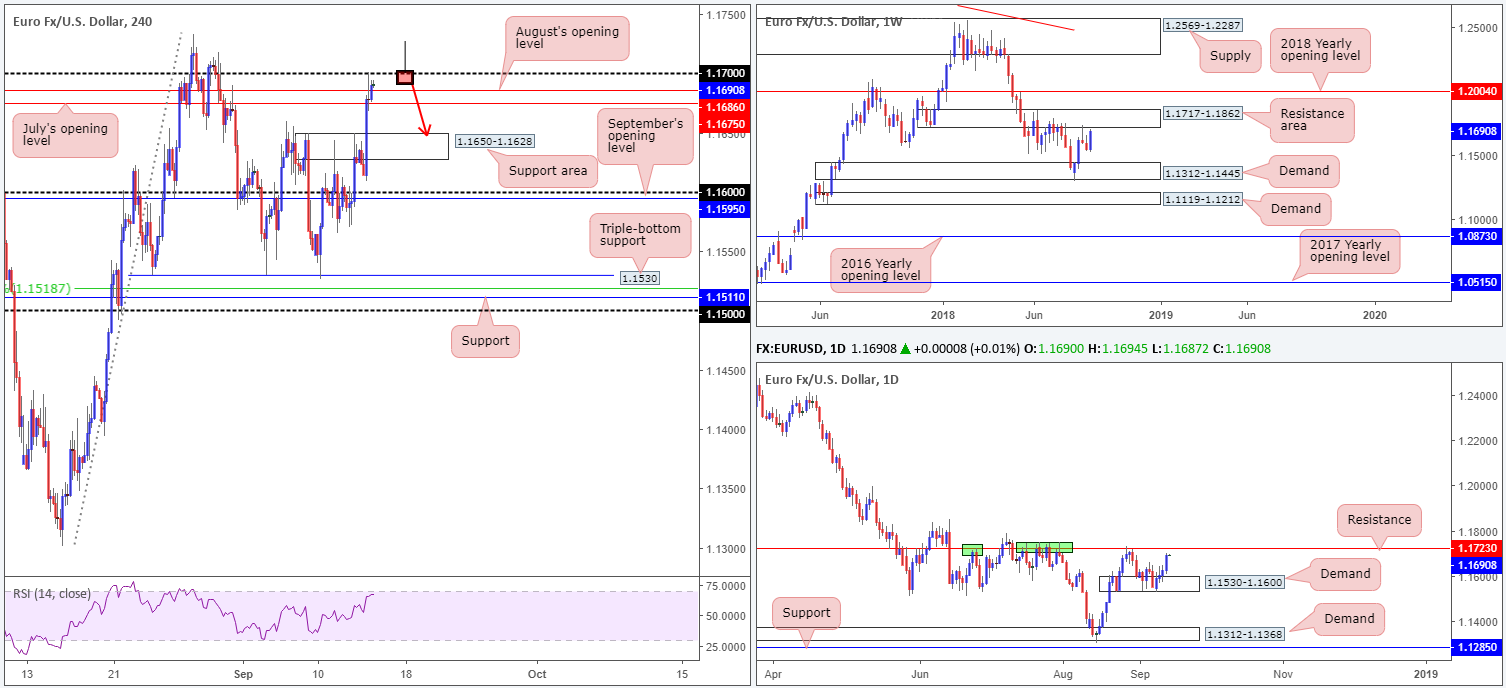
The shared currency advanced vs. a broadly deflated greenback on Thursday, following US CPI misses and the ECB monetary policy decision/press conference. The European Central Bank did not provide any significant change at its meeting as interest rates were kept unchanged, as expected.
This week has seen a consistent climb in this market so far, printing four consecutive daily bull candles. Despite this, upside momentum may enter a cooling period today as the daily candles close in on a resistance level drawn from 1.1723. Not only that, though, weekly flow is also seen nearing a resistance area penciled in at 1.1717-1.1862 (the current daily resistance is seen within the lower limits of this base), which, as you can see, held price lower in the months of May, June and July of this year.
A closer look at price action on the H4 timeframe has the pair fading the 1.17 handle, after eclipsing supply at 1.1650-1.1628, along with July and August’s opening levels at 1.1675/1.1686. Also worth noting is the RSI indicator is seen approaching overbought territory.
Areas of consideration:
With the euro trading nearby weekly, daily and H4 resistance, there’s a chance a correction to the downside may take shape.
Given the 1.17 handle is positioned a few pips beneath the underside of the weekly resistance area at 1.1717 and a daily resistance at 1.1723, a H4 bearish pin-bar formation that pierces through 1.17 and taps these two higher-timeframe barriers (see the H4 chart for a visual) would likely be sufficient enough evidence to prove seller intent (stop-loss orders can be positioned beyond the pin-bar’s wick), with an initial downside target set around the top edge of a H4 support area at 1.1650-1.1628.
Today’s data points: US retail sales m/m; US prelim UoM consumer sentiment.
GBP/USD:
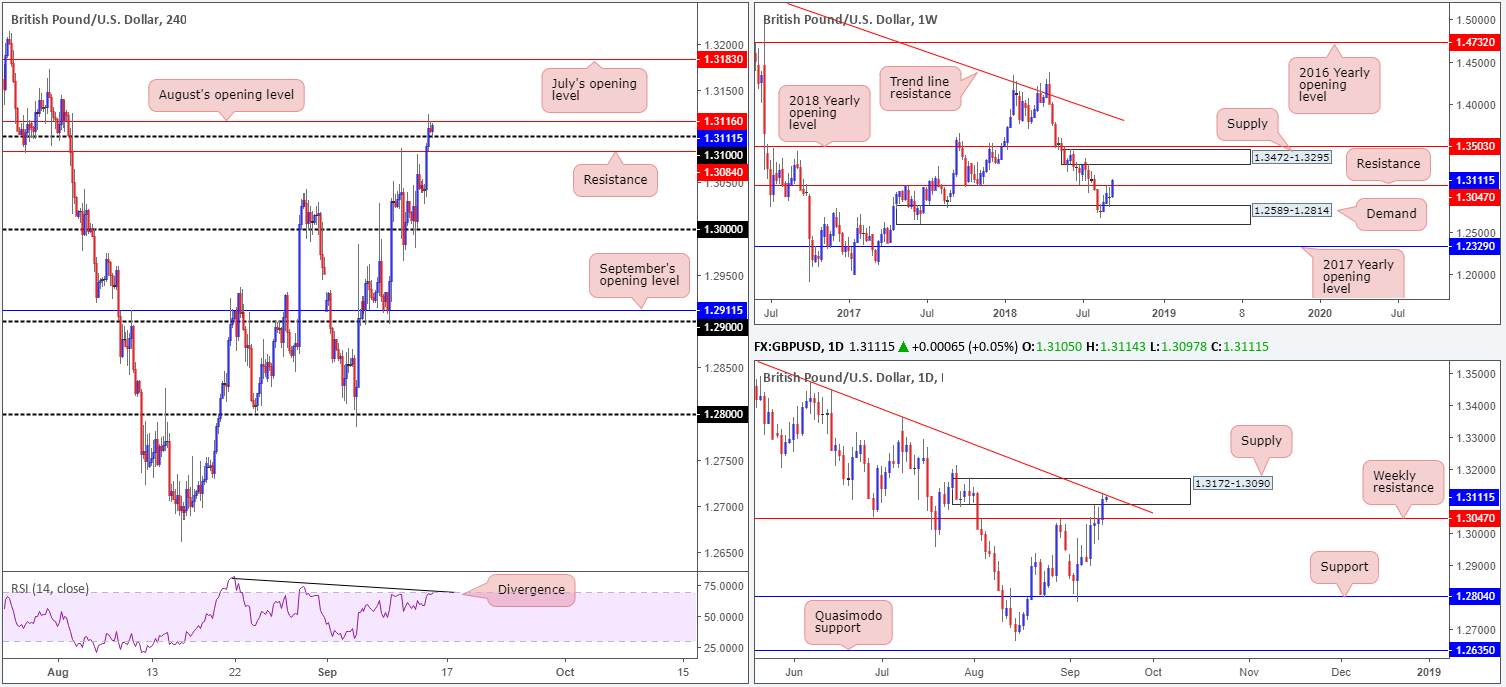
In similar fashion to the EUR/USD, the British pound advanced against its US counterpart on Thursday. A broadly weaker USD, largely on the back of US CPI misses, and positive Brexit news flow provided the pound a platform of support. Also worth penciling down is yesterday’s BoE rate decision came in as expected, with the Base Rate holding steady at 0.75%. Neither a dovish nor hawkish stance was seen from the central bank.
On the technical front, H4 price reclaimed 1.31+ status in recent trade, though is finding a ceiling of resistance off 1.3116: August’s opening level. It is also worth pointing out the RSI indicator remains printing an oversold/divergence reading.
On a wider perspective, weekly price is testing higher ground above resistance at 1.3047. Assuming further upside is observed, the next port of call is a supply zone seen printed at 1.3472-1.3295. Contrary to weekly movement, however, daily price is seen checking in with a supply zone marked at 1.3172-1.3090 that converges with a nearby trend line resistance (taken from the high 1.3472).
Areas of consideration:
With H4 price trading above its 1.31 hurdle, and weekly price indicating further buying could be in store, daily sellers may find it challenging to hold price lower from the daily supply zone mentioned above at 1.3172-1.3090. With that being said, though, it may be enough to force price to retest the recently broken weekly resistance as support.
Overall, neither a long nor short seems attractive today. Irrespective of the direction one selects there’s a number of competing themes on both sides of the market.
Today’s data points: BoE Gov. Carney speaks; US retail sales m/m; US prelim UoM consumer sentiment.
AUD/USD:
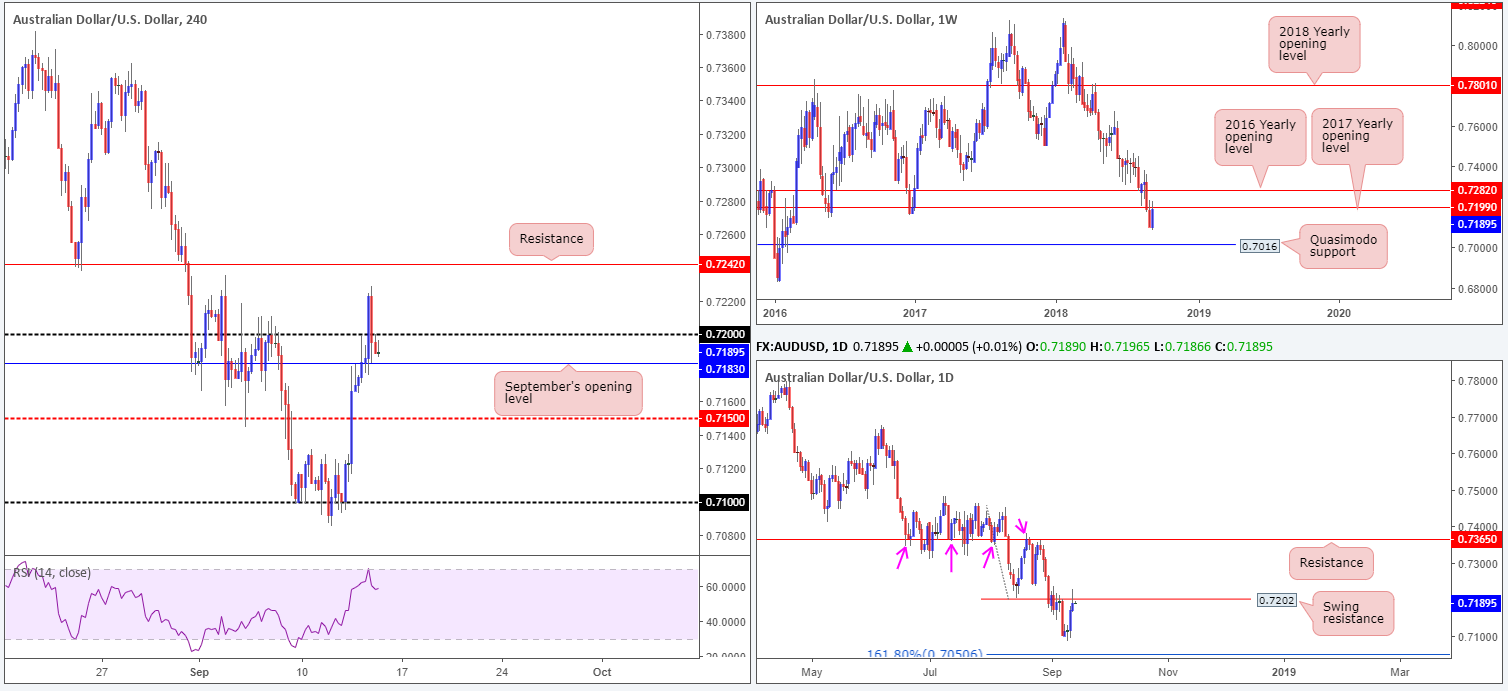
Buoyed by strong Australian labour figures during Asia, along with US CPI misses going into US hours, the AUD/USD reclaimed 0.72 status and reached highs of 0.7229 amid Thursday’s trade. Despite this, price action failed to sustain gains as higher-timeframe sellers entered the fray, forcing the unit back beneath 0.72 into the close. As you can see on the weekly timeframe price shook hands with 0.7199: the 2017 yearly opening level. In addition to this, a daily swing resistance at 0.7202 was also brought into the mix.
With such a strong ceiling of resistance overhead, it’s likely going to be a struggle for the buyers here.
Areas of consideration:
A H4 close beneath September’s opening level at 0.7183 would likely confirm bearish intent. This opens the path south to mid-level support at 0.7150 and maybe even a retest of the 0.71 handle. Higher-timeframe downside targets fall in at a weekly Quasimodo support drawn from 0.7016 and a 161.8% daily Fib support at 0.7050.
A H4 close sub 0.7183 that’s followed up with a retest as resistance could provide traders entry into this market for a short. Ideally, though, the smaller the stop loss the better since let’s remember price could potentially turn higher from 0.7150.
Today’s data points: China fixed asset investment ytd/y; China industrial production y/y; US retail sales m/m; US prelim UoM consumer sentiment.
USD/JPY:
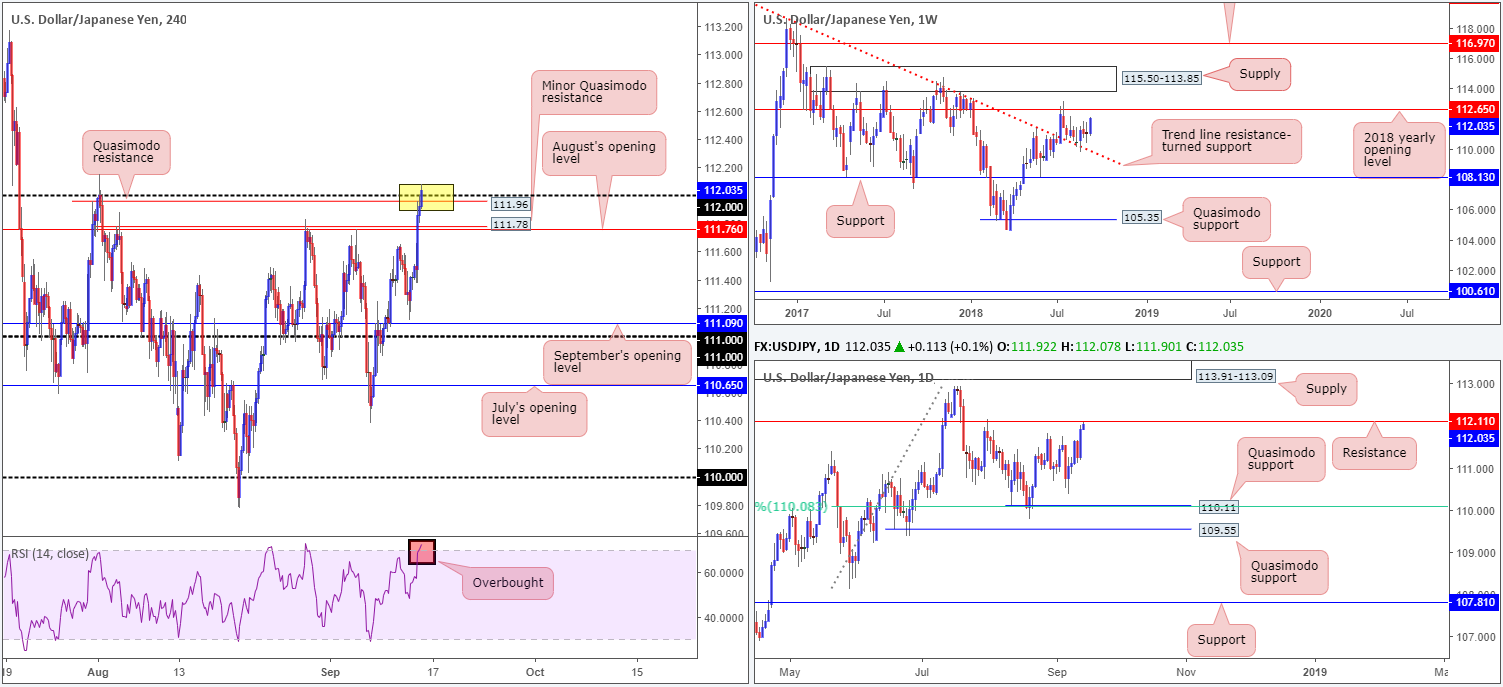
Alongside US equities, the USD/JPY put in a solid performance on Thursday. Despite US CPI misses, the pair held on to gains and concluded the day closing just south of the 112 handle on the H4 timeframe. In recent hours, however, price has gained 112 status, currently trading at around the 112.05 mark.
In Thursday’s report, the team highlighted the H4 Quasimodo resistance level at 111.96 as a worthy contender for possible shorts (yellow zone). Having seen daily resistance at 112.11 reinforcing the top edge of this Quasimodo formation, placing stop-loss orders above the Quasimodo apex at around 112.17ish is an option. At current price, stops are currently in a safe spot as price nears the noted daily resistance.
The only grumble to shorting the 112ish region was, of course, the weekly timeframe. Price action shows room to push as far north as the 2018 yearly opening level at 112.65.
Areas of consideration:
In the event the buyers remain defensive, stop-loss orders set above the H4 Quasimodo resistance apex will likely be tripped, as well as some of the stop-loss orders from sellers looking to fade the current daily resistance. On a more positive note, though, this also opens up a potential opportunity to trade long should the unit retest 112 as support in the shape of a H4 bullish candlestick formation. A move from here has the 2018 yearly opening level mentioned above at 112.65 to target.
Today’s data points: US retail sales m/m; US prelim UoM consumer sentiment.
USD/CAD:
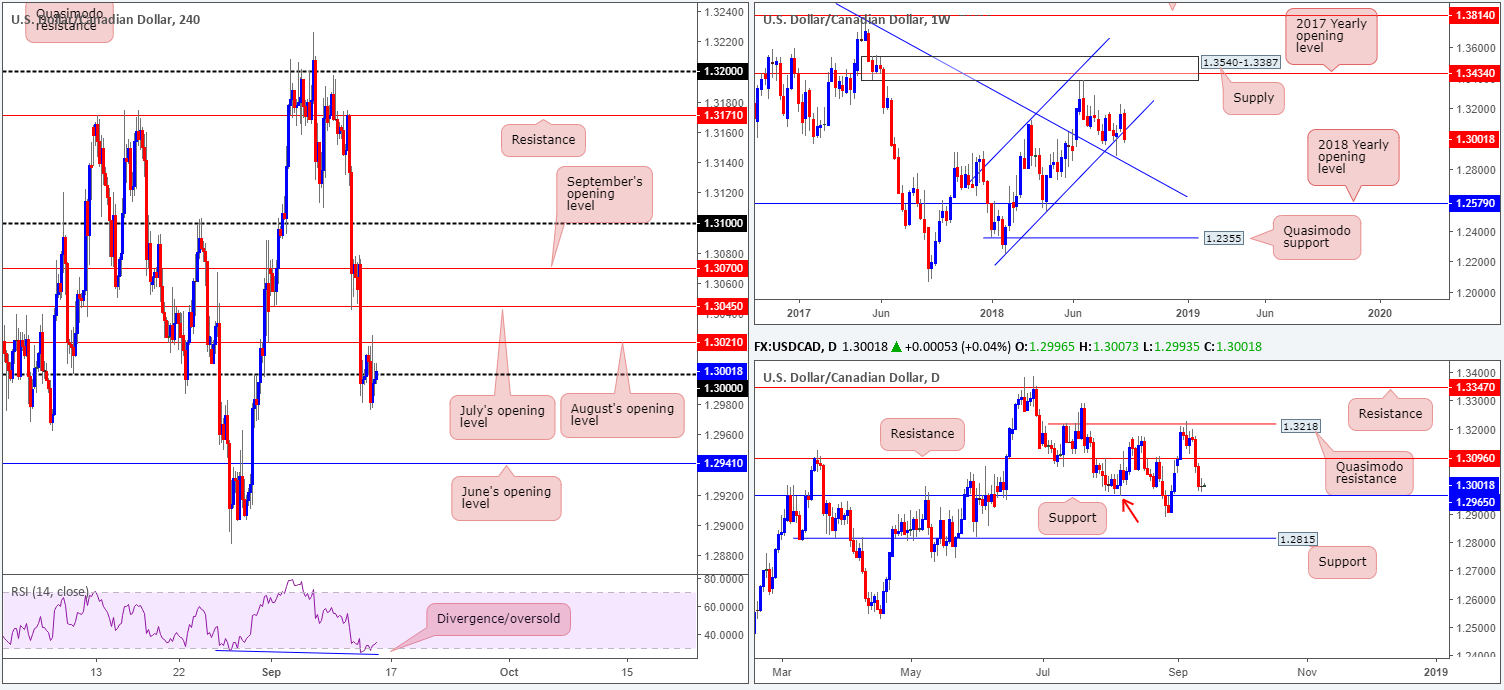
Thursday’s action entered a subdued state, following two back-to-back days of dominant selling. US CPI came in broadly lower against consensus, though failed to generate much action the downside with the pair shortly after reclaiming the 1.30 handle on the H4 timeframe. As of now, the buyers and sellers remain battling for position around the underside of 1.30, after the H4 candles found strong resistance from 1.3021: August’s opening level. In the event price defends 1.30 today, the next downside target on the H4 scale falls in at June’s opening level drawn from 1.2941. It might also be worth noting for traders who follow RSI movement, the indicator is currently printing an oversold/divergence reading.
In terms of the higher-timeframe picture, weekly price has engulfed its long-term channel support (etched from the low 1.2247), placing the spotlight on the trend line resistance-turned support (extended from the high 1.4689). Contrary to weekly price, daily movement engulfed a notable support at 1.3096 (now acting resistance) on Tuesday and remains hovering just north of support coming in at 1.2965 (happens to also represent a Quasimodo left shoulder support – red arrow).
Areas of consideration:
According to the higher-timeframe picture, shorts off the underside of 1.30 are good at least until we reach daily support at 1.2965. This level is shadowed closely by June’s opening level mentioned above on the H4 scale at 1.2941. Should traders observe a H4 bearish candlestick formation print around 1.30 today that closes in reasonably strong fashion, a sell on the back of this could be an idea. To be on the safe side, though, reducing risk to breakeven once/if price challenges the current daily support is recommended. Ultimately, however, you’d really want to see June’s opening level brought into the fray before covering some of the position.
Today’s data points: US retail sales m/m; US prelim UoM consumer sentiment.
USD/CHF:
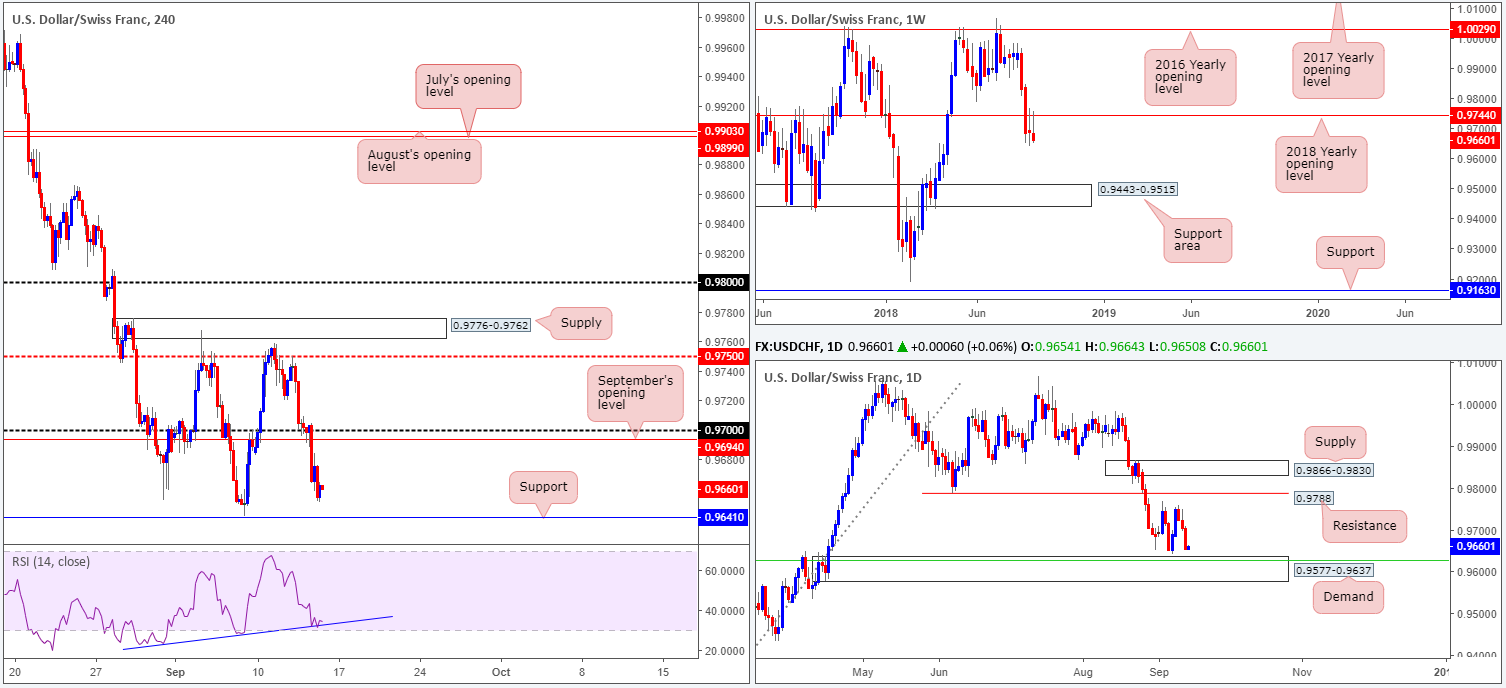
Disappointing US CPI data kept the US dollar on the losing side of the table on Thursday against its Swiss counterpart. The day witnessed the USD/CHF punch below the 0.97 handle and close within striking distance of H4 support plotted at 0.9641. What’s also notable from a technical perspective on the H4 scale is the RSI currently testing trend line support, positioned just ahead of its oversold value.
As is evident from the weekly timeframe, the USD/CHF is seen establishing solid ground off the underside of the 2018 yearly opening level at 0.9744. Continued downside from this point has the support area at 0.9443-0.9515 to target. Turning the focus over to the daily picture, however, shows demand positioned nearby at 0.9577-0.9637 that converges with a 50.0% support value at 0.9627 (green line).
Areas of consideration:
Although weekly activity is eyeing lower prices, the unit has to get through H4 support and daily demand first! With that being the case, a long from the current H4 support which stands at 0.9641 could be an option. Note this level is sited just a few pips north of the daily demand base mentioned above at 0.9577-0.9637. Given the threat of further selling coming out of the weekly timeframe, though, waiting for H4 price action to chalk up a bullish candlestick formation off 0.9641 is recommended. The initial upside target from here can be seen around September’s opening level at 0.9694.
Today’s data points: US retail sales m/m; US prelim UoM consumer sentiment.
Dow Jones Industrial Average:
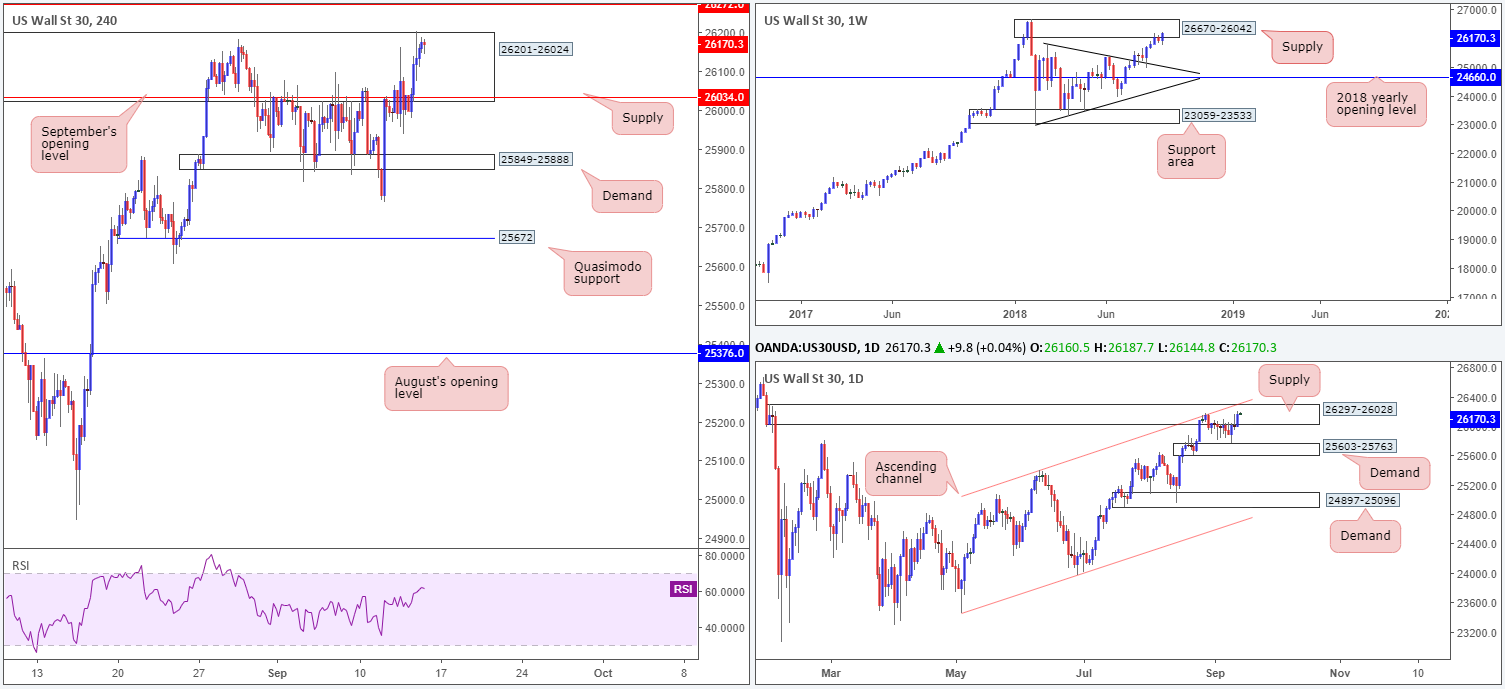
Market sentiment switched back to positive on Thursday, dragging the H4 candles deep within supply territory at 26201-26024. In fact, price mildly engulfed this area, though it’s difficult to judge whether it was enough to take out stop-loss orders or not. Should the H4 candles push for higher levels today, the next area of resistance can be seen nearby at 26272 (not seen on the screen).
From a higher-timeframe perspective, weekly supply at 26670-26042 remains intact, as does its partner supply on the daily timeframe at 26297-26028, which happens to converge with a nearby channel resistance (taken from the high 25399).
Areas of consideration:
In the event the H4 supply area fails to hold today, selling from the H4 resistance level mentioned above at 26272 is an option. While this does mean you’ll be selling into a trending market, do bear in mind that on the weekly and daily timeframes we have notable supply in play. To be on the safe side, nevertheless, traders could elect to wait and see if H4 price prints a bearish candlestick formation off 26272 before pulling the trigger. Although this will not guarantee a winning trade, it will show seller intent.
Today’s data points: US retail sales m/m; US prelim UoM consumer sentiment.
XAU/USD (Gold)
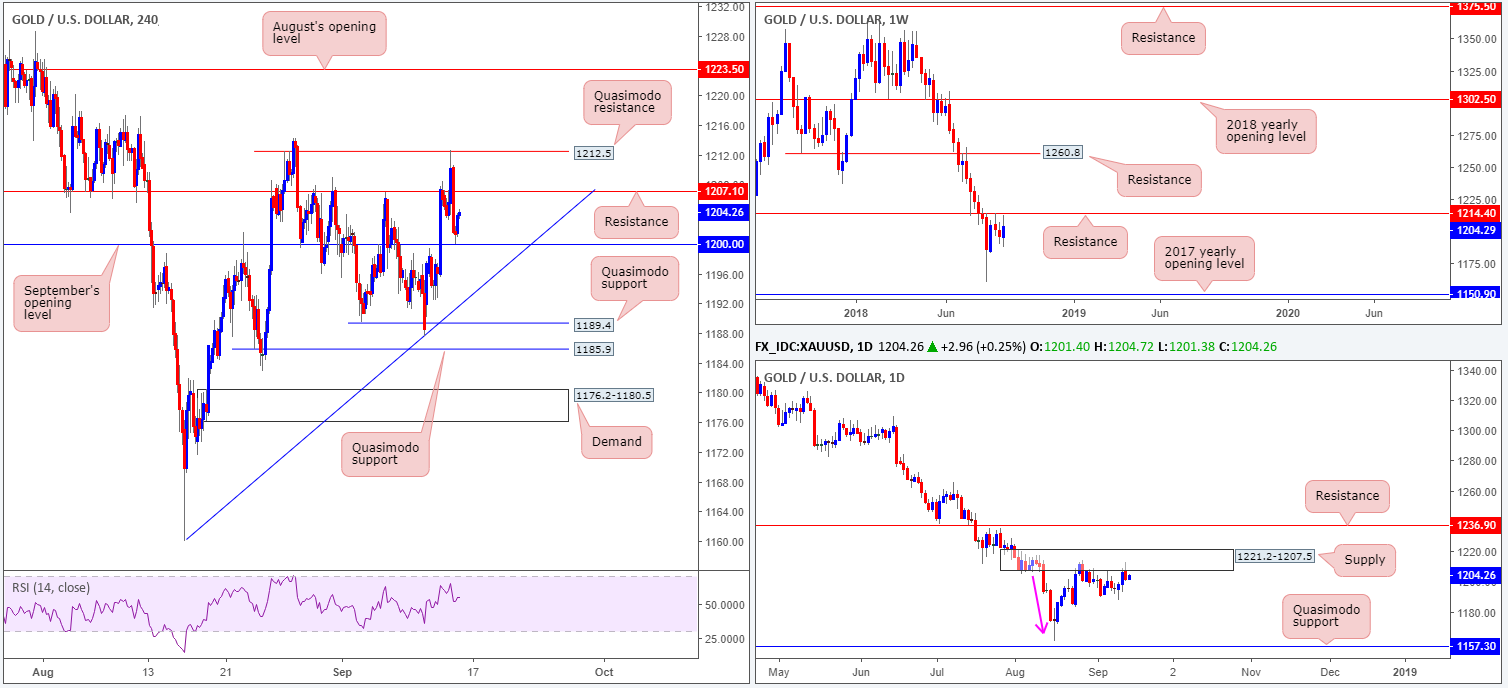
During the course of Thursday’s sessions, the price of gold rushed through H4 resistance at 1207.1 and tapped the underside of a H4 Quasimodo resistance level at 1212.5. From here, the unit met strong selling opposition and pressured its way to a H4 support at 1200.0: September’s opening level, which, as you can see, is holding tight at the moment.
From a higher-timeframe view, this market is currently reflecting a negative bias right now, as price languishes beneath weekly resistance marked at 1214.4. Further downside from this point could eventually stretch as far south as the 2017 yearly opening level at 1150.9. In conjunction with weekly flow, daily movement is seen checking in with a nice-looking supply zone at 1221.2-1207.5. Aside from this zone displaying attractive downside momentum from its base (see pink arrow), it could also be considered the ‘decision point’ to print 2018 yearly lows of 1160.3. Couple this with the fact we are also coming off weekly resistance, we still potentially have ourselves some strong sellers in the mix.
Areas of consideration:
From an intraday perspective (H4 timeframe), structure is restricted right now. To the downside, traders are likely honing in on the current support level (September’s opening level), followed by a trend line support (etched from the low 1160.0 and a couple of Quasimodo supports at 1185.9/1189.4. Overhead, however, the noted resistance at 1207.1 and the Quasimodo resistance at 1212.5 are both still likely on the radar.
In terms of the bigger picture, nonetheless, lower prices are still favoured, as far as we can see, given the notable weekly resistance along with the daily supply. On the whole, this likely places the above noted H4 resistances in a higher light than its opposing support levels for possible shorting opportunities today.
The use of the site is agreement that the site is for informational and educational purposes only and does not constitute advice in any form in the furtherance of any trade or trading decisions.
The accuracy, completeness and timeliness of the information contained on this site cannot be guaranteed. IC Markets does not warranty, guarantee or make any representations, or assume any liability with regard to financial results based on the use of the information in the site.
News, views, opinions, recommendations and other information obtained from sources outside of www.icmarkets.com.au, used in this site are believed to be reliable, but we cannot guarantee their accuracy or completeness. All such information is subject to change at any time without notice. IC Markets assumes no responsibility for the content of any linked site. The fact that such links may exist does not indicate approval or endorsement of any material contained on any linked site.
IC Markets is not liable for any harm caused by the transmission, through accessing the services or information on this site, of a computer virus, or other computer code or programming device that might be used to access, delete, damage, disable, disrupt or otherwise impede in any manner, the operation of the site or of any user’s software, hardware, data or property.


