
EUR/USD:
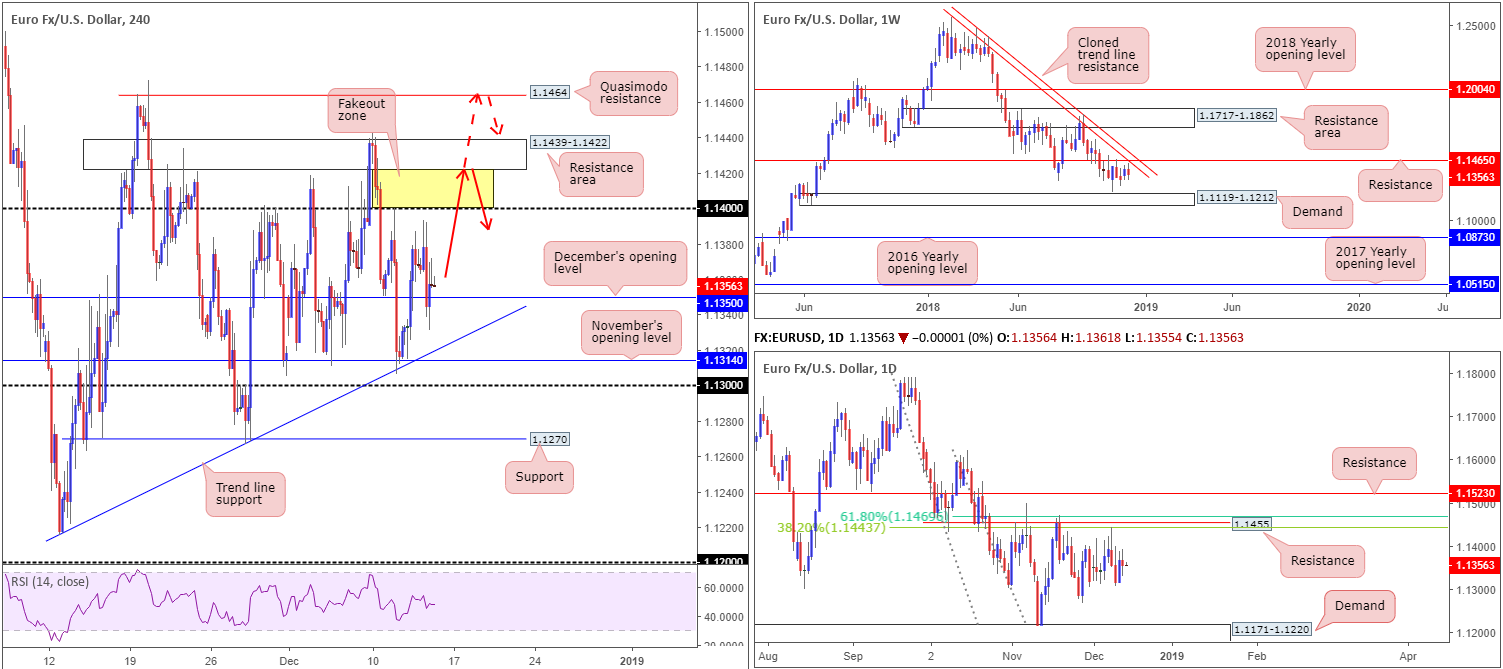
Leaving the 1.14 handle unopposed Thursday, the shared currency pressed lower following the latest ECB’s monetary policy meeting. As expected, the ECB stood pat on rates and confirmed the conclusion of QE whilst maintaining their guidance on rates.
December’s opening level at 1.1350 on the H4 timeframe, as you can see, survived yesterday’s selloff as price action recovered from lows of 1.1331 into the closing stages of the day. As long as this barrier remains supportive, the 1.14 handle will likely be on the radar for many traders today. However, given these psychological barriers being prone to stop runs/fakeouts, selling this number is a challenge. Instead, attention focuses on the area seen above it at 1.1439-1.1422: a beautiful-looking zone of resistance. The yellow area between the two represents where stop-loss orders likely reside and is, therefore, a fakeout zone for possible shorts off 1.1439-1.1422.
In terms of the higher-timeframe picture, structure remains unchanged:
Weekly flow remains languishing beneath resistance priced in at 1.1465 that brings with it a nearby cloned trend line resistance (extended from the high 1.2413). A closer reading on the daily timeframe adds a proven base of resistance circulating around the 1.1455 region. What’s appealing here, other than the fact the level capped upside three times in November and is closely linked to the weekly resistance mentioned above at 1.1465, is the merging Fibonacci resistances: a 61.8% and a 38.2% at 1.1469 and 1.1443, respectively.
Areas of consideration:
Having seen clear resistance on all three timeframes, we have two possible scenarios on the H4 timeframe (red arrows):
- As highlighted above, look to sell the H4 resistance zone at 1.1439-1.1422 on a fakeout through the nearby 1.14 level. Ideally, traders will want to reduce risk to breakeven upon witnessing a close back beneath 1.14, with the expectation of a run towards December’s opening level at 1.1350 for profit taking. Stop-loss orders are best positioned above the resistance area. Traders also need to bear in mind this setup houses limited higher-timeframe convergence.
- In the event the first option fails, the H4 Quasimodo resistance at 1.1464 is another limit worthy of possible shorts. This is due to where it is positioned on the higher timeframes: sited nearby weekly resistance at 1.1465 and daily resistance 1.1455. As for take-profit targets, the research team expects a pullback to at least 1.14ish from here. In regard to stop-loss orders, above the Quasimodo head (1.1472) is an option, albeit somewhat tight.
Today’s data points: French Flash Manufacturing PMI; French Flash Services PMI; German Flash Manufacturing PMI; German Flash Services PMI; EUR Flash Manufacturing PMI; EUR Flash Services PMI; US Core Retail Sales m/m; US Retail Sales m/m.
GBP/USD:
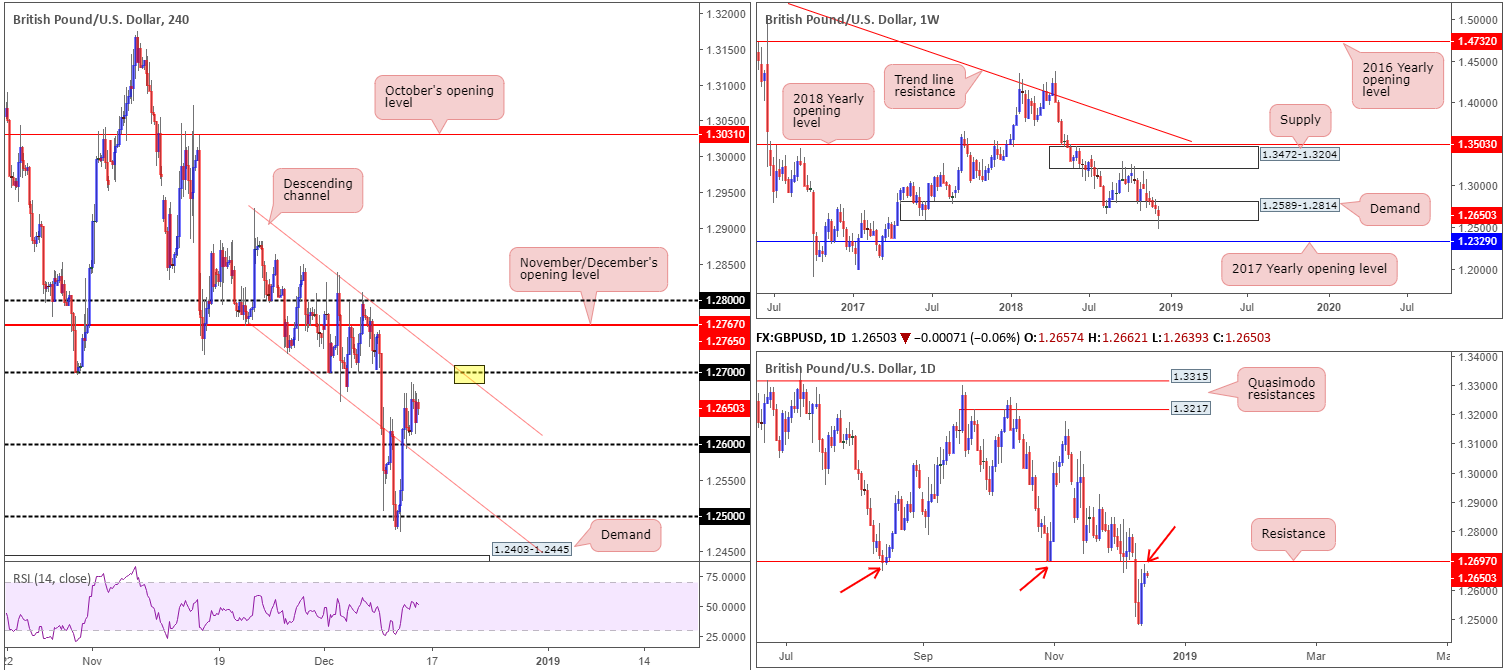
Deriving support off the back of UK PM May’s leadership victory Wednesday (winning the vote by 200 – 117), sterling extended gains yesterday, up 0.27% on the day. Despite this, the future of Brexit remains precarious.
In terms of technical structure, the market witnessed minimal change Thursday.
The H4 candles maintain a position above 1.26 within the walls of a descending channel formation (extended from the low 1.2725), highlighting a possible run towards 1.27.
Potentially supporting this move is the weekly timeframe, which has price action trading back within the walls of demand at 1.2589-1.2814, though buyers are perhaps fragile here owing to the lower edge recently suffering a break to the downside. The outlook on the daily timeframe, nevertheless, shows clear resistance plotted at 1.2697, consequently placing a question mark on buying.
Areas of consideration:
The research team notes should the H4 candles test 1.27 at the point at which it merges with a H4 channel resistance (yellow – taken from the high 1.2927), this would, given the closely converging daily resistance at 1.2697 and potentially weak weekly demand zone at 1.2589-1.2814, offer a potential sell. With respect to a downside target, as of writing, 1.26 appears a logical starting point.
As for entry, waiting for additional candlestick confirmation to form and entering based on the selected structure is an option, or traders could simply enter at 1.27 and position stop-loss orders 15-20 pips above the level. The former is considered the more conservative route.
Today’s data points: US Core Retail Sales m/m; US Retail Sales m/m.
AUD/USD:
Outlook remains unchanged due to lackluster movement.
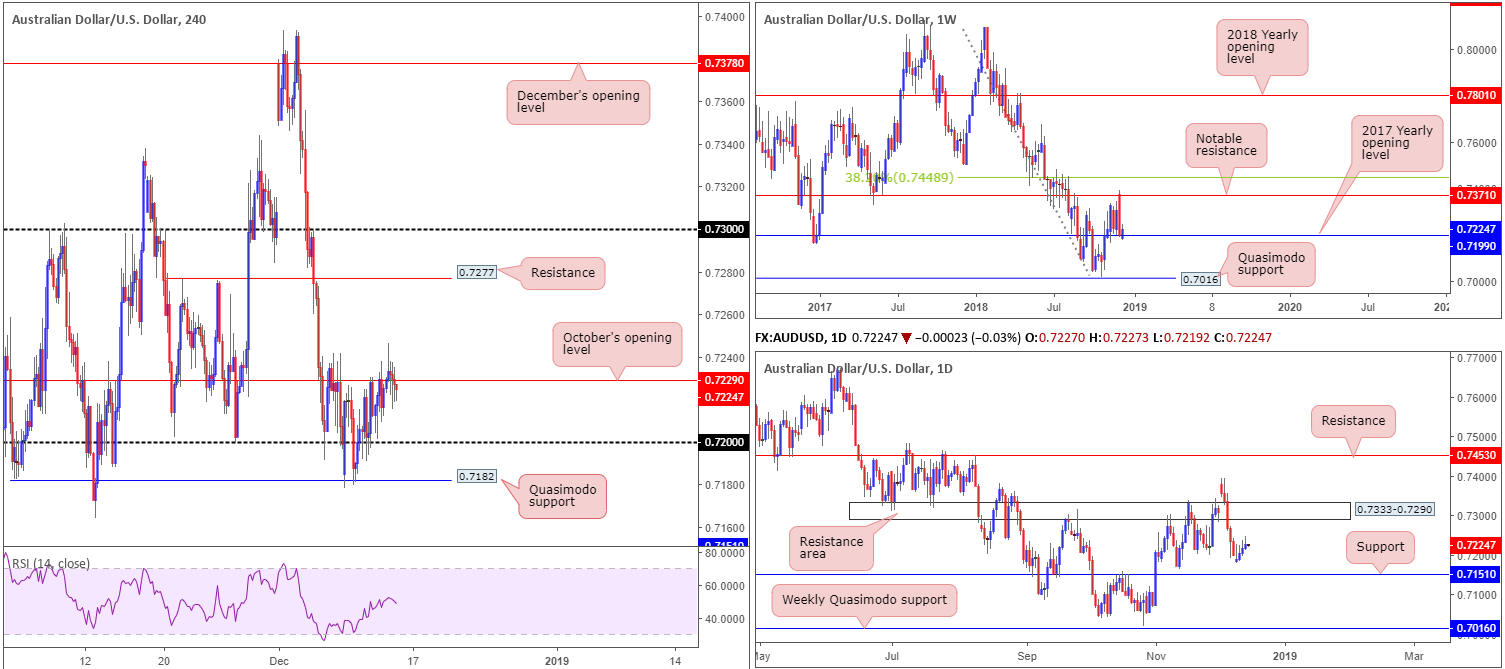
The commodity currency managed to eke out another marginal gain vs. its US counterpart Thursday, up 0.15% on the day.
H4 movement, as you can see, climbed to a session high of 0.7246 amid early European hours, though failed to sustain gains above October’s opening level at 0.7229. Should we eventually climb above this barrier, the river north appears clear to challenge resistance coming in at 0.7277, followed closely by the 0.73 handle.
The viewpoint from the weekly timeframe remains bullish as long as the 2017 yearly opening level at 0.7199 continues to hold (effectively represents the 0.72 handle on the H4 scale). Daily flow, on the other hand, shows potential to explore higher ground until reaching a reasonably well-defined resistance area at 0.7333-0.7290. Though before we reach this zone, traders also need to be prepared for the possibility of a push lower to bring in buyers from support at 0.7151.
Areas of consideration:
A decisive H4 close above October’s opening level at 0.7229 would, given where we’re coming from on the weekly timeframe, be considered a bullish cue to take things higher. Traders have the choice of simply buying the breakout above 0.7229 with stop-loss orders plotted beneath the breakout candle’s low, or for the more conservative trader, wait and see if price retests 0.7229 as support in the shape of a bullish candlestick pattern and enter on the selected structure. Either way, the first take-profit target resides around the H4 resistance mentioned above at 0.7277.
In regard to selling this market, it remains a challenge due to the 2017 yearly opening level mentioned above at 0.7199 on the weekly timeframe.
Today’s data points: US Core Retail Sales m/m; US Retail Sales m/m.
USD/JPY:
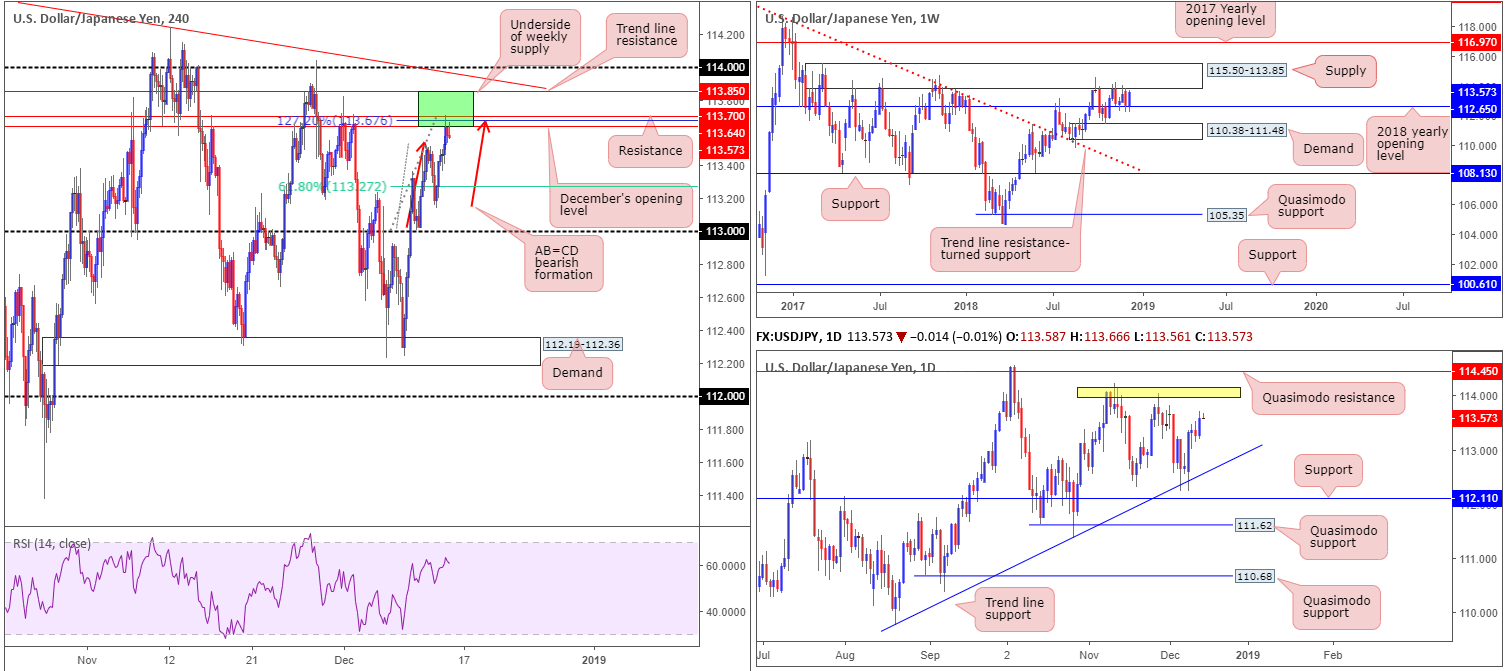
USD/JPY bulls went on the offensive Thursday, up 0.27% on the day. Bolstered by US-China trade optimism along with the greenback receiving a lift from post-ECB selling, the H4 candles shook hands with a rather interesting area of resistance at 113.85/113.64 into the close.
Shaded in green we have a zone composed of the underside of a weekly supply at 113.85, a H4 resistance level at 113.70, December’s opening level at 113.64 and a H4 AB=CD 127.2% bearish completion at 113.67. This, as you can already see, is proving troublesome for buyers, and is, therefore, an area worthy of interest today for possible shorting opportunities.
Areas of consideration:
With stop-loss orders positioned above 113.85, a sell from current price is an option, targeting 113.27 as the initial target: the 61.8% Fibonacci support value derived from legs A-D of the H4 AB=CD pattern.
Today’s data points: US Core Retail Sales m/m; US Retail Sales m/m.
USD/CAD:
Outlook remains unchanged due to lackluster movement.
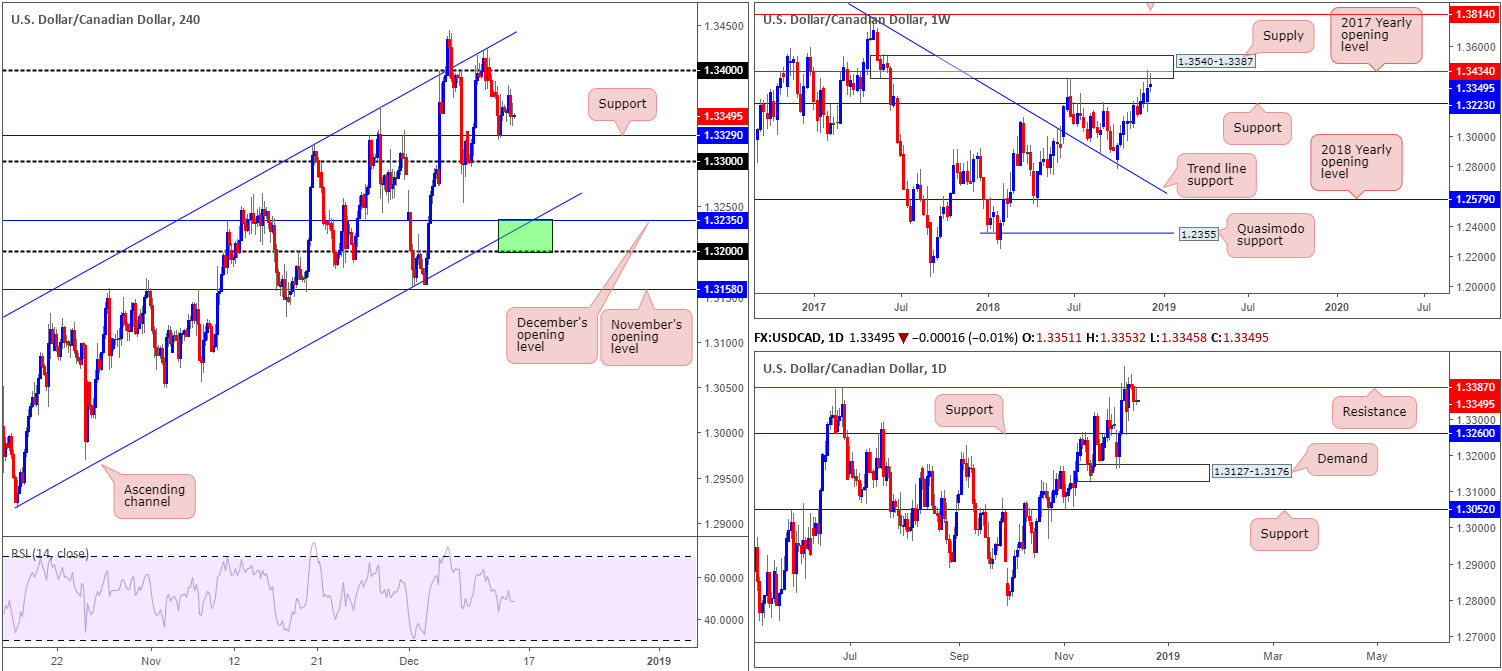
The USD/CAD is effectively unchanged this morning, following a lackluster session Thursday. Ranging no more than 50 pips on the day, the H4 candles remain meandering between support priced in at 1.3329 and the 1.34 handle.
Despite the current H4 support holding ground, further downside could still be upon us. The research team notes weekly price challenging supply at 1.3540-1.3387/the 2017 yearly opening level at 1.3434, and daily movement turning lower from 1.3387: a resistance level.
Selling at current price, however, would be a chancy move, knowing we have active buyers invested off H4 support mentioned above at 1.3329 and possible buyers residing around 1.33. Yet, even with a decisive H4 close beneath the 1.33 handle, traders would immediately face support from the daily timeframe at 1.3260 (the next downside target on the daily scale). Therefore, selling this market is difficult, despite where we’re coming from on the bigger picture.
Areas of consideration:
Ultimately, December’s opening level at 1.3235 and its merging H4 channel support (etched from the low 1.2916) is a location active buyers likely reside. This is due to its close connection with higher-timeframe supports. Daily support, as we already know, is seen around 1.3260, though we also have weekly support coming in at 1.3223 which forms the next downside target on the weekly scale.
On account of the above reading, the green zone on the H4 timeframe at 1.32/1.3235 remains an area worthy of attention for possible long trades, with an initial upside target set at 1.33. Conservative traders may elect to enter on the back of candlestick confirmation, while more aggressive traders might opt to simply enter long from 1.3235 and position stops a couple of pips beneath 1.32.
Today’s data points: US Core Retail Sales m/m; US Retail Sales m/m.
USD/CHF:
Outlook remains unchanged due to lackluster movement.
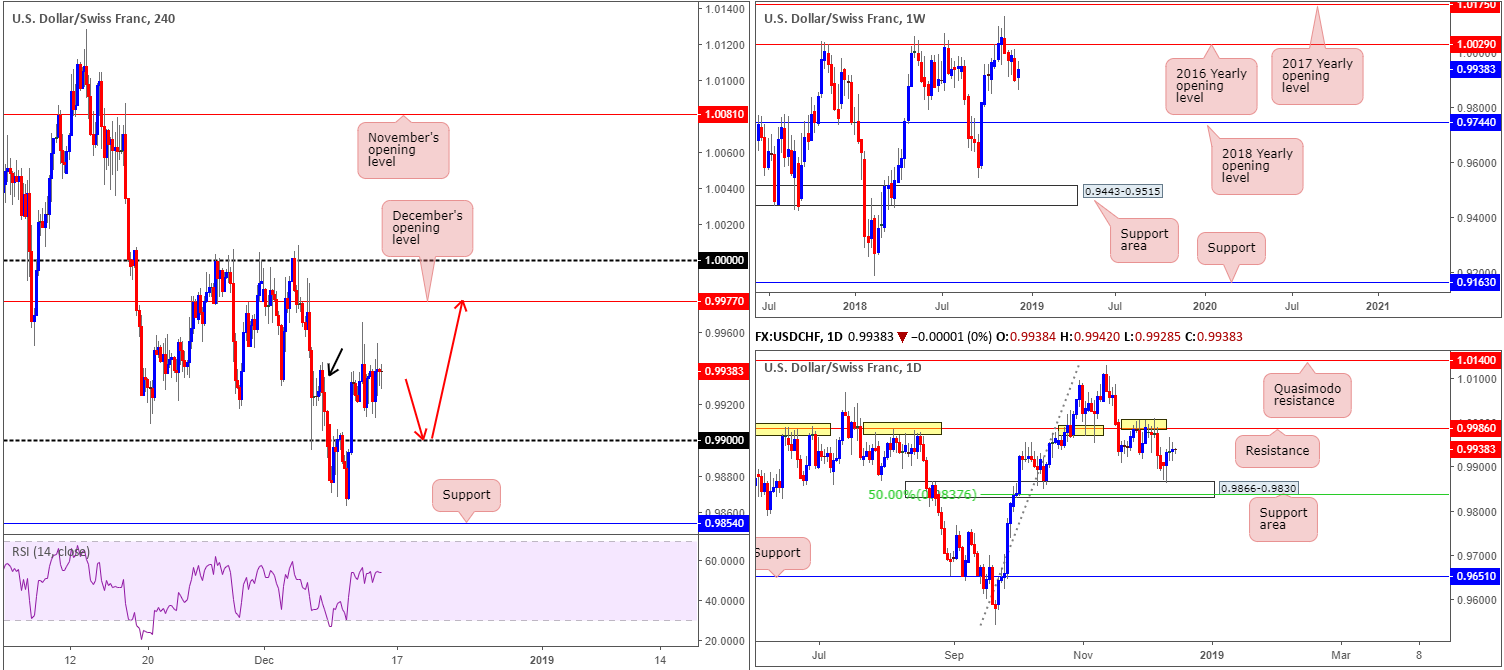
In the shape of a daily indecision candle, USD/CHF action emphasized a somewhat subdued tone Thursday as the SNB maintained a highly valued assessment of the currency and reiterated ‘fragile’ FX markets that warrant ongoing monitoring with intermittent action when needed.
With H4 supply marked with a black arrow at 0.9943-0.9926 largely consumed by recent movement, the runway north is potentially free of major resistance until reaching December’s opening level at 0.9977.
Higher-timeframe structure shows daily flow has space to press towards resistance plotted at 0.9986, following a strong recovery off a support area at 0.9866-0.9830 Tuesday. Weekly flow, on the other hand, has room to trade as far north as 1.0029: the 2016 yearly opening level, while to the downside active support does not enter the fold until 0.9744: the 2018 yearly opening level.
Areas of consideration:
Having seen H4 price take out the H4 supply mentioned above at 0.9943-0.9926, along with both weekly and daily timeframes displaying room to climb higher, a retest off of 0.99 in the shape of a bullish candlestick configuration (entry/stop parameters can be defined according to this pattern) would likely be enough to justify a long position in this market.
As for upside targets, the research team feels December’s opening level at 0.9977 is a reasonable objective, trailed closely by daily resistance at 0.9986 and then 1.0000 (parity) on the H4 timeframe.
Today’s data points: US Core Retail Sales m/m; US Retail Sales m/m.
Dow Jones Industrial Average:
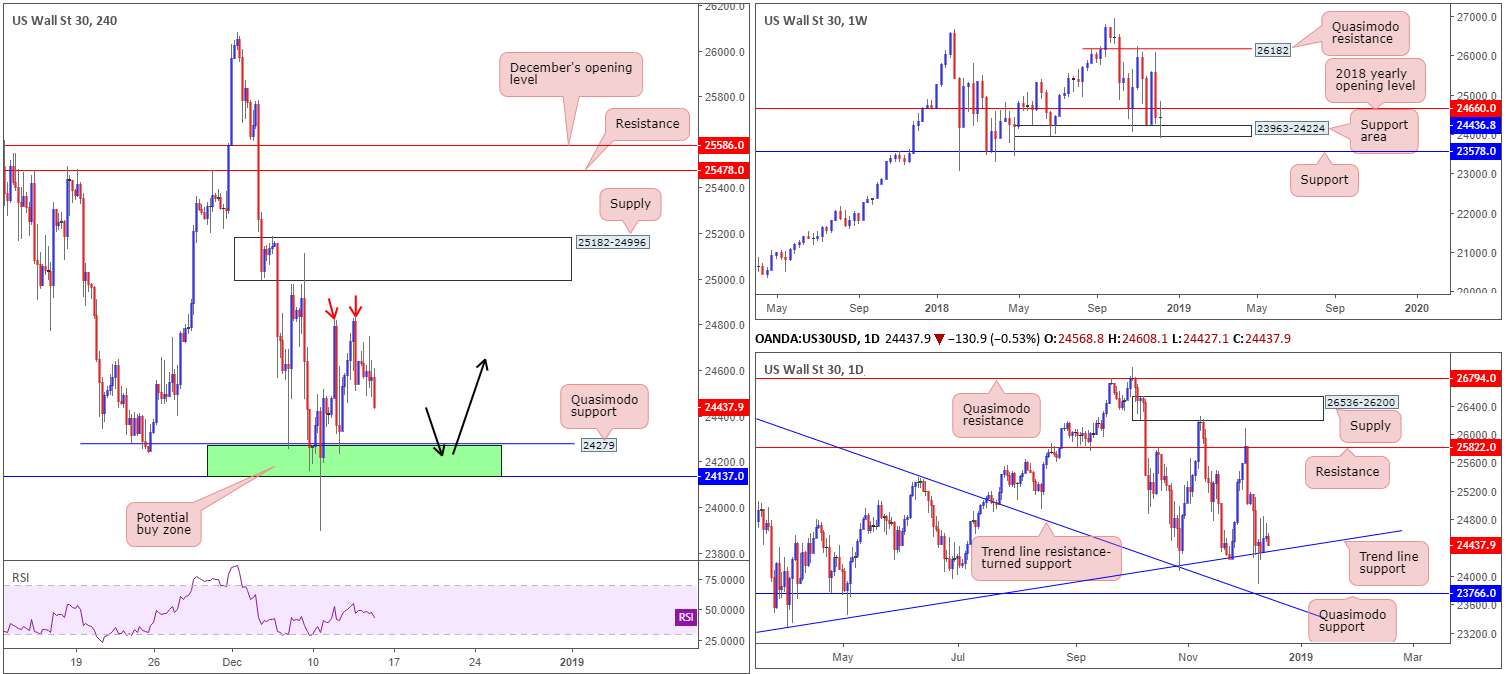
The Dow Jones Industrial Average concluded the session up 0.13% Thursday, flipping between gains/losses amid conflicting sentiment and headlines surrounding US-China trade relations.
In recent hours, however, we have seen the unit press for lower ground. This, from a H4 perspective, has placed the candles within striking distance of 24137/24279 (green – comprised of a H4 Quasimodo support at 24279, a H4 support at 24137 and the top edge of a weekly support area at 24224). In view of this and a recent higher high at 24842 (red arrows), the green zone could be retested today and witness a rotation back to the upside.
As already stated, 24137/24279 boasts convergence stemming from the weekly timeframe in the form of a support area’s top limit at 24224. In addition to this, though, we can also see the area has connections to trend line support on the daily timeframe (extended from the low 23055).
Areas of consideration:
If H4 price continues to push south and tests 24137/24279 by way of a H4 bullish candlestick configuration (entry/stop parameters can be defined by the selected structure), the research team believes a reaction will be observed.
In terms of take-profit targets, H4 tops around 24842 would be considered an ideal starting point, followed then by H4 supply plotted at 25182-24996.
Today’s data points: US Core Retail Sales m/m; US Retail Sales m/m.
XAU/USD (Gold):
Overall, structure remains unaffected, and, therefore, the outlook remains unchanged.
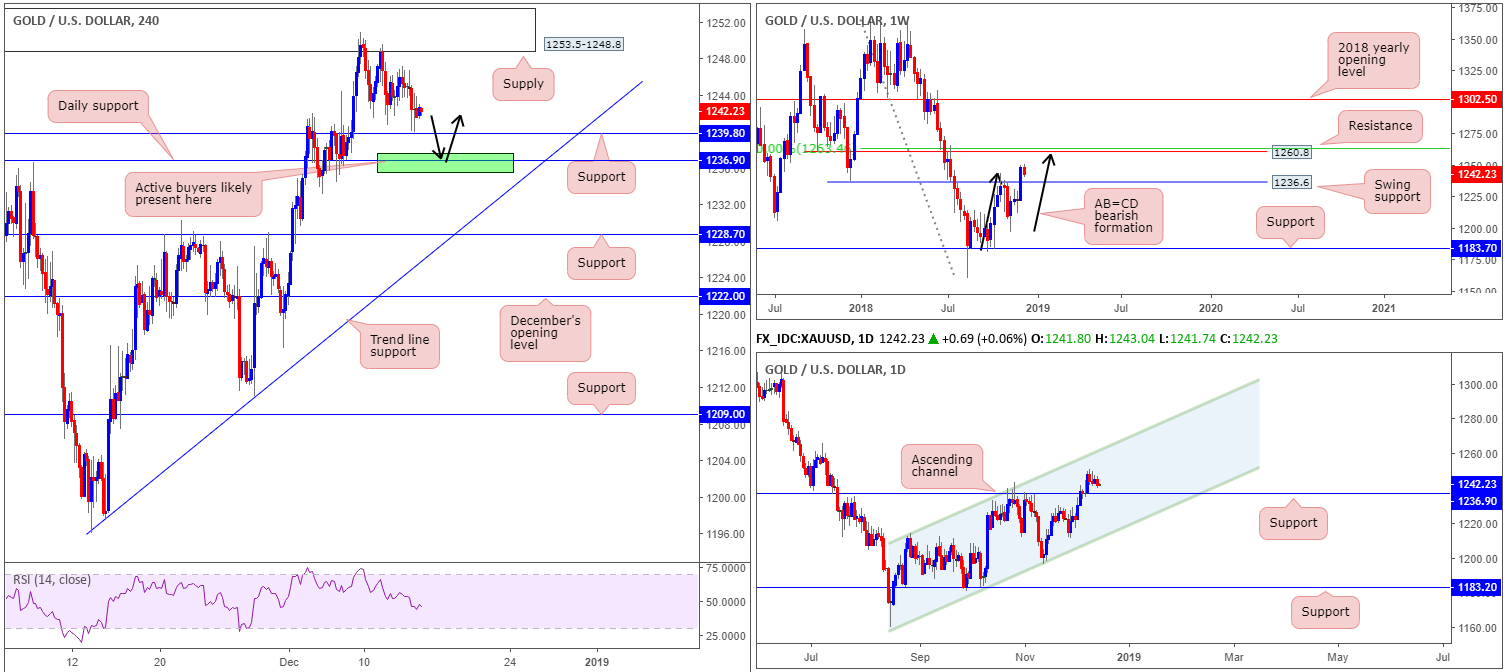
H4 supply at 1253.5-1248.8 continues to cap upside movement. Thursday’s action witnessed a decline in value of 0.30%. Granted, it’s not anything to get excited about, though it did pull the H4 candles towards support at 1239.8. Note this level is trailed closely by a daily support level priced in at 1236.9, which happens to also represent a swing support on the weekly timeframe at 1236.6.
In regards to higher-timeframe action, further buying is still very much on the cards, according to our technical studies. Weekly price action has eyes on resistance at 1260.8, which is joined by a possible AB=CD bearish completion point (black arrows) and a nearby 50.0% resistance value at 1263.4. Daily price, on the other hand, has a channel resistance (etched from the high 1214.3) to target.
Areas of consideration:
Ultimately, the research team still believes if the market tests daily support highlighted above at 1236.9, a rotation to the upside will highly likely be observed. This is simply because both weekly and daily timeframes agree support resides around 1236.9ish. A conservative buy signal off this region would be for H4 price to close back above 1239.8 (black arrows) in the shape of a reasonably strong rotation candle. A long on the close of this candle with stop-loss orders tucked beneath its tail is an option, targeting H4 supply mentioned above at 1253.5-1248.8 as an initial port of call.
The use of the site is agreement that the site is for informational and educational purposes only and does not constitute advice in any form in the furtherance of any trade or trading decisions.
The accuracy, completeness and timeliness of the information contained on this site cannot be guaranteed. IC Markets does not warranty, guarantee or make any representations, or assume any liability with regard to financial results based on the use of the information in the site.
News, views, opinions, recommendations and other information obtained from sources outside of www.icmarkets.com.au, used in this site are believed to be reliable, but we cannot guarantee their accuracy or completeness. All such information is subject to change at any time without notice. IC Markets assumes no responsibility for the content of any linked site. The fact that such links may exist does not indicate approval or endorsement of any material contained on any linked site.
IC Markets is not liable for any harm caused by the transmission, through accessing the services or information on this site, of a computer virus, or other computer code or programming device that might be used to access, delete, damage, disable, disrupt or otherwise impede in any manner, the operation of the site or of any user’s software, hardware, data or property.


