
A note on lower timeframe confirming price action…
Waiting for lower timeframe confirmation is our main tool to confirm strength within higher timeframe zones, andhas really been the key to our trading success. It takes a little time to understand the subtle nuances, however, as each trade is never the same, but once you master the rhythm so to speak, you will be saved from countless unnecessary losing trades. The following is a list of what we look for:
- A break/retest of supply or demand dependent on which way you’re trading.
- A trendline break/retest.
- Buying/selling tails – essentially we look for a cluster of very obvious spikes within the higher timeframe zone.
- Candlestick patterns. We tend to only stick with pin bars and engulfing bars as these have proven to be the most effective.
EUR/USD:
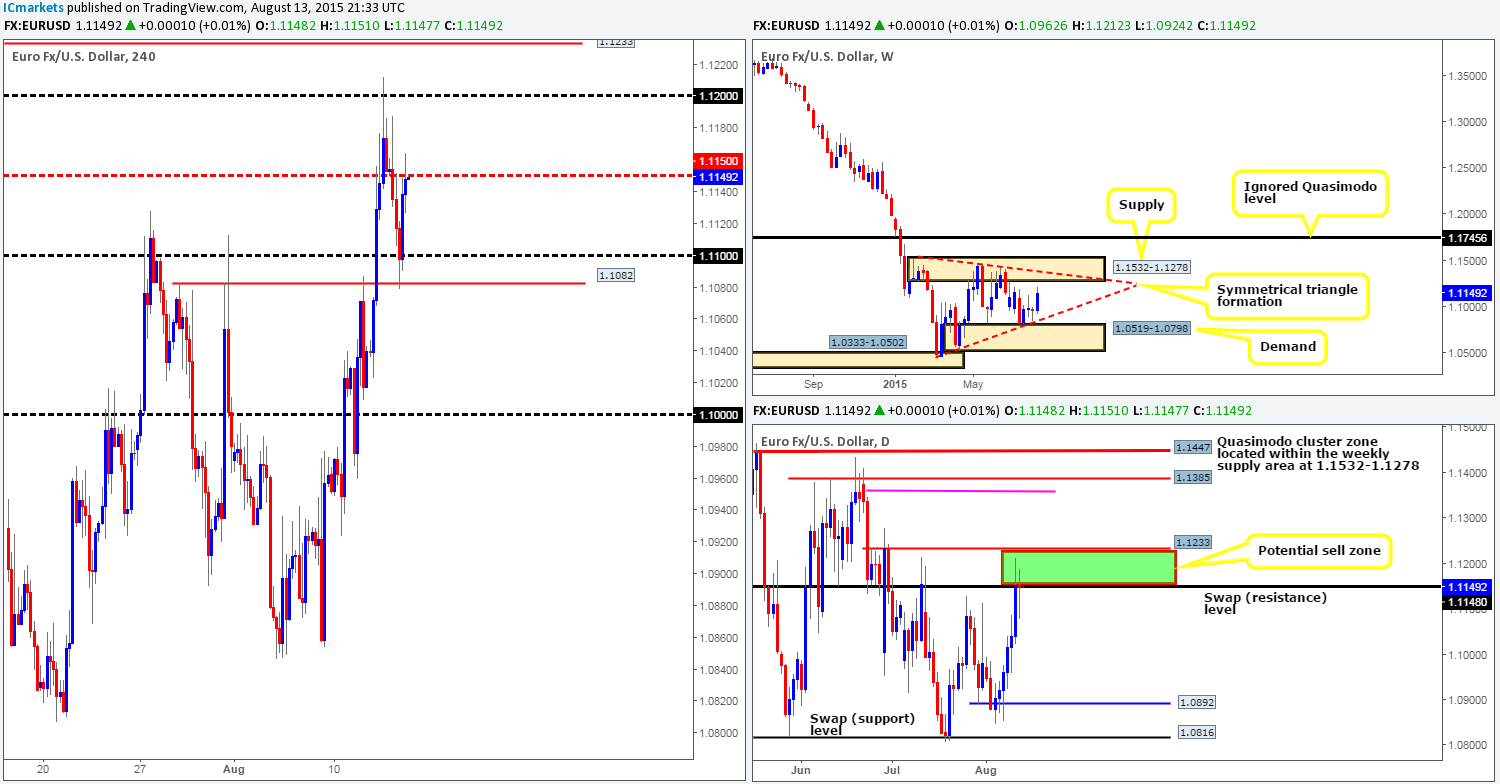
Going into the early hours of yesterday’s trade, the mid-level number 1.1150 was taken out followed by a sweet retest and sharp drop down to 1.1100, which, as you can see, was faked beautifully into 1.1082 – an ignored 4hr Quasimodo level. It was at this point (the U.S. open);price began to reverse consequently erasing most of the day’s earlier losses and closing the dayout a little below 1.1150.
Given that price action is not only nibbling at offers around 1.1150 right now, butalso remains positioned around our daily sell zone formed from a daily Quasimodo resistance level at 1.1233 and a daily swap (resistance) level at 1.1148, is this the right time to be looking to join in selling the EUR pair? It could well be, the only grumble we have right now though is the fact that price is yet to reach the weekly supply zone coming in at 1.1532-1.1278.
On account of the above,1.1150 will likely play a key role in our decision-making process today…
- Watch lower timeframe selling confirmation closely around 1.1150. Should an entry be spotted here, we would, dependent on the time of day of course, likely enter short and look to take partial profits around 1.1100/1.1.1082.
- In the event that 1.1150 is taken out, however, we’ll then wait to see if prices hit either 1.1200 or the daily Quasimodo resistance level just above it at 1.1233. As we mentioned yesterday, lower timeframe confirmation will be needed at these barriers for two reasons. One, it would be difficult, if not impossible; to know which level will see a reaction, if any. And two, there is always a chance that price may fake above both of these barriers to tag in offers sitting around the lower boundary of weekly supply area mentioned above at 1.1278.
Levels to watch/live orders:
- Buys:Flat (Stop loss: N/A).
- Sells: 1.1150 [Tentative – confirmation required] (Stop loss: dependent on where one confirms this level) 1.1200 [Tentative – confirmation required] (Stop loss: dependent on where one confirms this level) 1.1233 [Tentative – confirmation required] (Stop loss: dependent on where one confirms this level).
GBP/USD:
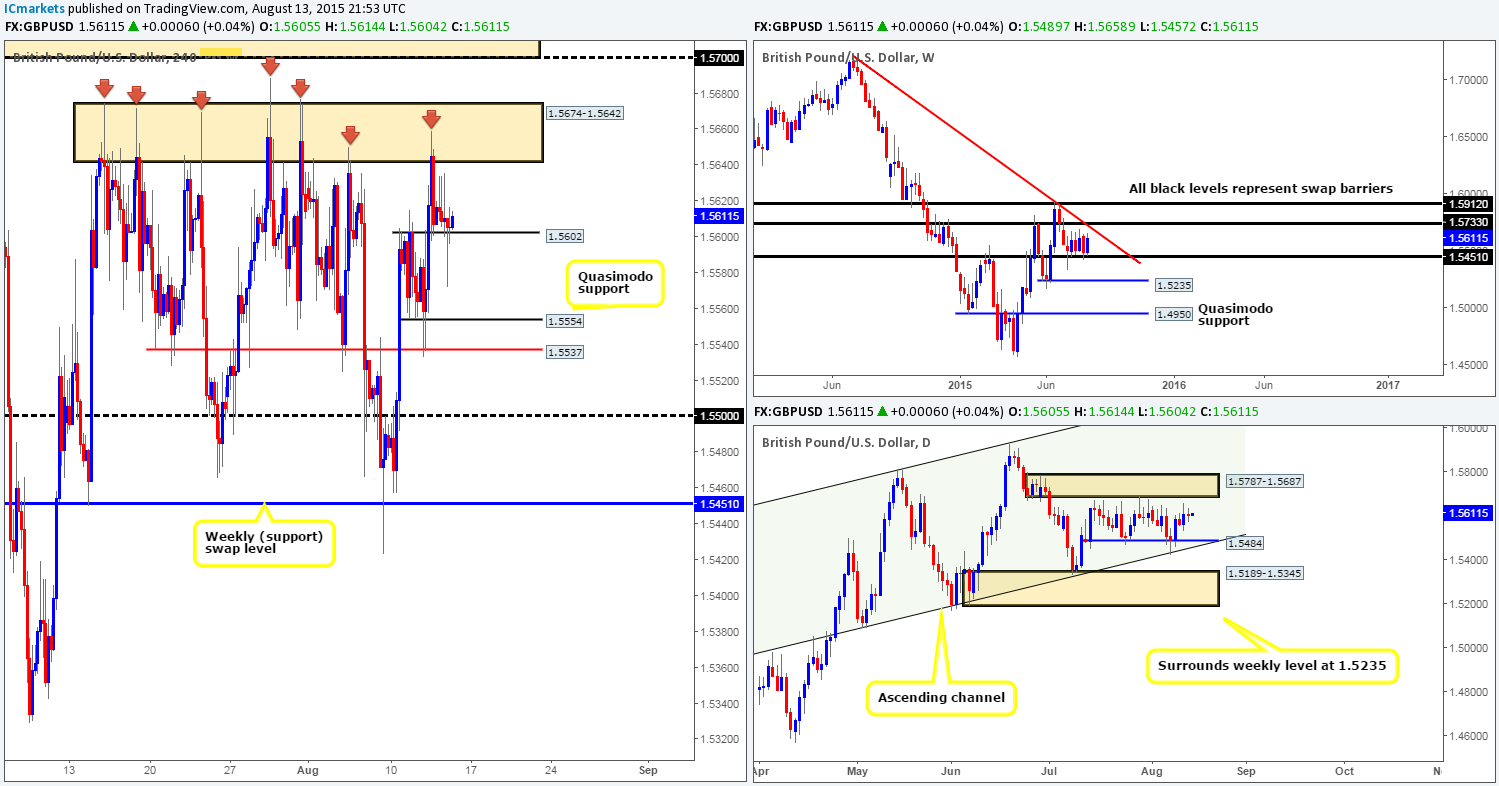
Compared to its bigger brother the EUR/USD, Cable saw very little action during yesterday’s sessions as bids at the 1.5602 held this market higher. Consequent to this somewhat lackluster performance, much of the following analysis will be similar to the previous…
With not much Intel coming in from the higher timeframe structures, other than both are trading mid-range at the moment (weekly between 1.5733/1.5451 – daily between 1.5787-1.5687/1.5484), it is very difficult to judge medium-term direction. As such, our team has come to a general consensus that looking to play for only short-term intraday moves at pre-determined areas of interest is likely the best path to take today:
Potential buy zones:
- 1.5602. Considering that this minor 4hr swap (support) level merges nicely with the round number 1.5600, and clearly proved its worth amid yesterday’s action, this barrier could be good for a bounce higher today. However, seeing as there is very little supportive structure below, we’d advise only entering long here if lower timeframe confirmation is seen.
Potential sell zones:
- 1.5674-1.5642. This 4hr base resistance has certainly stood the test of time. One only has to look at how many times this area has held this market lower recently. To that end, one could look to short this zone with confirming lower timeframe price action – the confirmation is needed simply to avoid fakeouts which if you look to the left have already happened.
- Watch for 1.5602 to be consumed and then look to enter on a retest of this number (confirmation required). Support targets come in at 1.5554 and 1.5537.
Levels to watch/ live orders:
- Buys: 1.5602 [Tentative – confirmation required] (Stop loss: dependent on where one confirms this level).
- Sells: 1.5674-1.5642 [Tentative – confirmation required] (Stop loss: dependent on where one confirms this area).Watch for 1.5602 to be consumed and then look to enter on a retest of this number (confirmation required).
AUD/USD:
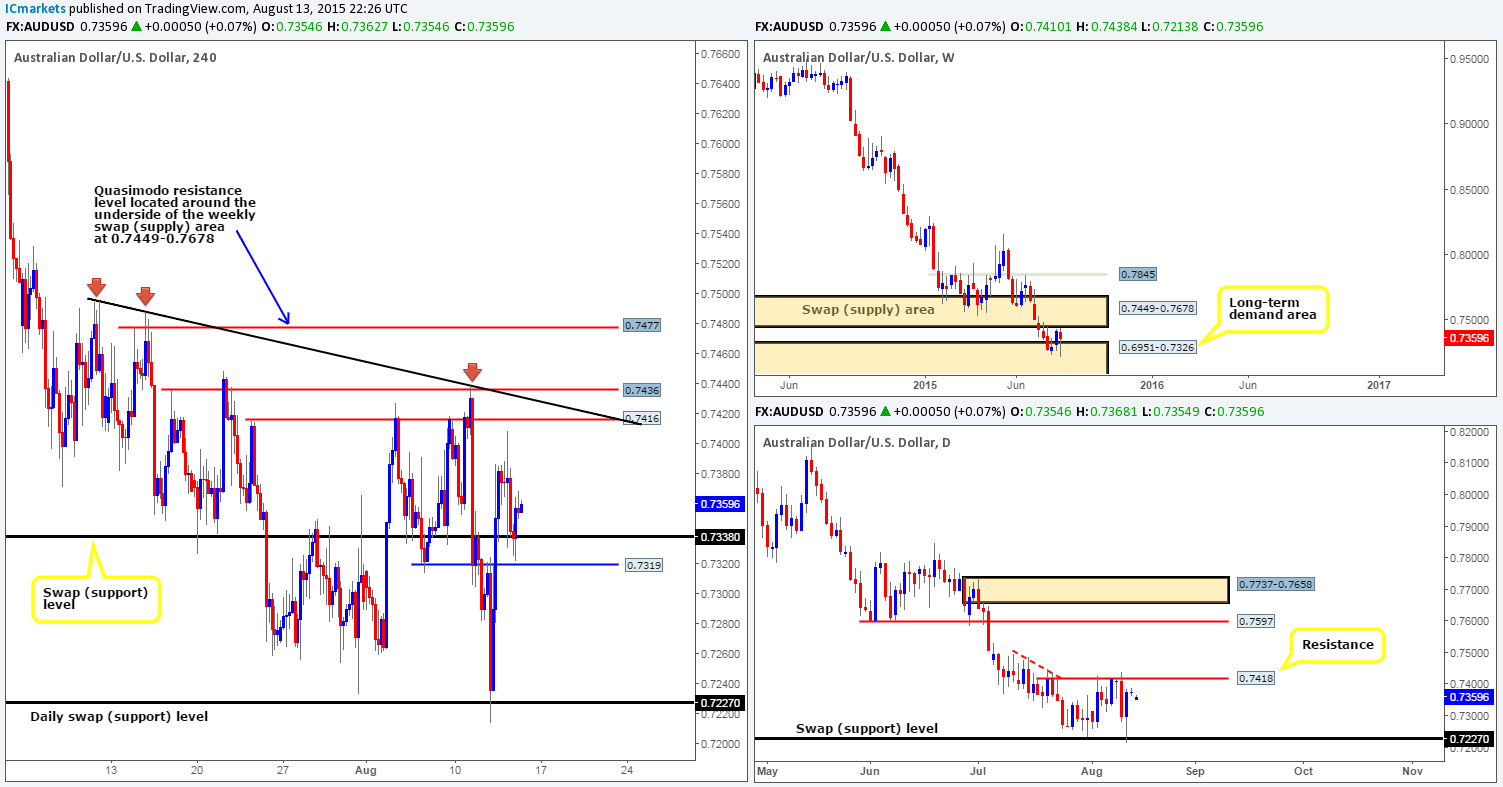
Early trade saw price descend down towards a 4hr swap (support) level at 0.7338, which, after a couple of buying tails printed, a small rally was seen into the close 0.7371.
In that price is still so very near to connecting with both the minor daily resistance line at 0.7418, and the underside of the weekly swap (supply) area at 0.7449 (let’s also not forget the humongous downtrend the Aussie is in right now as well), our bias remains south. Potential sell levels we currently have our eye on are as follows:
- 4hr resistance at 0.7416. This number is not only seen on the daily scale as minor resistance (two-pip difference), but it also merges nicely with a 4hr downtrend line taken from the high 0.7494.
- 4hr Quasimodo resistance level at 0.7436. As you can see, this limit has already more than proved its worth from the spectacular reaction seen on the 10/08/15 at 0.7406, and as such deserves a place on this list.
- And finally, 0.7477 – another 4hr Quasimodo resistance barrier. This is a golden area for us, as it lurks only two pips below the aforementioned weekly swap (supply) area – beautiful confluence.
It is totally trader dependent of course on how one approaches tradingthese levels. We, on the other hand, have chosen to play on the side of caution here and wait for a lower timeframe selling signal before considering a trade, as any one of the above said hurdles could, or could not see a reaction.
Levels to watch/ live orders:
- Buys: Flat (Stop loss: N/A).
- Sells: 0.7416/0.7436/0.7477 [Tentative – confirmation required] (Stop loss: dependent on where one finds confirmation at these levels).
USD/JPY:
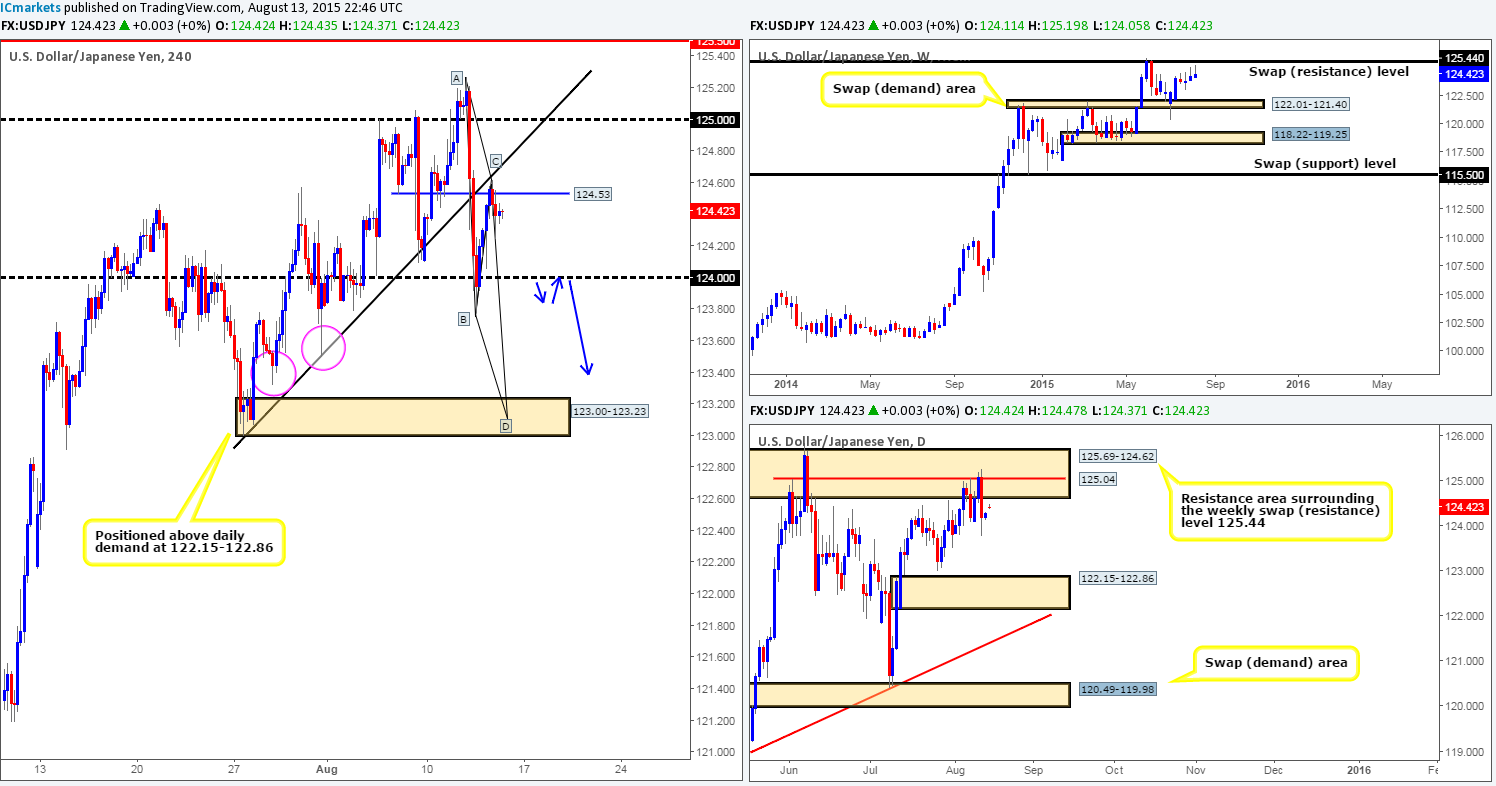
For those who read our previous report http://www.icmarkets.com/blog/thursday-13th-august-daily-technical-outlook-and-review/ you may recall us mentioning that prices may continue on a short-covering ascent up to 124.53, which, as you can see, did in fact play out. In the event that the sellers can hold this market below here today, we might, just might, see prices decline all the way down to 4hr demand coming in at 123.00-123.23. Here’s why…
- The Weekly chart showsthat another selling tail (pin-bar candle) is currently in the process of forming just below the weekly swap (resistance) level at 125.44.There is also space for price to move lower from here down to the weekly swap (demand) area at 122.01-121.40.
- The Daily chart showsprice is currently being held lower by a daily Quasimodo resistance level at 125.04 (located deep within a daily resistance area at 125.69-124.62), which, like the weekly timeframe, also shows space for prices to continue lower to the daily demand area coming in at 122.15-122.86.
- Bids around the round number level 124.00 are very likely weak at this point.
- The demand consumption tails painted to the left (pink circles) at 123.51/123.32 suggests that below 124.00, the path south is clear of major bids until the aforementioned 4hr demand zone.
- Recent action is in the process of forming the C-leg of an AB=CD bullish pattern whichconveniently completes at the 4hr demand area seen at 123.00-123.23.
To trade this potential down move, however, we’d need to see a break/retest of 124.00 (as per the blue arrows) along with corresponding lower timeframe selling confirmation. This way, at least we’d be confident price has consumed the last of any bids remaining at 124.00 support.
Levels to watch/ live orders:
- Buys:Flat (Stop loss: N/A).
- Sells:Watch for 124.00 to be consumed and then look to enter on a retest of this number (confirmation required).
USD/CAD:
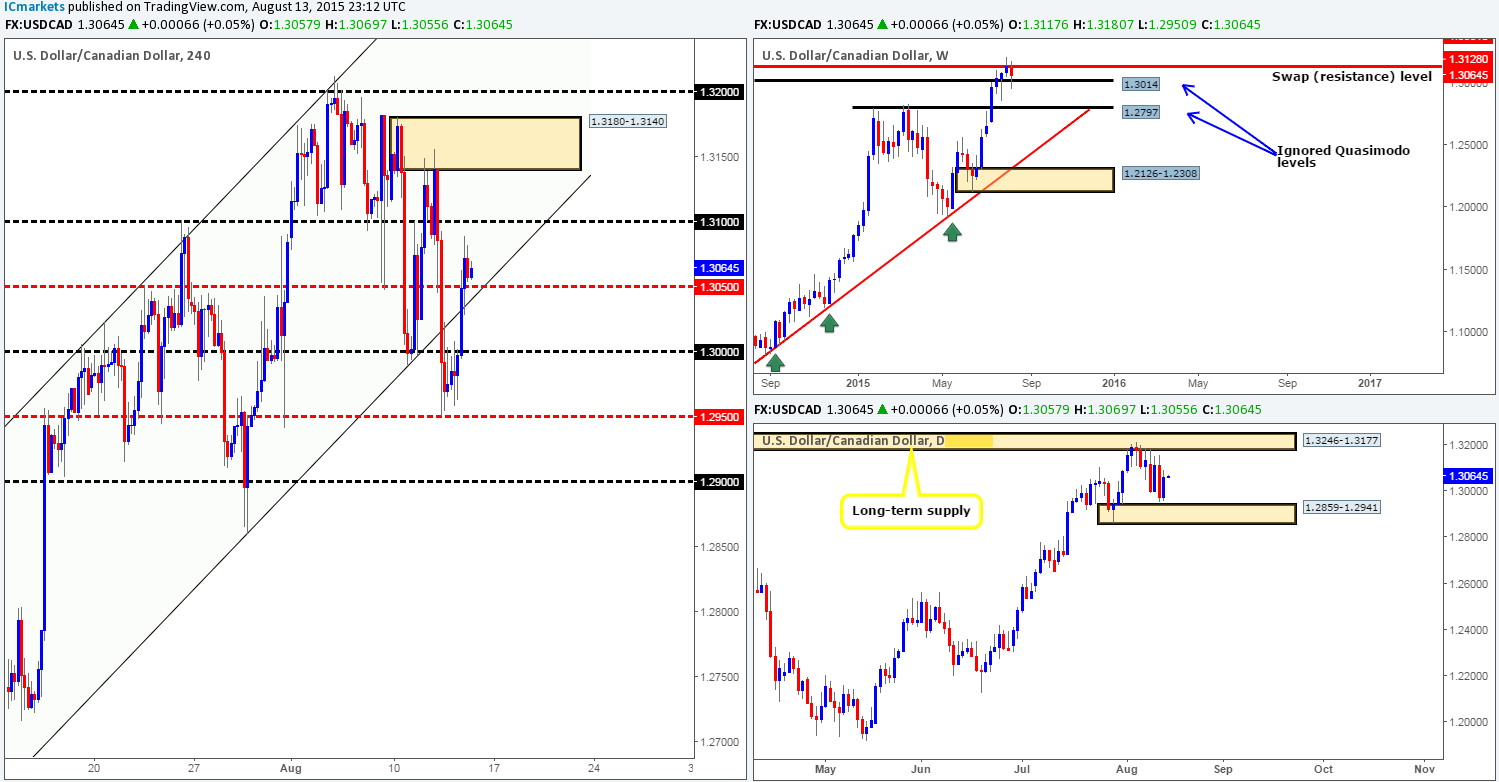
Recent events on the USD/CAD pair show that price aggressively broke above 1.3000 during the London morning session, resulting in price driving itself back into the 4hr ascending channel (1.2652/1.3023).
In that price is now trading just above the mid-level number support 1.3050 which could potentially act as support today, where do we stand in the bigger picture? Well, the weekly chart shows price is, as a result of yesterday’s buying, now respecting the top-side of the weekly ignored Quasimodo level at 1.3014, while daily action reveals price has been bought from just above daily demand coming in at 1.2859-1.2941.
Given the above, coupled with the fact that the trend on this pair is still firmly pointing north, we believe 1.3050 could be a nice barrier to look for lower timeframe confirmed buys today. However, seeing as it is the last trading day of the week, we’d likely target 1.3100 first and foremost, followed closely by the underside of the 4hr supply zone at 1.3180-1.3140.
Levels to watch/ live orders:
- Buys:1.3050 [Tentative – confirmation required] (Stop loss: dependent on where one confirms this level).
- Sells:Flat (Stop loss: N/A).
USD/CHF:
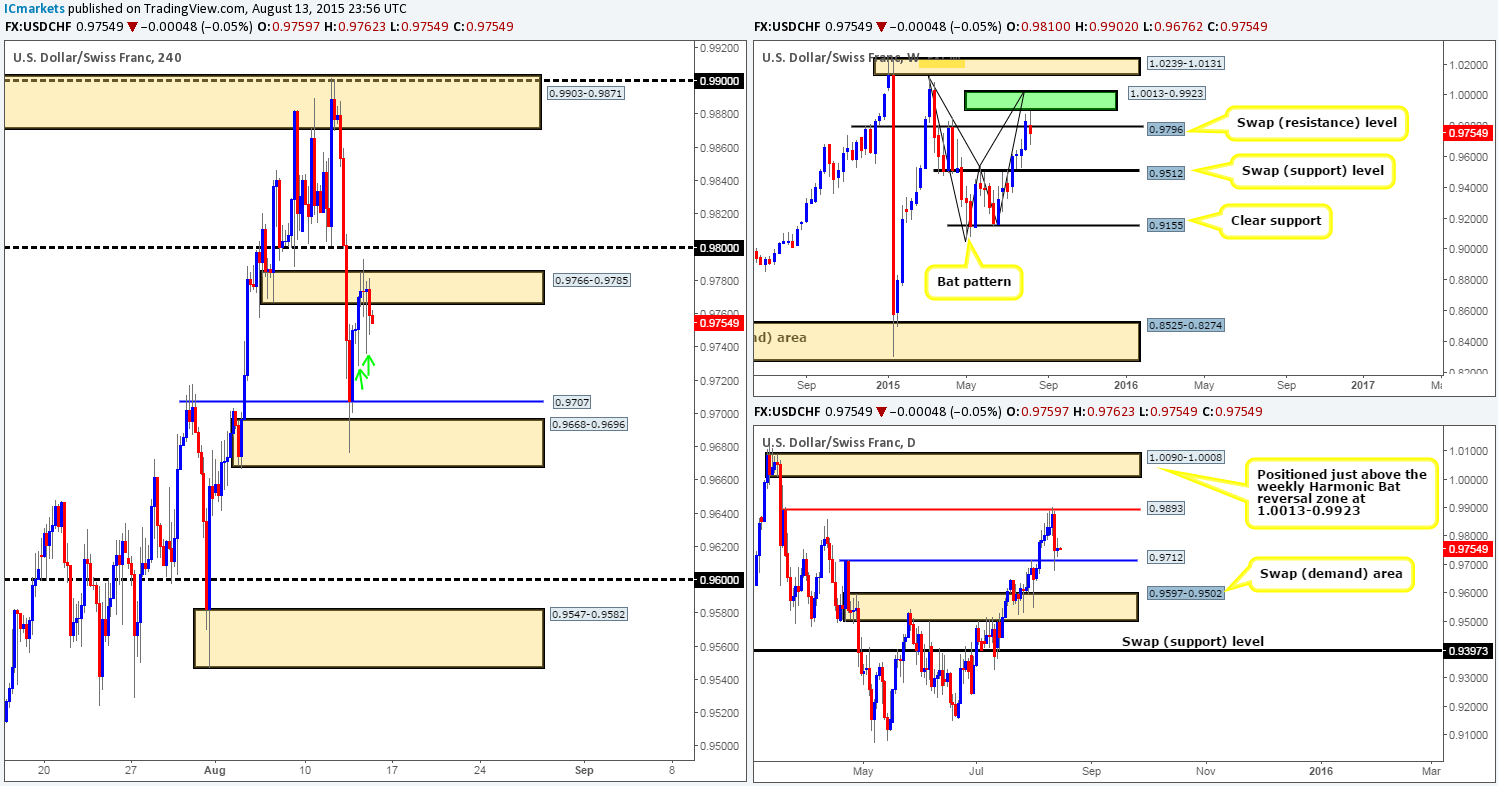
In the midst of yesterday’s trade, bids continued to push this market north, eventually forcing price to stab/fake above the 4hr swap (supply) zone at 0.9766-0.9785, which was reported may happen in yesterday’s analysis. Unfortunately we missed this move entirely – well done to any of our readers who managed to lock in some green pips from this!
Judging by the current structure of price action on the 4hr timeframe, we still believe this pair will eventually continue to push south today. Check out the two tails marked with green arrows at 0.9729/0.9736. These spikes lower likely took out the majority of bids around lower timeframe demand areas, which in turn has possibly opened a void of sorts for further selling. This – coupled with price being held lower by a weekly swap (resistance) level at 0.9796 with room seen for price to continue south at the moment would certainly be enough for us to hold on to our short positions down to at least 0.9709. With that, if you missed the higher entry, like us, you may be able to find a lower timeframe short setup on the way down to this number – we’re thinking maybe a simple break/retest continuation trade off of a lower timeframe level would suffice.
With everything taken into account, traders still need to bear in mind that price has recently rebounded off of a daily swap (support) level, so constant monitoring of any positions taken here is a MUST.
Levels to watch/ live orders:
- Buys: Flat (Stop loss: N/A).
- Sells:Keep an eye out for confirmed sells on the way down to 0.9707 – a break/retest continuation trade would do fine!
DOW 30:
In view of yesterday’s lackluster performance on the DOW, much of the following analysis will remain similar to the previous…
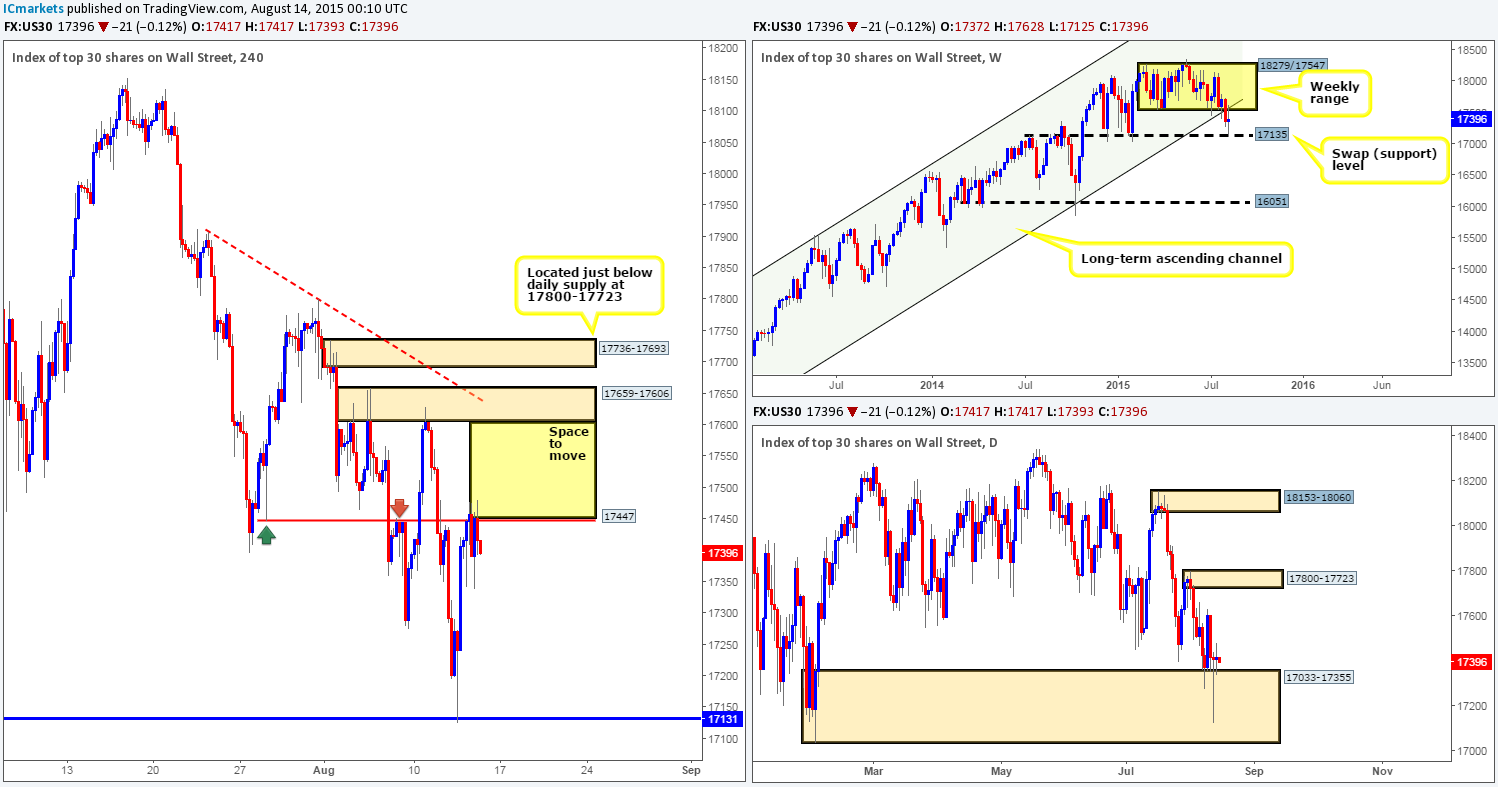
Beginning with the weekly timeframe this morning, it is clear to see that price has now hit and rebounded from the weekly swap (support) level coming in at 17135. Alongside this, the daily timeframe shows price is currently holding steady at the top-side of daily demand coming in at 17033-17355.
The viewpoint from the 4hr scale, however, shows price has lodged itself below a 4hr swap (resistance) level at 17447. Given that both the daily and weekly timeframes indicate further buying is possible today,the current 4hr swap (resistance) level is, as far as we can see, all what’s standing in the way to a move higher up to at least 17659-17606 – a 4hr resistance base. Therefore, our objective for today is simple. Patiently wait and see if price can close above and retest 17447. Should this come to fruition, we’d very likely consider buying this market as long as there is some sort of lower timeframe confirming buy signal seen following the retest.
Levels to watch/ live orders:
- Buys: Watch for 17447 to be consumed and then look to enter on a retest of this area (confirmation required).
- Sells: Flat (Stop loss: N/A).
XAU/USD: (Gold)
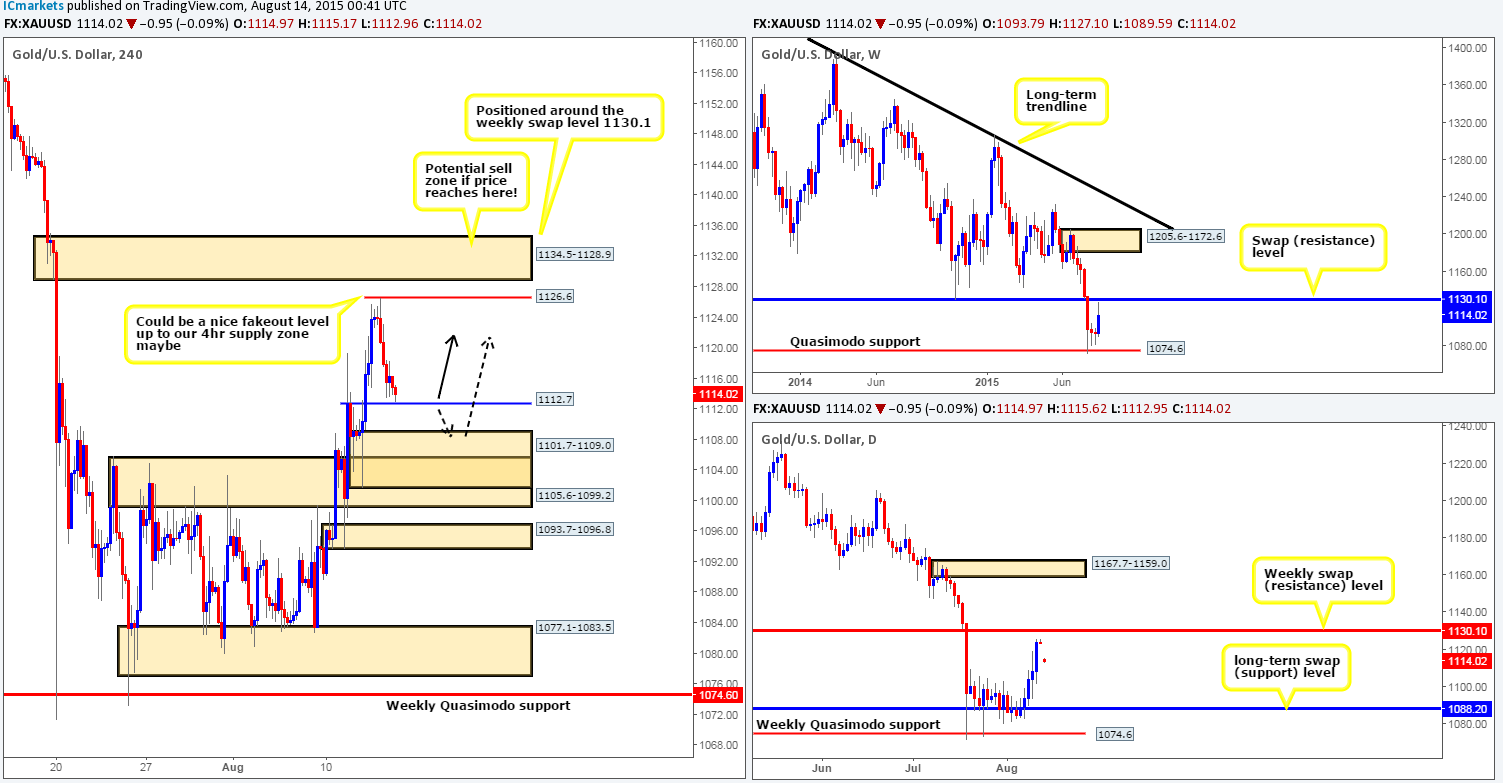
Following four consecutive days of gains on Gold, a steady stream of sellers came into this market yesterday from 1126.6. For those of you who took profit from any longs taken off of the retest at1105.6-1099.2 just before this sell-off – great job, well done!
Although price is currently on the decline at the moment, our original analysis has not changed. We still believe that Goldwants to tag in offers sitting around the 4hr supply zone at 1134.5-1128.9 before continuing to trend south, since it is positioned around a key weekly swap (resistance) level coming in at 1130.1. Therefore, here is our two cents’ worth on where Gold may head to and from today…
Price will likely either use the minor 4hr swap (support) base at 1112.7 as a platform to rebound prices, orfakeout lo below this number to connect up with bids sitting around the 4hr demand zone at 1101.7-1109.0 (as per the black arrows). Targets for any longs taken from either barrier remain the same as in yesterday’s report – the 4hr supply zone at 1134.5-1128.9. The high formed during yesterday’s trade, 1126.6, will likely serve nicely as a fakeout line into our target zone – imagine the buy stops (liquidity) positioned above this high – great for selling into from our 4hr supply zone, no?!
Of course it is trader dependent on how one approaches these potential 4hr buy levels today. We are choosing to play on the side of caution, however, and wait for a lower timeframe buying signal before considering a trade, as either of the above said hurdles could potentially see a reaction.
Levels to watch/ live orders:
- Buys: 1112.7[Tentative – confirmation required] (Stop loss: dependent on where one confirms this level) 1101.7-1109.0[Tentative – confirmation required] (Stop loss: 1100.8).
- Sells: 1134.5-1128.9 [Tentative – confirmation required] (Stop loss: dependent on where one finds confirmation in this area).


