A note on lower timeframe confirming price action…
Waiting for lower timeframe confirmation is our main tool to confirm strength within higher timeframe zones, andhas really been the key to our trading success. It takes a little time to understand the subtle nuances, however, as each trade is never the same, but once you master the rhythm so to speak, you will be saved from countless unnecessary losing trades. The following is a list of what we look for:
- A break/retest of supply or demand dependent on which way you’re trading.
- A trendline break/retest.
- Buying/selling tails – essentially we look for a cluster of very obvious spikes within the higher timeframe zone.
- Candlestick patterns. We tend to only stick with pin bars and engulfing bars as these have proven to be the most effective.
EUR/USD:
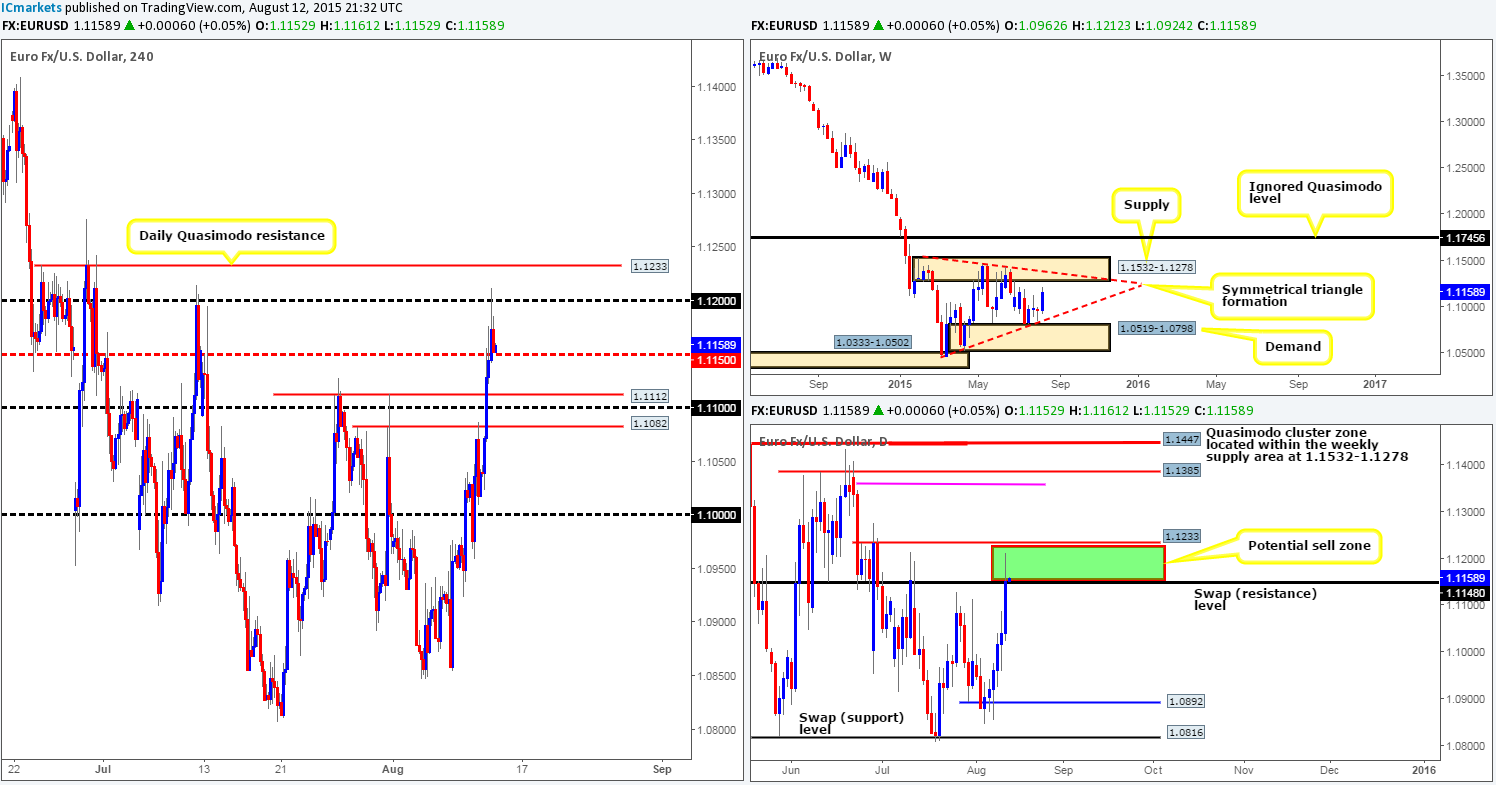
Despite the bounce from the 4hr Quasimodo resistance level at 1.1082, the EUR currency rallied over 150 pips amidst yesterday’s trade. It was only once price crossed paths with the 1.1200 handle in the U.S. afternoon session did we see the sellers begin to make an appearance, consequently pushing prices down to the mid-level number 1.1150.
So, with price now nibbling at bids around this mid-level hurdle, where do we stand in the bigger picture? Well, the weekly scale shows price trading within touching distance of the weekly supply zone at 1.1532-1.1278, while on the daily scale, price is currently standing toe-to-toe with a daily swap (resistance) level at 1.1148. Therefore, shorting this market seems to be the way to go today…
However, with price trading at 1.1150 support, we see very little opportunity to sell into this market right now – even with a break below this number; the next support target is less than 40 pips away at 1.1112! For this reason, today’s plan of attack will consist of waiting to see if prices retrace back up to either 1.1200 or the daily Quasimodo resistance level just above it at 1.1233 to sell. Should we see price hit our areas of interest; lower timeframe confirmation will be needed for two reasons. One, it would be difficult, if not impossible; to know which level will see a reaction, if any.And two, there is always a chance that price may fake above both of these barriers to tag in offers sitting around the lower boundary of weekly supply area mentioned above at 1.1278.
Levels to watch/live orders:
- Buys:1.1000 [Tentative – confirmation required] (Stop loss: dependent on where one confirms this level).
- Sells: Flat (Stop loss: N/A).
GBP/USD:
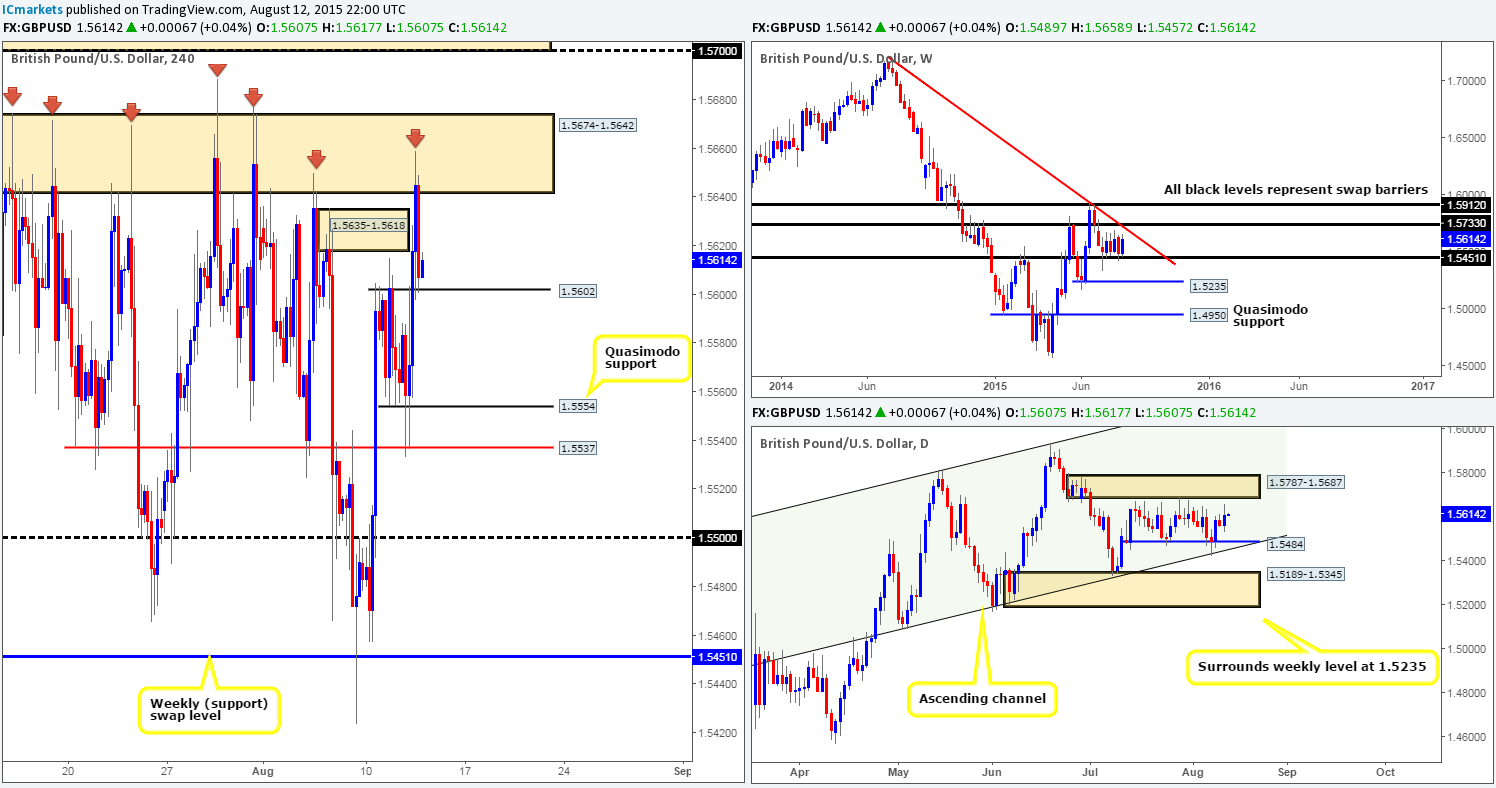
Going into the early hours of the London trading session, price spring boarded itself north from a 4hr swap (support) level coming in at 1.5537. This move, as you can see, took out a 4hr supply area at 1.5635-1.5618 and stabbed into a clear area of 4hr resistance given at 1.5674-1.5642, which has so far held Cable lower.
Given that we’re not receiving much Intel from the higher timeframe structures, other than both are trading mid-range at the moment (weekly between 1.5733/1.5451 – daily between 1.5787-1.5687/1.5484), it is very difficult to judge medium-term direction. With this, our team has come to a general consensus that looking to play for only short-term intraday moves at pre-determined areas of interest is likely the best path to take today:
Potential buy zones:
- 1.5602. Considering that this minor 4hr swap (support) level merges nicely with the round number 1.5600, this barrier could be good for a bounce higher today. However, seeing as there is very little supportive structure below, we’d advise only entering long here if lower timeframe confirmation is seen.
Potential sell zones:
- 1.5674-1.5642. This 4hr base resistance has certainly stood the test of time. One only has to look at how many times this area has held this market lower recently. To that end, one could look to short this zone with confirming lower timeframe price action – the confirmation is needed simply to avoid fakeouts which if you look to the left have already happened.
- Watch for 1.5602 to be consumed and then look to enter on a retest of this number (confirmation required). Support targets come in at 1.5554 and 1.5537.
Levels to watch/ live orders:
- Buys: 1.5602 [Tentative – confirmation required] (Stop loss: dependent on where one confirms this level).
- Sells: 1.5674-1.5642 [Tentative – confirmation required] (Stop loss: dependent on where one confirms this area).Watch for 1.5602 to be consumed and then look to enter on a retest of this number (confirmation required).
AUD/USD:
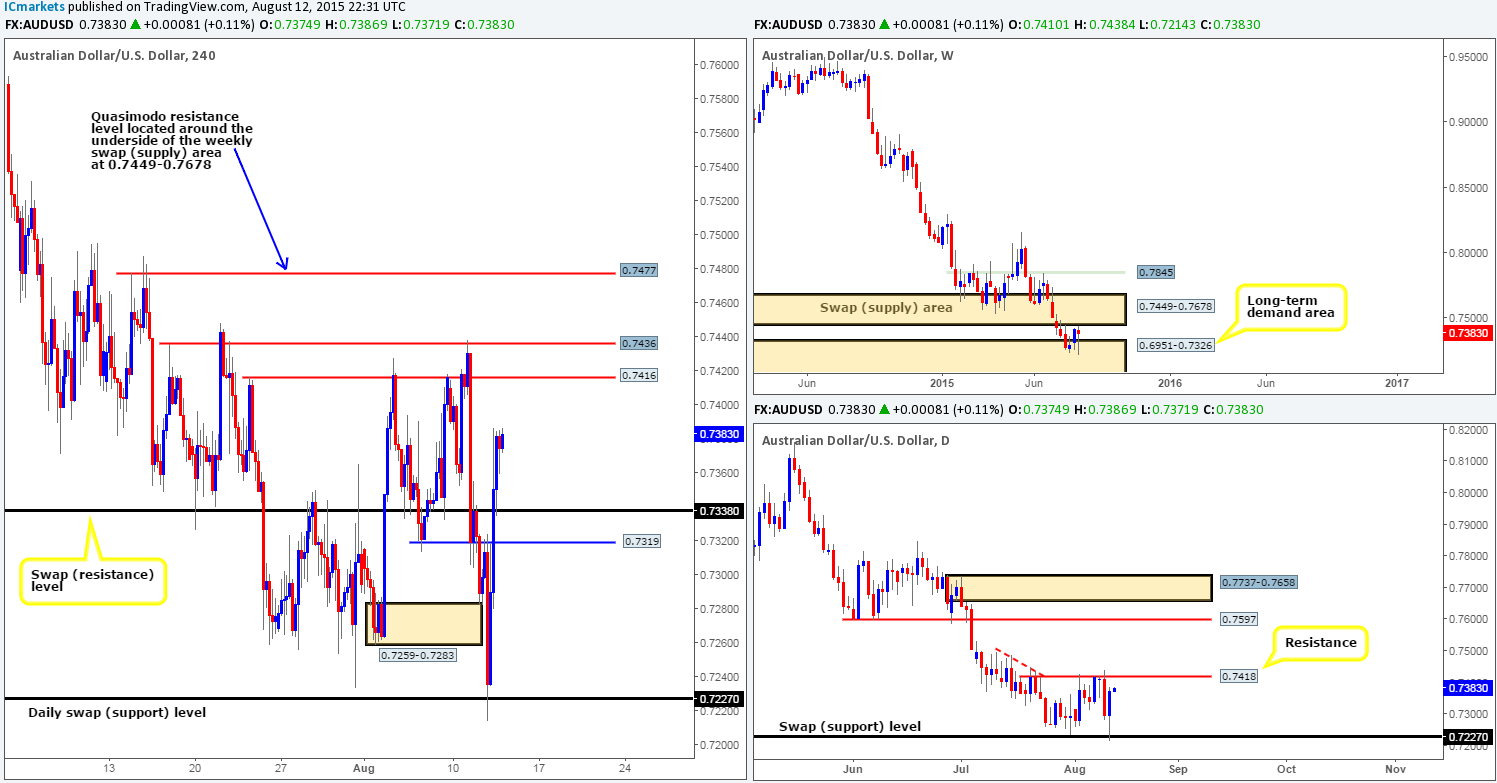
Early on in yesterday’s trade, offers piled into this market from 0.7319 pushing the Aussie dollar below 4hr demand at 0.7259-0.7283 into the daily swap (support) barrier at 0.7227. It was from this point that we saw the buyers come alive, as price aggressively rallied close to 160 pips into the close 0.7374.
Given that price action on the 4hr timeframe is, as far as we can see, trading in no-man’s-land right now, what path do we see this pair most likely taking today? Well, considering that the next upside 4hr resistance (0.7416) falls in just two pips below daily resistance at 0.7418, we feel price will likely continue gravitating north today to connect with offers sitting in and around this zone. However, considering that there are two 4hr Quasimodo resistance barriers lurking just above at 0.7436 and 0.7477, there is the possibility price may ignore 0.7416 and continue on its path north. We say this simply because on the weekly timeframe, price action has yet to connect with the lower limit of the weekly swap (supply) area at 0.7678, which, as you can probably see, lines up nicely with the aforementioned 4hr Quasimodo resistance level at 0.7477 –beautiful confluence to short from!
Taking all of the above into consideration, our bias for the time being remains short. Levels to keep an eye on for CONFIRMED sell trades today are 0.7416, 0.7436 and 0.7477.
Levels to watch/ live orders:
- Buys: Flat (Stop loss: N/A).
- Sells: 0.7416/0.7436/0.7477 [Tentative – confirmation required] (Stop loss: dependent on where one finds confirmation at these levels).
USD/JPY:
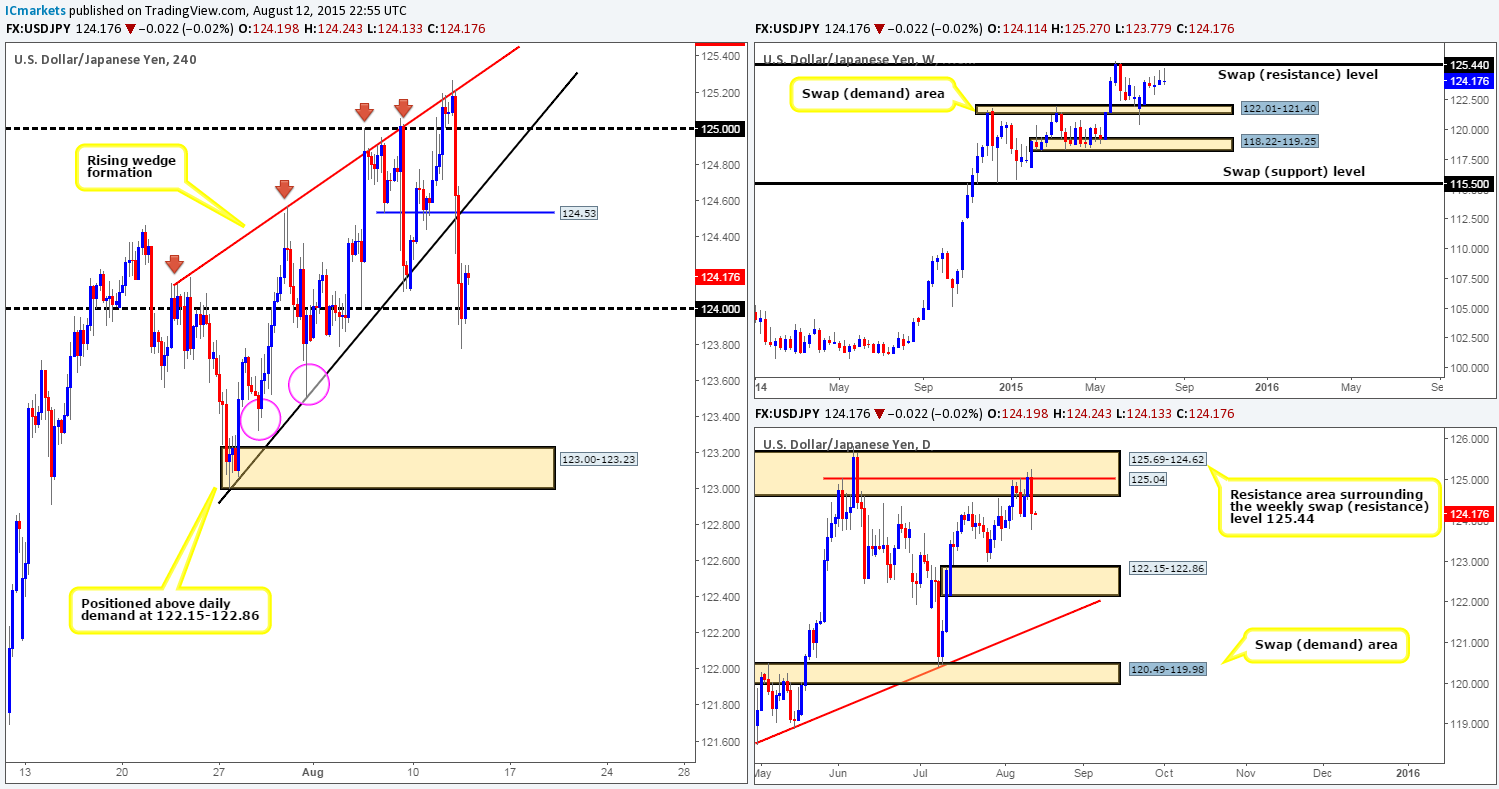
Beginning with the weekly timeframe this morning, we can see that another selling tail (pin-bar candle) is currently in the process of forming just below the weekly swap (resistance) level at 125.44. Meanwhile, on the daily timeframe, yesterday’s action painted a bearish engulfing candle from the underside of a daily Quasimodo resistance level at 125.04 (located deep within a daily resistance area at 125.69-124.62), consequently wiping out any gains the market has accrued so far this week.
Looking at the 4hr chart, the recent descent has not only forced price to break out below the 4hr rising wedge formation (123.00/124.14), but it has also taken out several other 4hr technical barriers along the way. As of writing, price appears to have drawn support from the low 123.79 printed on the 04/08/15, which, as you can see, has pushed prices back above the recently breached 124.00 handle.
With all of the above in mind, we feel that this buying from 123.79 may have been shorts covering positions into the daily close 124.19 – the most we see prices rallying to is around the 124.53 region. That being the case, there may very well be a continuation move south going into to today’s more liquid sessions down to 4hr demand coming in at 123.00-123.23. The reasoning behind believing prices could drop this far comes from the following:
- Weekly chart shows space for prices are free to move lower down to the weekly swap (demand) area at 122.01-121.40.
- Daily chart also shows space for prices to continue lower down to the daily demand area coming in at 122.15-122.86.
- Bids around the round number level 124.00 are very likely weak at this point.
- The demand consumption tails painted to the left (pink circles) at 123.51/123.32 suggests that below 124.00, the path south is clear of major bids until the aforementioned 4hr demand zone.
To trade this potential down move, however, we’d need to see a break/retest of 124.00 along with corresponding lower timeframe selling confirmation.
Levels to watch/ live orders:
- Buys:Watch for 124.00 to be consumed and then look to enter on a retest of this number (confirmation required).
- Sells: Flat (Stop loss: N/A).
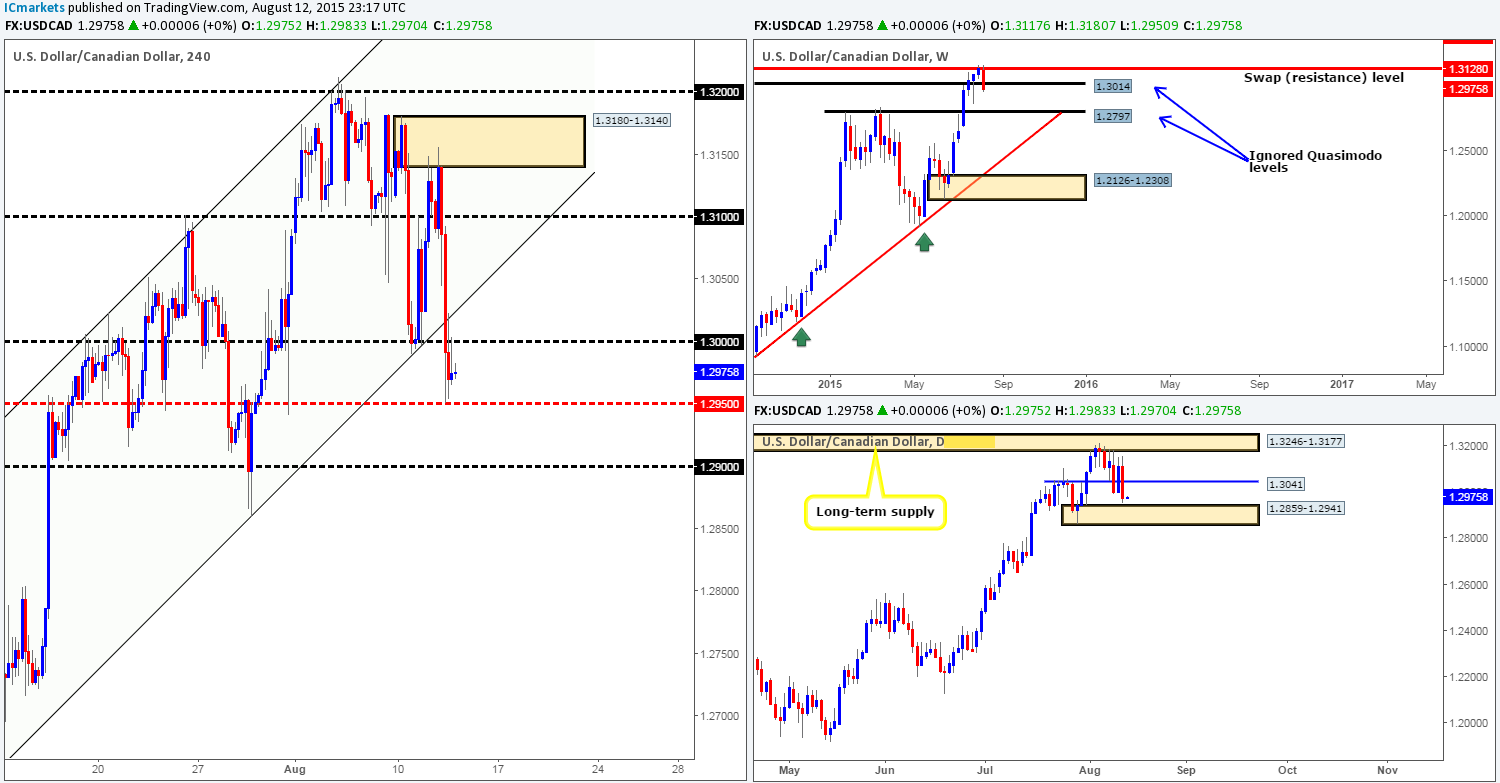
USD/CAD:
Offers around the 4hr supply zone at 1.3180-1.3140 were clearly too strong for any bids attempting to defend the psychological support 1.3100 yesterday. Once 1.3100 was consumed, price then sharply dropped lower, closing below both the 4hr ascending channel support (1.2652/1.3023) and round number 1.3000. It was only once price tested bids at the mid-level number 1.2950 did we see price action begin to steady.
With price now capped between 1.2950 and 1.3000, it is very difficult to judge direction until a breakout is seen. Let’s see what we can find on the higher timeframes… The weekly chart shows price once again is trading just below the weekly ignored Quasimodo level at 1.3014, while daily action reveals price is trading within shouting distance of daily demand coming in at 1.2859-1.2941. This – coupled with the fact that the trend on this pair is still firmly pointing north, we believe a break above 1.3000 is more likely. In the event that this does come to fruition, this would possibly expose the underside of the recently broken 4hr ascending channel, and also 1.3100. In order for us to be given the green light to trade this potential 80-100 pip move, however, we’d require a confirmed retest of 1.3000 before risking capital on this idea.
Levels to watch/ live orders:
- Buys: Watch for 1.3000 to be consumed and then look to enter on a retest of this number (confirmation required).
- Sells:Flat (Stop loss: N/A).
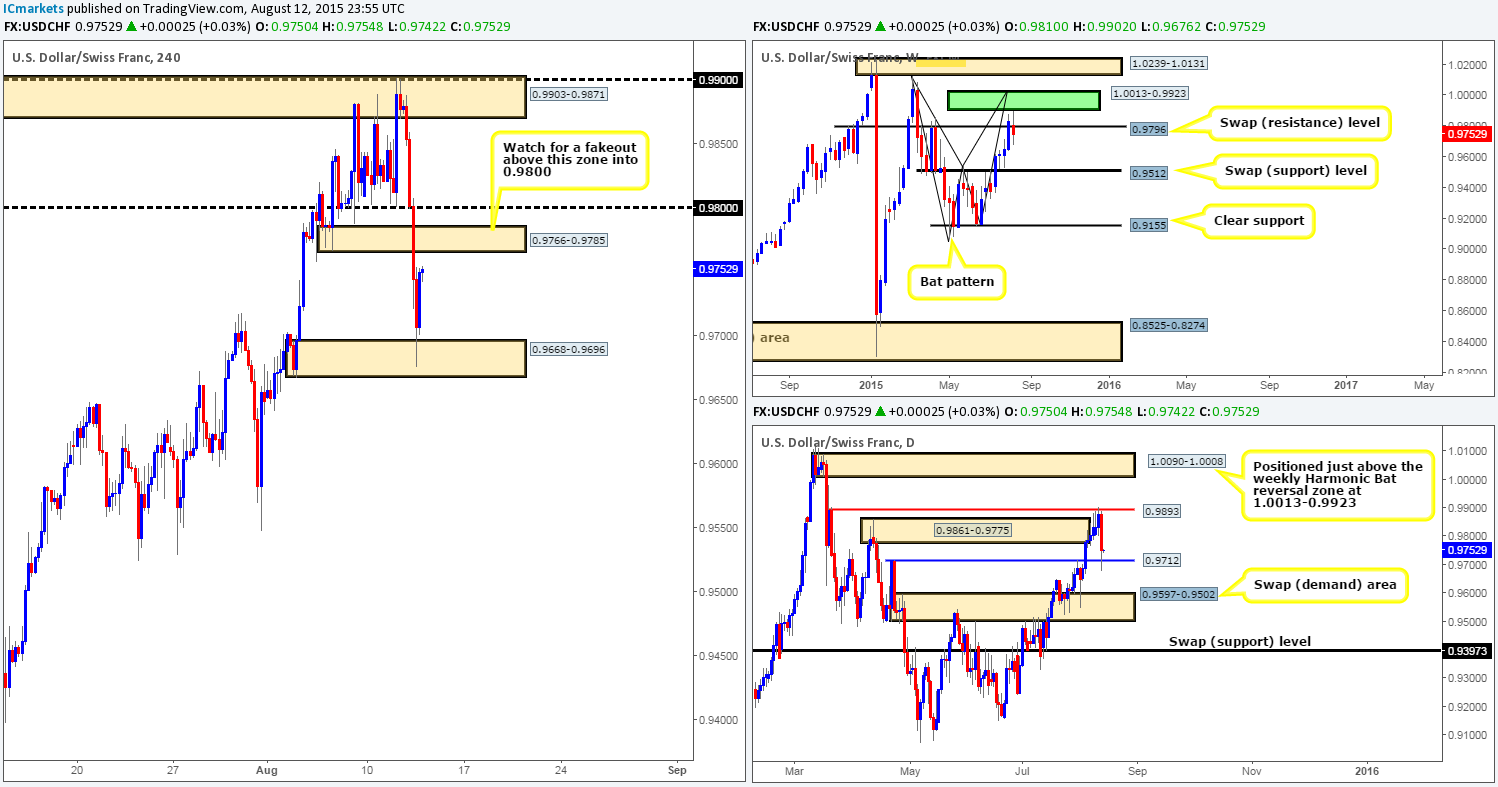
USD/CHF:
The USD/CHF pair, as you can see, took an absolute beating throughout yesterday’s sessions. 0.9800 psychological support and the 4hr demand zone at 0.9766-0.9785 were completely obliterated. It was only once price shook hands with 4hr demand at 0.9668-0.9696 did we see the market begin to reverse. At the time of writing, the rebound seen from this 4hr demand has brought prices up to below the recently broken 4hr demand which is now acting supply at 0.9766-0.9785.
With that, would we consider this 4hr swap (supply) zone a sellable area today? Yes we would. Here’s why…The weekly timeframe action is currently being held lower by a weekly swap (resistance) level at 0.9796 with room seen for price to continue south. Our concerns about shorting from here, however, come from price recently rebounding from a daily swap (support) level at 0.9712, and also a round-number resistance level lurking just above our 4hr sell zone at 0.9800. Therefore, even though we deem 0.9766-0.9785 a sell zone, we are expecting it to be faked up to 0.9800 from the buying momentum off of the aforementioned daily swap (support) level – waiting for lower timeframe selling confirmation here is a MUST for us before we’d consider committing funds to this short trade.
Levels to watch/ live orders:
- Buys: Flat (Stop loss: N/A).
- Sells:0.9766-0.9785 [Tentative – confirmation required] (Stop loss: dependent on where one confirms this area since a fakeout could be seen above to 0.9800).
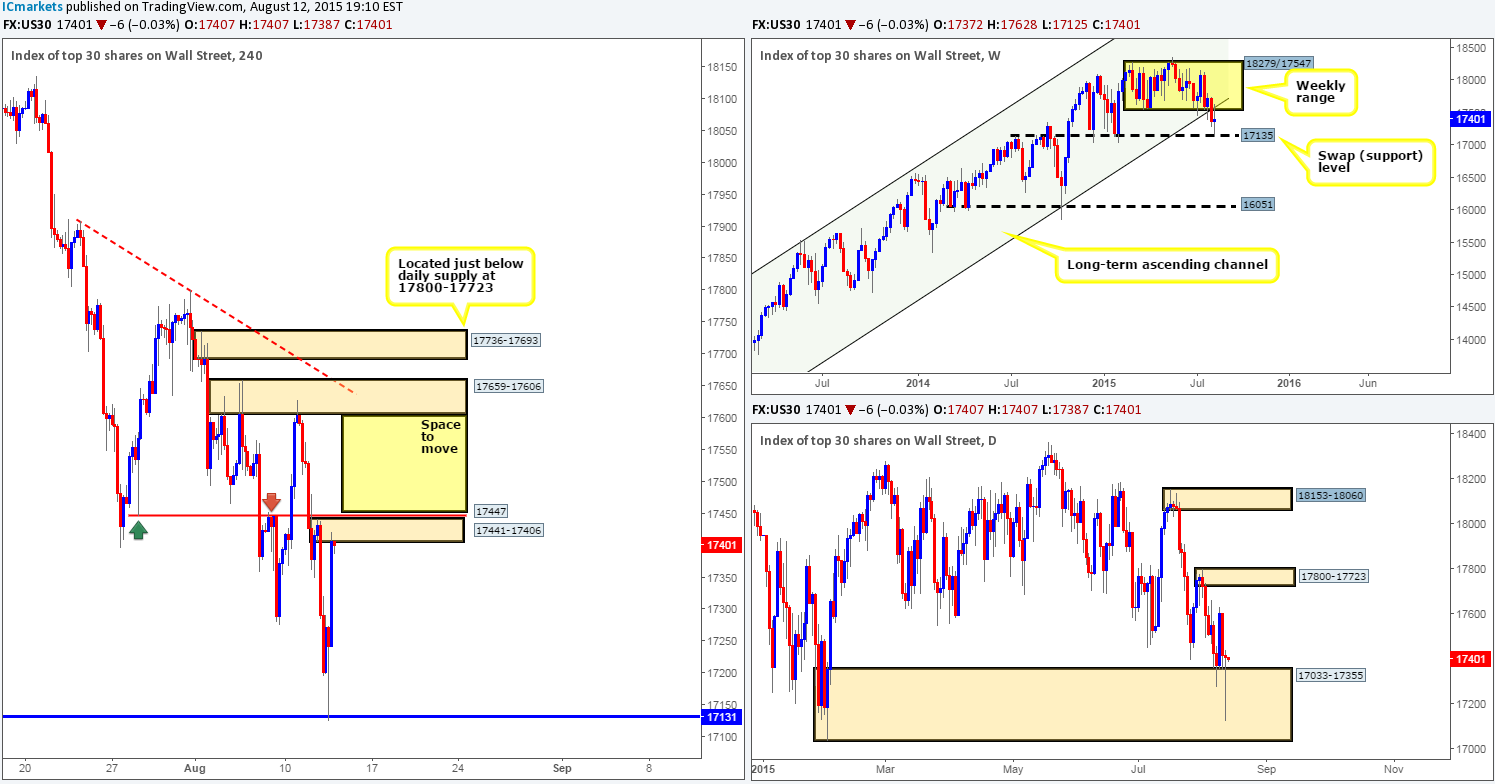
DOW 30:
Using a top-down approach this morning, it is clear to see that price has now hit and rebounded from the weekly swap (support) level coming in at 17135. This also, as you can probably see, painted a nice looking bullish daily pin-bar candle around daily demand sitting at 17033-17355.
The viewpoint from the 4hr timeframe, nonetheless, shows price reacted beautifully from the 4hr Quasimodo support level at 17131 – we do hope some of our readers remembered to note this level down, as this was actually a barrier we highlighted a few days ago for potential buy trades! The upsurge seen from this level consequently pushed price into a small 4hr supply zone coming in at 17441-17406 which is so far holding firm. Given that both the daily and weekly timeframes indicate further buying is possible, this 4hr supply zone and the 4hr swap (resistance) level just above it at 17447 are all what’s standing in the way to a move higher up to at least 17659-17606 – a 4hr resistance base.
Therefore, with the higher timeframes supporting a further advance, we have no interest whatsoever in shorting the current 4hr supply area. Instead, we’re going to patiently wait and see if price can close above the two 4hr areas just mentioned. Should this come to fruition and price retests the violated zones as support, we’d very likely consider buying this market as long as there is some sort of lower timeframe confirming buy signal seen following the retest.
Levels to watch/ live orders:
- Buys: Watch for 17441-17406/17447 to be consumed and then look to enter on a retest of this area (confirmation required).
- Sells:Flat (Stop loss: N/A).
XAU/USD: (Gold)
For those who read our previous report on our favorite yellow metal http://www.icmarkets.com/blog/wednesday-12th-august-daily-technical-outlook-and-review/ you may recall that we mentioned that there may be a long opportunity boiling up on the retest of the 4hr supply – turned demand at 1105.6-1099.2, targeting the 4hr supply zone at 1134.5-1128.9. As you can see, this has played out as expected. Well done to any of our readers who are currently logged in on this long position!
Once, or indeed if price reaches target today, this would not only be a cool place to close any longs that you may have, but it would also be an excellent opportunity to begin hunting shorts, since let’s not forget that this area is located around a clear weekly (swap) resistance level at 1130.1.
We definitely expect some tricks to be played around this 4hr supply area in the form of some very nasty fakeouts, as such, we would advise only entering short if you spot lower timeframe sellers gaining strength i.e. a demand area engulfed, a trendline break/retest, or even simply a bearish pin bar with space to move south…

Levels to watch/ live orders:
- Buys: Flat (Stop loss: N/A).
- Sells: 1134.5-1128.9 [Tentative – confirmation required] (Stop loss: dependent on where one finds confirmation in this area).


