
Key risk events today:
US Core PPI m/m and PPI m/m; US Prelim UoM Consumer Sentiment; BoE’s Bailey due to speak at the UBS online conference.
(Previous analysis as well as outside sources – italics).
EUR/USD:
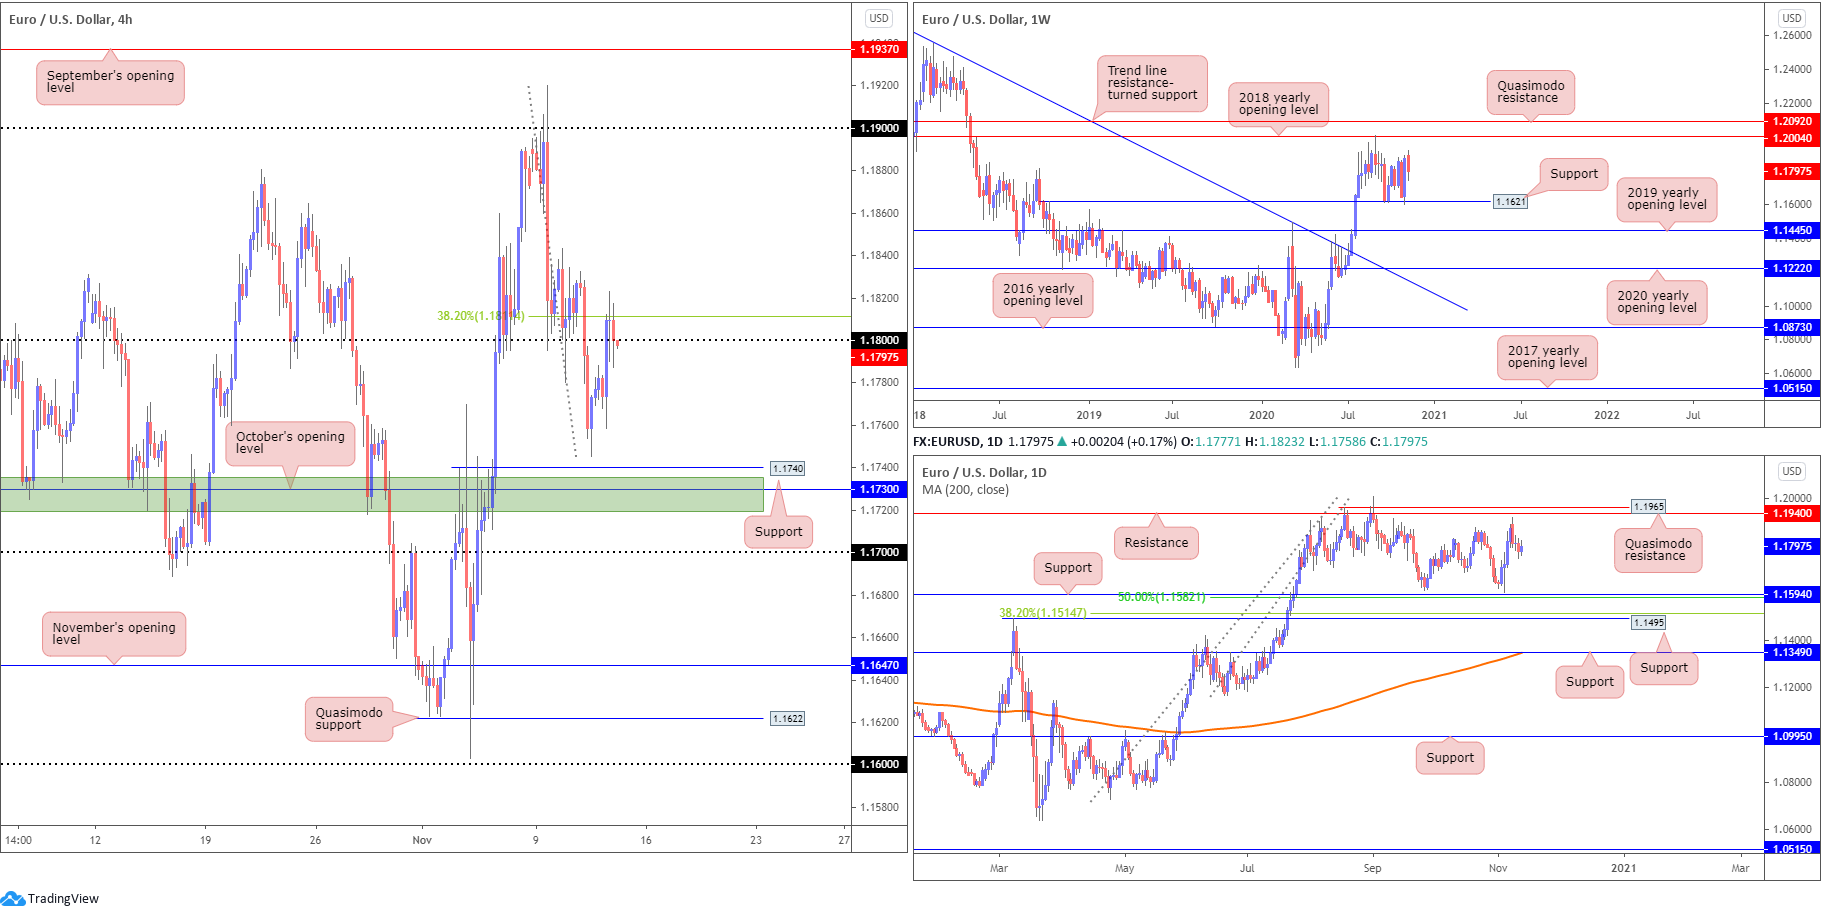
EUR/USD, as you can see, chalked up a modest recovery on Thursday, swinging to peaks at 1.1823.
Despite the US dollar index finishing somewhat undecided, EUR/USD attempted to regain control of space north of 1.18 on the H4 yesterday though struggled to handle the 38.2% Fibonacci retracement ratio at 1.1811. Buy-stop liquidity above the round number along with willing sellers off 1.1811 fuels possible downside moves today, targeting Wednesday’s low at 1.1745, followed by support at 1.1740 (a previous Quasimodo resistance), as well as a support zone (green) around 1.1719-1.1735 and October’s opening value at 1.1730.
Elsewhere, the Higher timeframes show weekly price attempting to reclaim last week’s 2% advance, threatening a possible retest at 1.1621 support. Should buyers eventually regain consciousness, however, keep an eye on the 2018 yearly opening value at 1.2004, closely shadowed by Quasimodo resistance priced at 1.2092. Trend traders may also acknowledge July’s trend line resistance break, taken from the high 1.2555, on top of the break of the 1.1495 March 9 swing high.
A closer reading of price action on the daily timeframe reveals the unit snapped a four-day bullish phase on Monday, ahead of resistance at 1.1940 and Quasimodo resistance at 1.1965, with price continuing to languish south of the resistances throughout the week. Support at 1.1594, and nearby 50.0% retracement ratio at 1.1582, reside as the next downside targets should further selling take shape.
Areas of consideration:
- The 38.2% Fibonacci retracement ratio at 1.1811 offers resistance on the H4, together with buy-stop liquidity above the round number 1.18.
- October’s opening value at 1.1730 and connecting H4 areas form a support to be aware of, though do take into account no higher timeframe support exists here. The same holds true for the 1.17 handle on the H4.
- Continued buying today, nonetheless, may welcome breakout buyers into the fold north of 1.1811 on the H4, targeting the 1.19 region.
GBP/USD:
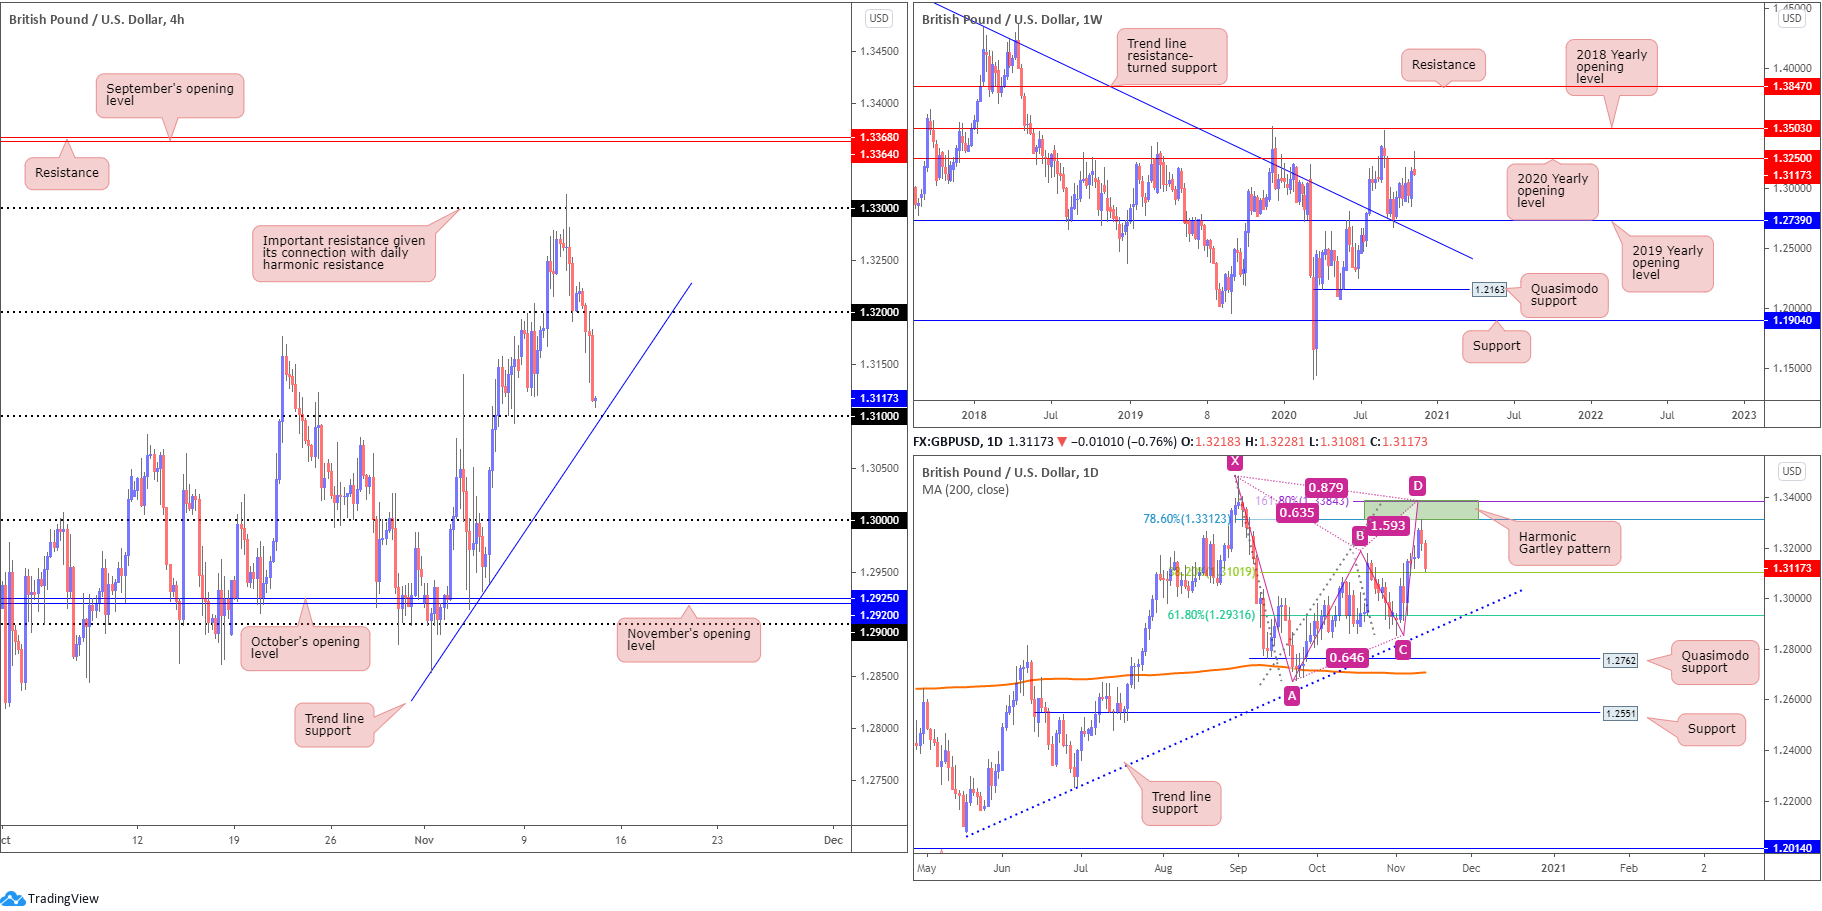
Cable succumbed to the general bearish mood on Thursday and lingering threat of no-deal Brexit.
For those who read Thursday’s technical briefing you may recall the following (italics):
As evident from the charts this morning, we mildly surpassed 1.33 to test (to-the-pip) the underside of the daily bearish harmonic Gartley pattern’s PRZ at 1.3384/1.3312 before turning lower on Wednesday. Traders short the daily PRZ perhaps have the 38.2% Fibonacci retracement ratio at 1.3101 in sight as an initial take-profit target (arranged from legs A-D of the Gartley).
As clear from the daily timeframe this morning we’re closing in on the 38.2% Fibonacci retracement ratio at 1.3101, and 1.31 handle on the H4 (in addition to trend line support, extended from the low 1.2853). Also an interesting feature in the GBP/USD space is weekly price fading the 2020 yearly opening value at 1.3250, on track to establish a shooting star candle pattern.
Areas of consideration:
- Sellers short this market are likely targeting the 1.31 region/H4 trend line support as an initial take-profit target today. Trend lines usually attract attention on GBP/USD, particularly if combined with other technical tools (buyers, therefore, may try to make a move here).
- If 1.31 gives way, the next take-profit target for current sellers, arranged from legs A-D of the daily harmonic Gartley pattern, can be found at the 61.8% Fibonacci retracement ratio at 1.2931. However, before reaching this far south, the key figure 1.30 (H4) must be overthrown.
AUD/USD:
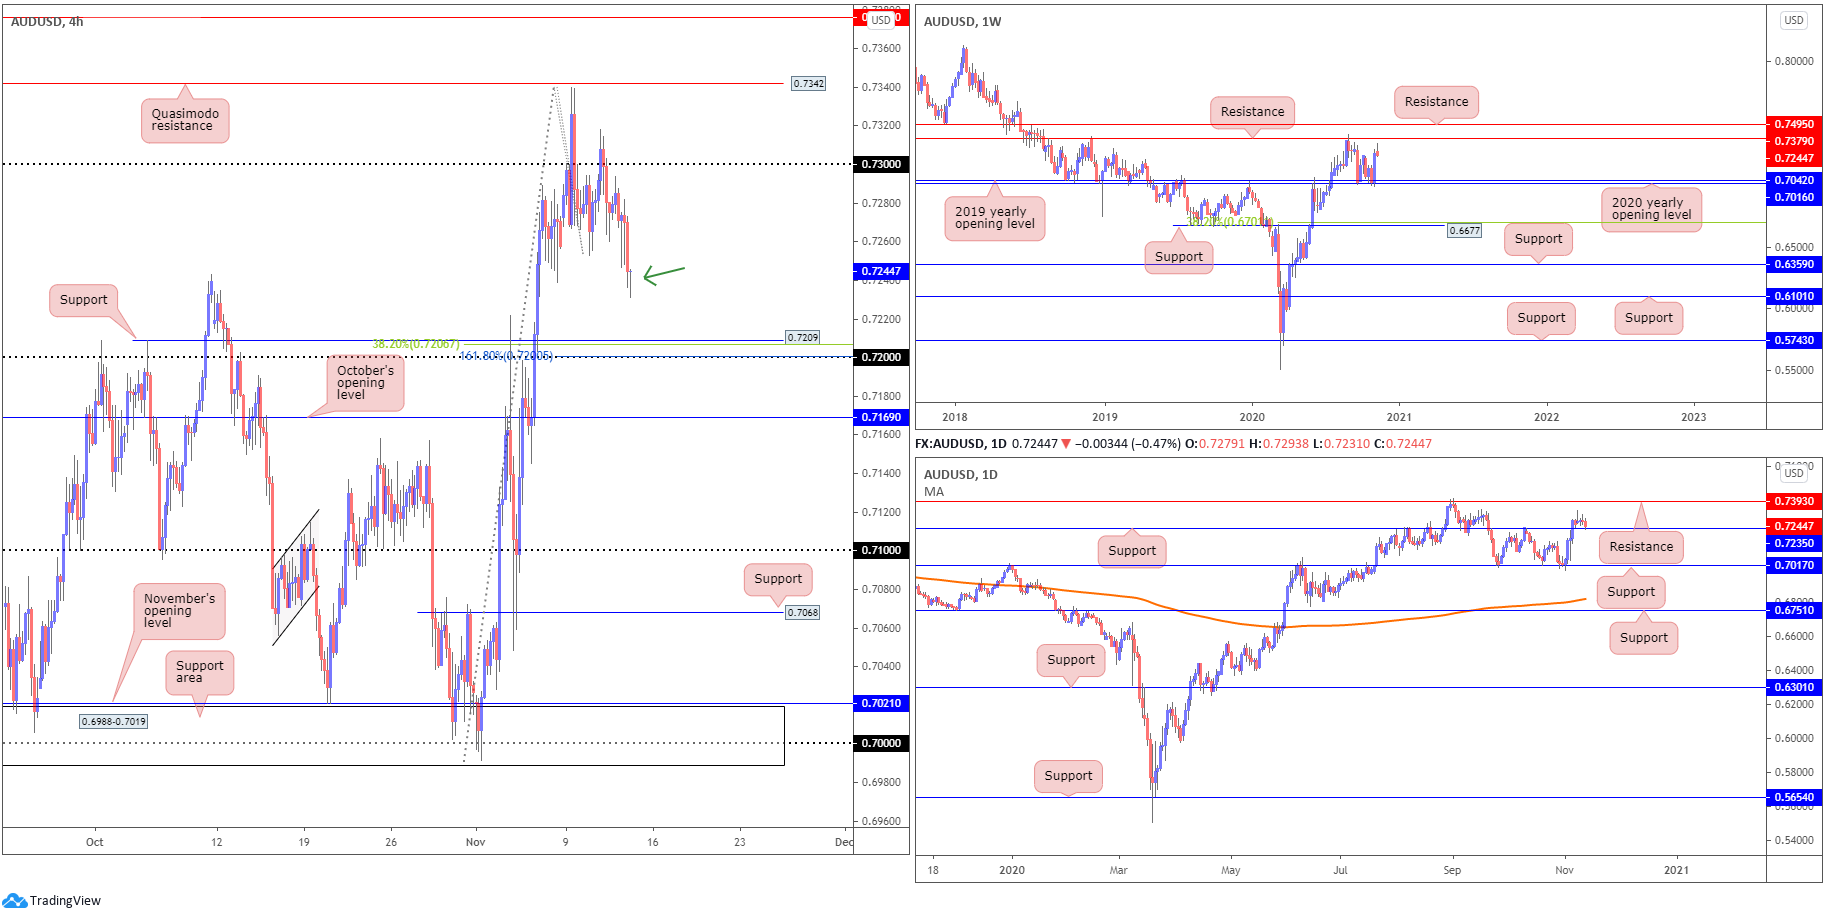
The risk-sensitive Australian dollar depreciated against the US dollar on Thursday, in-line with a broad decline across global equities.
AUD/USD’s technical framework, according to the H4 chart, reveals price action potentially has eyes for lower levels today, at least until shaking hands with support at 0.7209 and the 0.72 handle, as well as a 38.2% Fibonacci retracement ratio at 0.7206 and a 161.8% Fibonacci projection point at 0.7200.
While lower levels are also a possibility on the weekly chart after turning lower just south of resistance at 0.7379, support on the daily scale at 0.7235 could prove problematic for bearish themes and, ultimately, attract buyers on the back of the current trend in this market pointing higher since early 2020.
Areas of consideration:
- Should the current H4 candle close as is – that is in the shape of a hammer candle pattern (or some might say dragonfly doji) – buyers may emerge off daily support at 0.7235 today, targeting at least 0.73.
- Further selling, on the other hand, targets H4 support at 0.7209 and the 0.72 handle (in addition to associated Fibonacci levels), an area which may entice buyers. Though if this area fails, bearish scenarios could develop to October’s opening value at 0.7169 on the H4, and possibly the 0.71 handle.
USD/JPY:
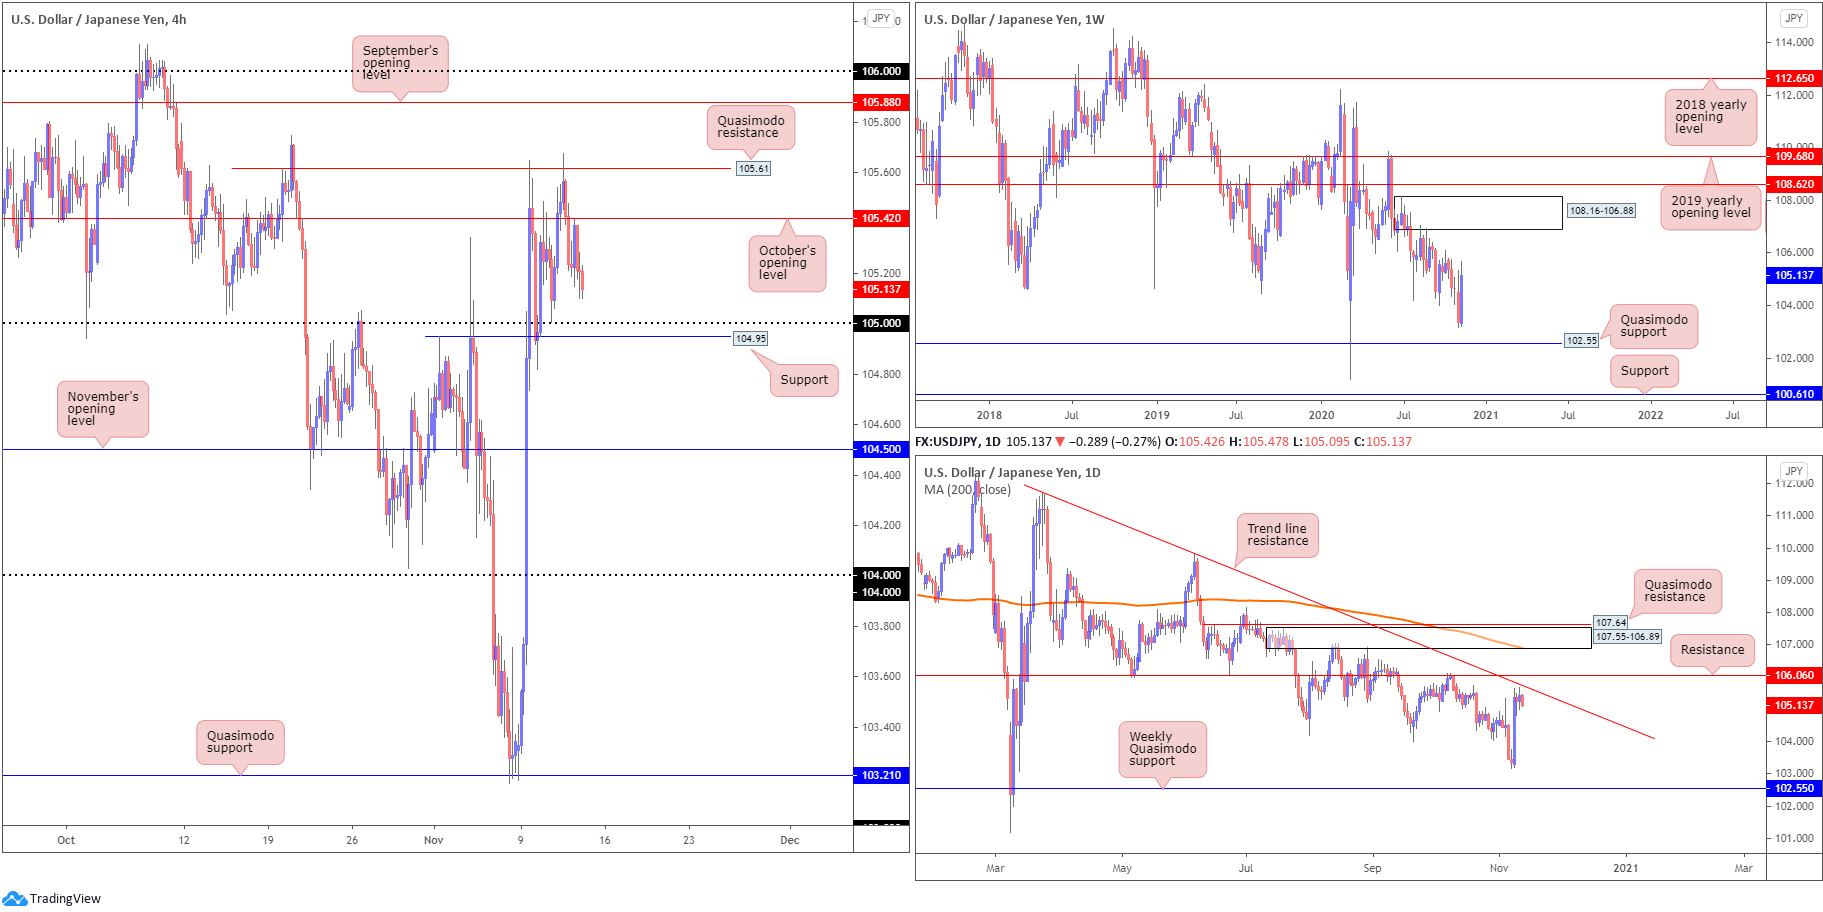
The US dollar trimmed recent gains against the Japanese yen on Thursday, as the latter found demand amid risk aversion.
H4 Quasimodo resistance from 105.61, as evident from the chart, held into Wednesday’s close, forcing Thursday through October’s opening value at 105.42 to place technical eyes back on the 105 handle and support derived from 104.95. South of these levels, the river appears relatively ripple free until November’s opening value priced in at 104.50.
The weekly timeframe has supply at 108.16-106.88 on its radar, with Quasimodo support priced in at 102.55 to the south of price. Price action on the daily timeframe, on the other hand, is exhibiting signs of bearish pressure within striking distance of neighbouring trend line resistance, extended from the high 111.71, followed by resistance at 106.06.
Areas of consideration:
- Ultimately, chart studies suggest a test of at least daily trend line resistance could occur before exploring levels below the 105 region on the H4. However, given we’ve effectively trended lower since March of this year, should a H4 close beneath the latter come to fruition, bearish scenarios could still surface to target at least November’s opening value priced in at 104.50.
- 105 also remains a support to be mindful of, representing a possible bullish platform having noted higher timeframe resistances have yet to be tested.
USD/CAD:
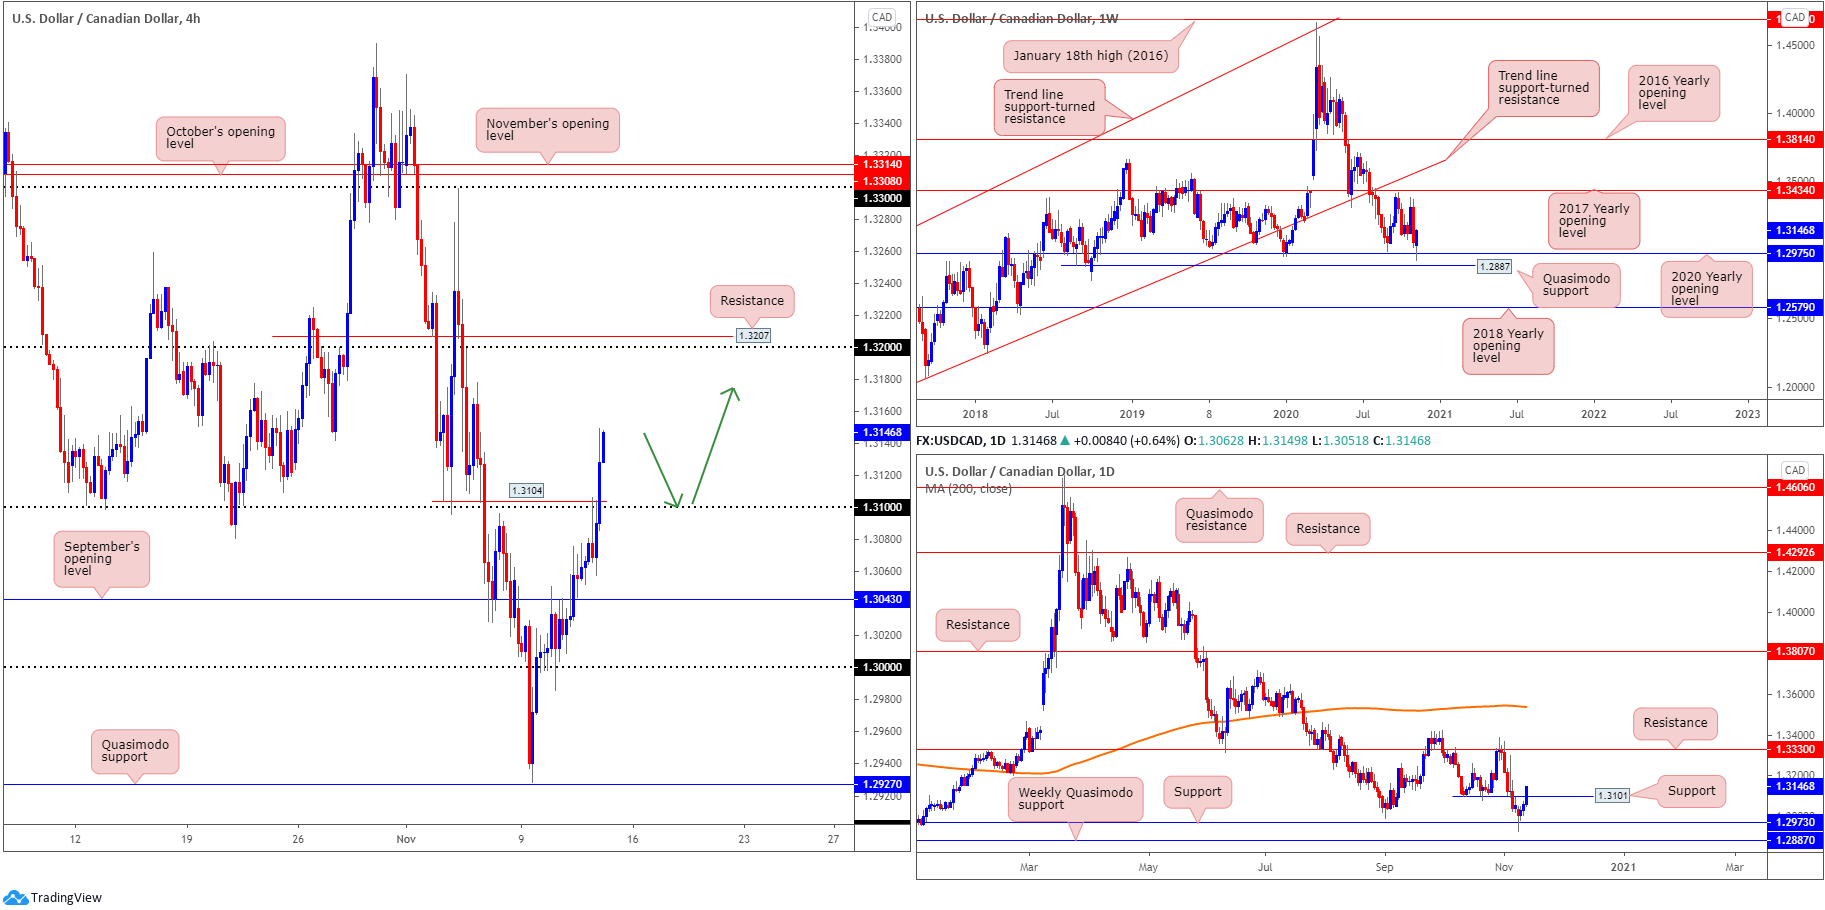
With oil prices navigating deeper ground on Thursday, weighing on the Canadian dollar, USD/CAD bulls entered an offensive phase. Following a brief reaction from H4 resistance at 1.3104/the 1.31 handle, the pair mustered enough strength to overthrow 1.31 and test highs at 1.3149. In terms of resistance, 1.32 and 1.3207 offer reasonable possibilities on the H4 scale.
Discovering support off the 2020 yearly opening value at 1.2975 on the weekly timeframe, a level tailed by Quasimodo support priced in at 1.2887, could fuel further buying and eventually see the 2017 yearly opening value at 1.3434 enter the fray. However, it should be noted that this market has traded lower since topping at 1.4667 in early 2020.
The daily timeframe, in conjunction with weekly price rebounding from support at 1.2975, recently brushed aside resistance at 1.3101 (now possible support), with further buying possibly reaching for resistance coming in at 1.3330.
Areas of consideration:
- Retesting 1.31 on the H4 is a possible scenario. Having highlighted space to climb higher on the bigger picture, buyers may welcome this setup, particularly if formed in the shape of a H4 bullish candlestick pattern.
- H4 resistance made up of 1.3207/1.32 are likely to call for attention should buyers remain in the driving seat. Though it is worth recognising that limited higher timeframe resistance is present here. In fact, higher timeframe resistance is not expected to emerge until around the 1.33ish range.
USD/CHF:
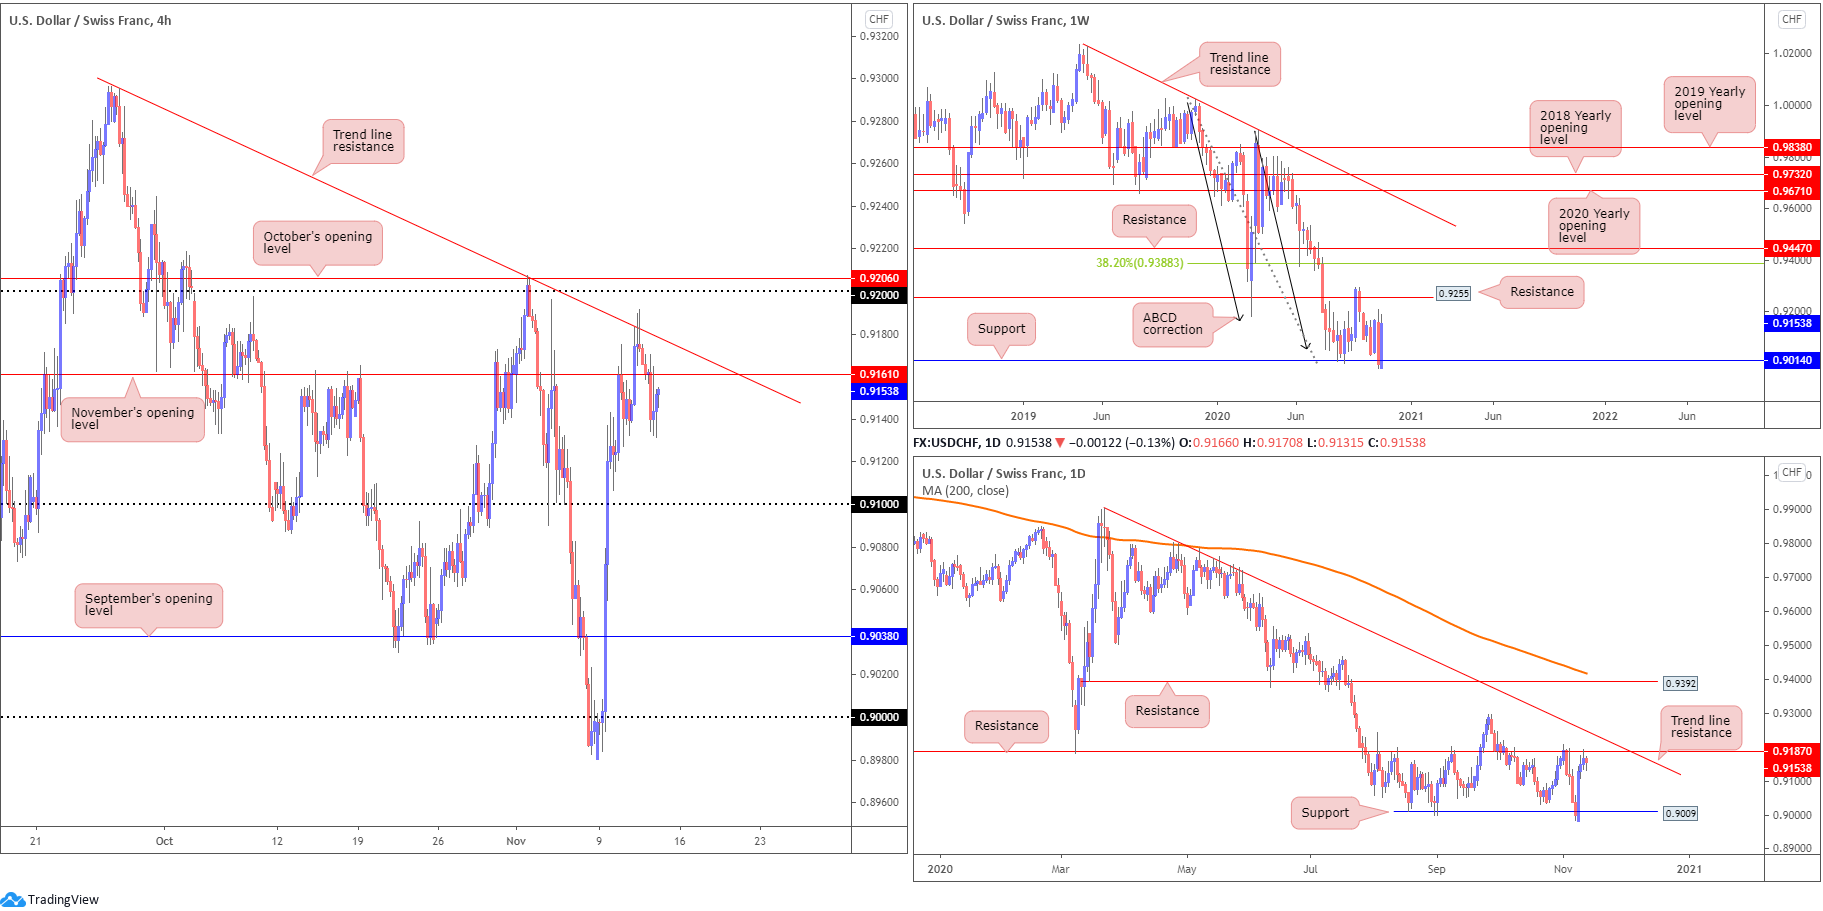
USD/CHF snapped a three-day bullish phase on Thursday, extending the H4 retracement slide south of trend line resistance, taken from the high 0.9295. North of the aforementioned trend line resistance, the 0.92 handle is present, sheltered just under October’s opening value at 0.9206.
As you can see, this nudged price beneath November’s opening value at 0.9161 to session lows at 0.9131, though US hours staged a modest recovery. This positions 0.9161 back in range as possible resistance today, with 0.91 perhaps targeted should bearish flow takeover.
Further out on the weekly timeframe, traders will acknowledge we remain heavily bid off support at 0.9014, a level dovetailing closely with ABCD support at 0.9051 (black arrows). 0.9255 resistance (a prior Quasimodo support) is next in the firing range should buyers continue to support this market.
From the daily timeframe, however, we are, following a decisive recovery off Quasimodo support at 0.9009 on Monday, now crossing swords with resistance at 0.9187. Beyond here, assuming weekly players continue to push higher, traders will likely recognise nearby trend line resistance, taken from the high 0.9901, which happens to merge with weekly resistance at 0.9255.
Areas of consideration:
- H4 trend line resistance (0.9295), having seen the descending structure converge with daily resistance at 0.9187, could fuel additional weakness today, targeting 0.91 on the H4. A 0.9161 retest on the H4 may also prove appealing for sellers.
- 9206 (October’s opening value) and the 0.91 handle might also be viewed as interesting resistance on the H4.
- Weekly resistance at 0.9255 offers a longer-term ceiling, strengthened on the back of daily trend line resistance (0.9901).
Dow Jones Industrial Average:
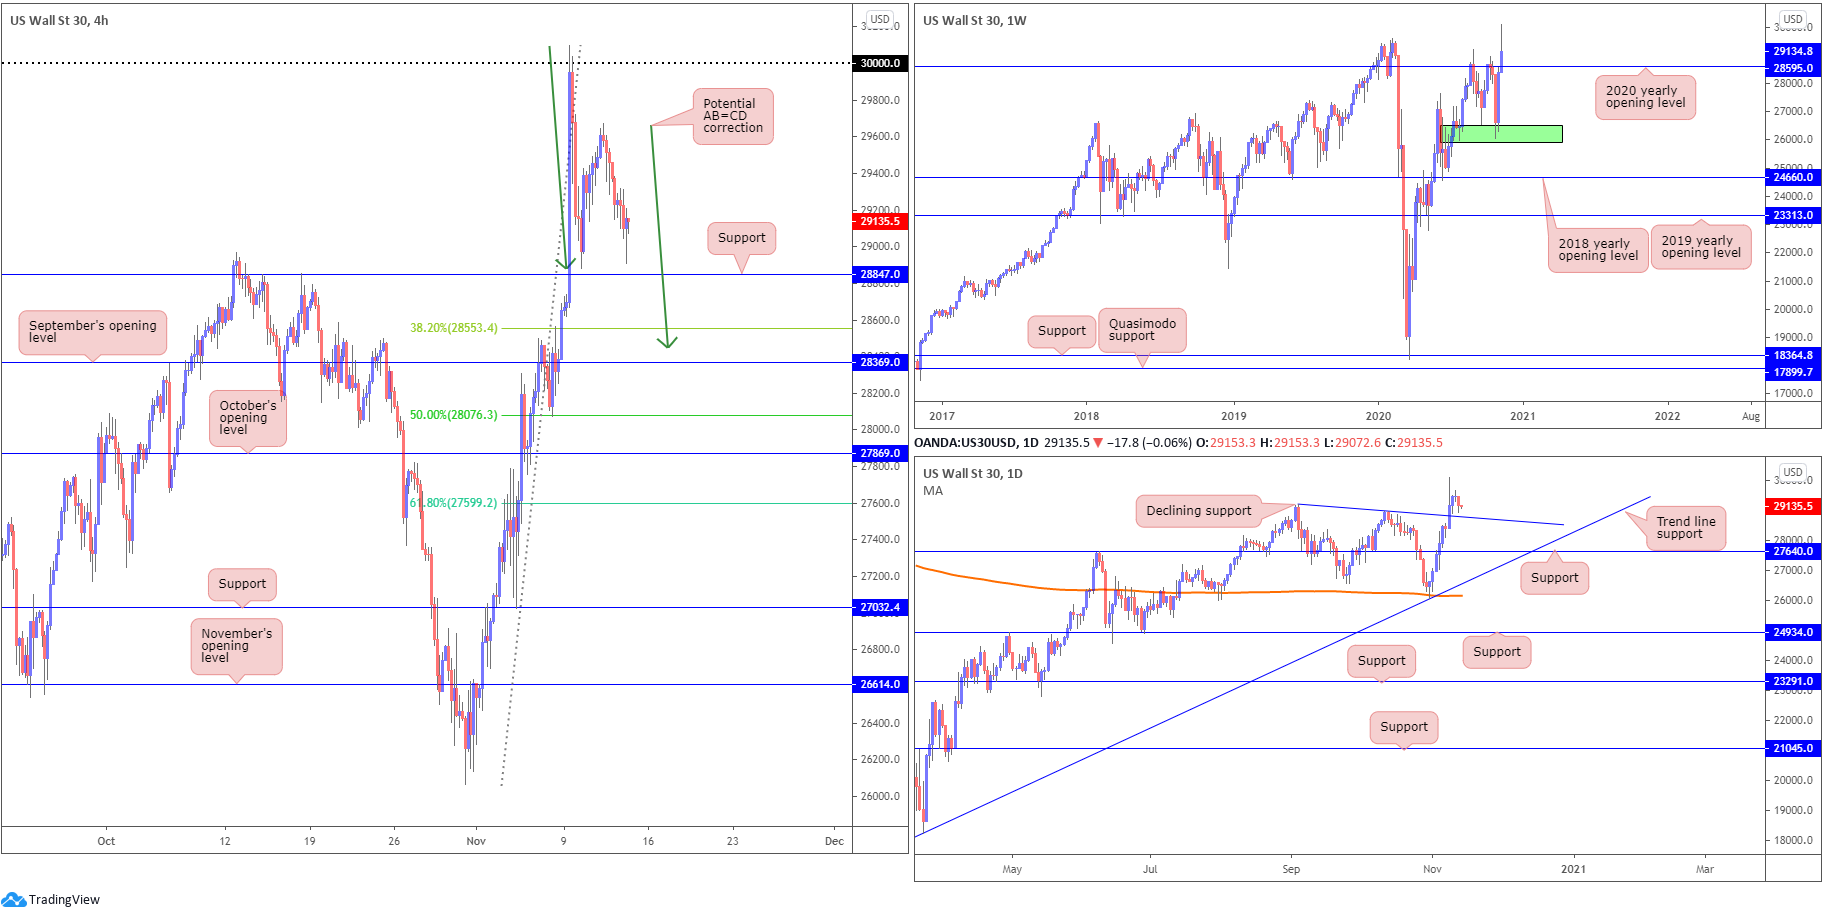
Major US equity indexes entered a defensive phase Thursday amidst increasing COVID-19 cases. The Dow Jones Industrial Average shed 317.46 points, or 1.08%, the S&P 500 traded lower by 35.65 points, or 1.00%, and the Nasdaq ended lower by 76.84 points, or 0.65%.
Technically, on the H4 scale, 30000 represents resistance while yesterday’s decline moved light to support around 28847, with a break exposing the 38.2% Fibonacci retracement ratio at 28553, followed by September’s opening value at 28369. In addition, ABCD support can be found around 28450 (green arrows).
From the weekly timeframe, price hovers north of the 2020 yearly opening value at 28595, slightly off fresh all-time peaks at 30097. This follows last week’s 6.7% advance from demand at 25916-26523 (green).
Price action on the daily timeframe has declining support in view, taken from the high 29193. Should a break of here come to pass, support at 27640 is seen.
Areas of consideration:
Outlook largely unchanged.
- Forming fresh all-time highs, as highlighted in recent analysis, will likely excite buyers.
- As a result, dip-buying opportunities remain on the table from H4 support at 28847. Failure to hold, buyers’ crosshairs may switch to the 38.2% H4 Fibonacci retracement ratio seen at 28553, joined closely by H4 ABCD support around 28450 and September’s opening value at 28369.
XAU/USD (GOLD):
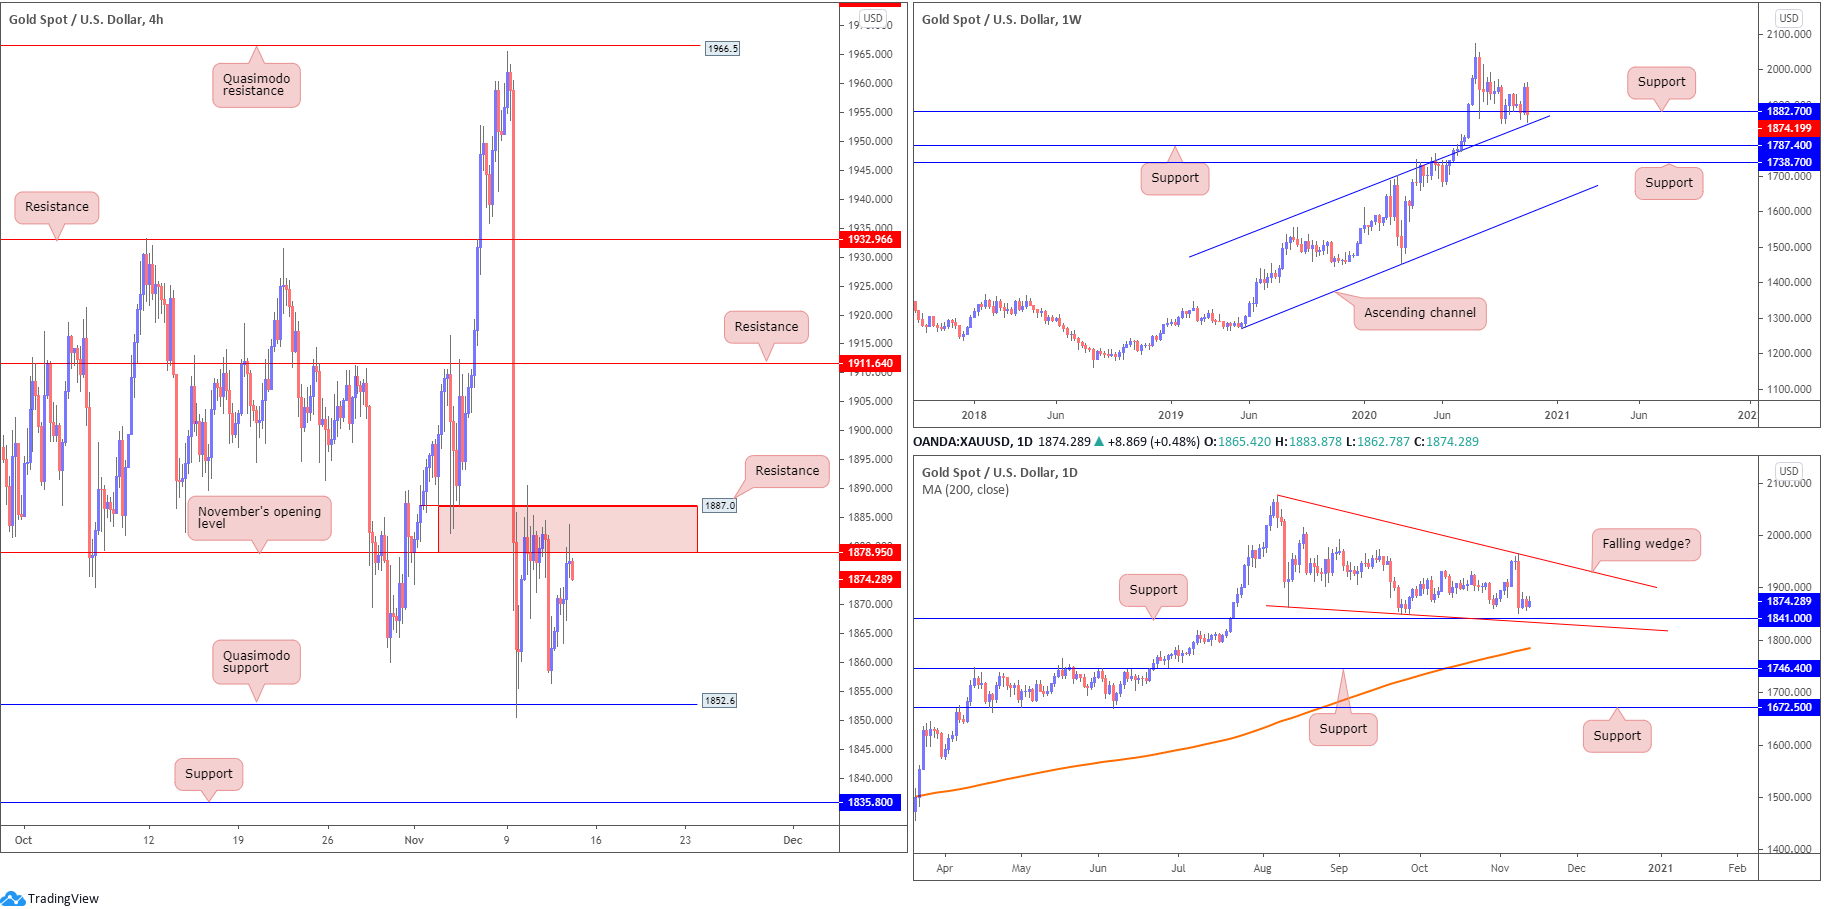
Spot gold steadily gained on Thursday, amid COVID-19 concerns and an indecisive dollar. Leaving H4 Quasimodo support at $1,852 unchallenged and reclaiming previous losses, bullion edged higher and had H4 cross swords with resistance (red), made up of November’s opening value at $1,878 and resistance at $1,887 (a previous Quasimodo support level).
Above $1,887 shines the spotlight on another layer of resistance at $1,911, whereas selling from the aforementioned H4 resistance could eventually pull things through Quasimodo support at $1,852 to welcome H4 support at $1,835.
Higher up on the curve, weekly price recently dipped a toe under support at $1,882, coming within striking distance of channel resistance-turned support, taken from the high $1,703. Traders may also want to bear in mind the price of gold remains in a decisive uptrend. What’s also interesting from a technical perspective is daily support drawn from $1,841 converges with the weekly channel support. Another feature worth highlighting on the daily chart is a possible falling wedge pattern between $2,075/$1,862.
Areas of consideration:
- H4 resistance at $1,878-$1,887, currently attracting sellers, could see additional selling enter the market today. A breakout above the aforementioned area, on the other hand, places focus on bullish breakout strategies towards H4 resistance at $1,911.
- The H4 Quasimodo formation at $1,852 offers possible support, in light of weekly support from $1,882 also in play.
- Should H4 support at $1,835 nudge its way into the limelight, the pendulum swings in favour of buyers here in terms of technical confluence: daily support at $1,841 and weekly channel support.
The accuracy, completeness and timeliness of the information contained on this site cannot be guaranteed. IC Markets does not warranty, guarantee or make any representations, or assume any liability regarding financial results based on the use of the information in the site.
News, views, opinions, recommendations and other information obtained from sources outside of www.icmarkets.com.au, used in this site are believed to be reliable, but we cannot guarantee their accuracy or completeness. All such information is subject to change at any time without notice. IC Markets assumes no responsibility for the content of any linked site.
The fact that such links may exist does not indicate approval or endorsement of any material contained on any linked site. IC Markets is not liable for any harm caused by the transmission, through accessing the services or information on this site, of a computer virus, or other computer code or programming device that might be used to access, delete, damage, disable, disrupt or otherwise impede in any manner, the operation of the site or of any user’s software, hardware, data or property


